Modern Economy
Vol.5 No.6(2014), Article
ID:46911,17
pages
DOI:10.4236/me.2014.56064
An Indicator-Based Calculation Tool for Rural Areas to Make Aware of Long-Term Mobility and Residential Costs
Eva Haslauer1, Dagmar Schnürch2, Thomas Prinz2, Sebastian Cadus2, Bernhard Castellazzi2
1Department of Geoinformatics-Z_GIS, University of Salzburg, Salzburg, Austria
2Studio iSPACE, Research Studios Austria, Salzburg, Austria
Email: eva.haslauer@sbg.ac.at
Copyright © 2014 by authors and Scientific Research Publishing Inc.
This work is licensed under the Creative Commons Attribution International License (CC BY).
http://creativecommons.org/licenses/by/4.0/


Received 13 February 2014; revised 12 March 2014; accepted 30 March 2014
ABSTRACT
Due to high costs of building land, larger available areas in the countryside, and other personal reasons people often decide to live in or move to suburban or peripheral areas [1]. The decision of people concerning their residential locations by only taking into account a cheap building land may at first seem reasonable. However, after some time the costs for living in suburbs or in the countryside rise up, and the use of car increases due to a restricted public transport. Travel times to working places and/or cultural and leisure facilities increase when people move farther away [2]. Children may need to be taken to the kindergartens or to school by car because of restricted public transport offers [3]. The rising gas prices cause significantly higher travel costs. These are just a few facts, why a broad range of aspects should be taken into account when making residential location decisions. The following article wants to tackle this topic of long-term cost awareness due to residential location decisions and present a settlement cost calculator developed for a rural area in the Austrian pilot region of Salzburg.
Keywords:Mobility and Residential Costs, Rural Development, Cost Calculators

1. Introduction
In the pilot region for the study at hand, namely Salzburg hinterland, the challenges of high costs for building land around the city area and the restricted public transport offers in rural areas are given facts. Many spatial development strategies and policies for regional and urban development, applicable to the region around Salzburg city as well as EU-funded projects (e.g. MOR€CO, EULE), developed strategies and tools to foster a sustainable, resource-friendly settlement development located around existing supply of facilities and public transport axes (see [4] ). For this purpose it may be necessary to raise awareness of the residential population for these topics on the one hand and to combine planning measures and spatial policies with demands of the residential population on the other hand. Thus, house hunting households need to be informed about consequences of individual moving decisions and spatial planners regarding the consequences of assigning building land.
The article at hand wants to present and analyze this topic through findings from the MOR€CO (MObility and ResidentialCOsts) project. The main tasks in the project are the assessment of planned or existing residential building land regarding mobility costs as well as residential costs, and the awareness raising of this topic. The results of this assessment are available in form of cost calculators for private households and spatial and regional planners. With this article, the authors want to concentrate on and communicate the cost calculator for spatial and regional planners, which is available in German language only at the moment and can be viewed at www.moreco.at. Further information about the project is available via www.moreco-project.eu
In more details, this article answers the following questions: 1) What influences residential location decisions? 2) How is mobility behavior characterized in urban and in rural areas? 3) Can cost calculators raise awareness of long-term consequences of location decisions? 4) What are essential indicators in a cost calculator for spatial planners? 5) How can a possible cost calculator look like?
The article starts with an introduction of the pilot region in Austria, followed by a literature overview of research done in the realm of mobility and mobility behavior. It next presents existing cost calculators and the derivation of spatial indicators for the calculator. Next, the development of the MOR€CO Tool for Settlement Assessment is presented, including the analysis, design and implementation processes, which are examined. Finally conclusions are drawn and discussed.
2. Characteristics of the Pilot Region
The Austrian pilot region is located in the north of the province of Salzburg (see Figure 1) and includes the
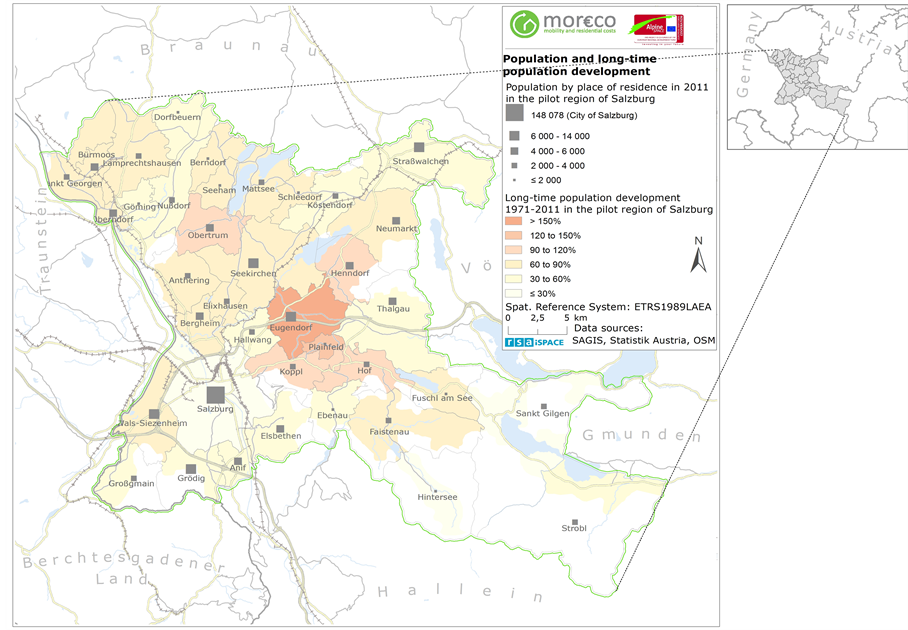
district of Salzburg-Umgebung. In order to underline the strong relations between urban and rural area, the city of Salzburg is taken into account in the overview of the pilot region.
The total number of population in the pilot region was 290,443 in 2011. The past population development within the pilot region from 1971 to 2011 showed positive values for the whole region ranging between +10% to +150%. The population projection from 2007 to 2032, according to [5] , presents positive value-ranges as well for most of the municipalities in the pilot region. Negative values are projected only for 3 municipalities in the pilot region. As mentioned before, one reason why people tend to move away from city centers to rural or suburban areas is the high price of building land in the city area. In 2012 the average prices within the pilot region varied between 87.5 €/m² in the hinterland and 662.5 €/m² in the city of Salzburg. This is a difference of 575 €. In comparison to 2011, the prices of building land within some municipalities changed considerably. In the city of Salzburg, for example, the average price rose by 224.5 € [6] . An analysis of population and households may seem very basic, but the number of households can be directly linked to the number of cars. According to [8] the traffic volume will increase due to a rise in the number of one-person households, because many actions are household-related. Most households in the pilot region in 2011 were registered in the City of Salzburg (68,693) followed by Wals-Siezenheim (4,468), and Seekirchen (3,412 households). The average number of people living in one household in the pilot region was 3.6 in 1971 and decreased to 3.0 in 2001. Thus, the dominating household types in 2001 were oneand two-person households. Only in four municipalities the dominating household type was a four-person household. The highest proportions of one-person households in the pilot region were registered in the city of Salzburg (44%) as well as in 2 surrounding municipalities [7] .
On average 76% of all households in Austria own a car, thus an increase in households often relates to a rise in the number of cars, because many activities are household-related [8] . The rate of motorization identifies the number of cars per 1000 inhabitants. In 2011 there were on average 527 cars in the province of Salzburg that fell upon 1000 inhabitants, i.e. one car was used by 1.9 people. This indicator differs noticeably depending on the region: In the city of Salzburg 496 cars fell upon 1000 inhabitants. This means one car was available for two persons. In rural regions, like most of the pilot region there were 581 cars per 1000 inhabitants, thus one car was used by 1.7 persons. These numbers show that in 2011, 58% of the people in the pilot region and 50% of the people living in the city of Salzburg had a car available [9] .
Next to motorization, also the traffic behavior of the people changes depending on their residential location. Table 1 gives an overview of the traffic behavior in 2004 [10] in the city of Salzburg on the one hand, and the region of Salzburg-Umgebung and Hallein1 (2 rural districts of the province of Salzburg, next to Salzburg city) on the other hand. The samples refer to any random person older than six years in the respective districts, who left the house at least once during the observed period; only distances up to 300 km were considered.
Table 1 shows that the average number of activities in the rural area of Salzburg-Umgebung and Hallein was less than in Salzburg city (1.8 vs. 2.0) and also the number of paths per person (frequency) was slightly lower in the rural area (3.4) compared to the city (3.7). Regarding the total distance covered per day, a substantial difference is detected between the two regions: People from Salzburg-Umgebung and Hallein travelled 35 km on average and therefore about 10 km more than people in the city (~25 km). This was opposed to the people’s perception. They estimated the average distance travelled per working day (walking and driving ways) in 2004 to
be 10.8 m in Salzburg-Umgebung and Hallein, and 6.7 km in the city of Salzburg. Also the average travel duration per working day was estimated and amounts for 21.4 min in the city and 23.3 min in Salzburg-Umgebung and Hallein [10] . Regarding this information it can be stated, that the average distance of a trip in Salzburg-Umgebung and Hallein is about 4 km longer than in the city, while the estimated average duration is only 2 min shorter in the city. Hence, it can be concluded that people in the city travel more often, but shorter in terms of time and distance. In other words, people in the districts of Salzburg-Umgebung and Hallein took fewer trips that were longer and more time-consuming.
In 2001 there were 148,344 commuters in the pilot region (=employees by place of residence). When examining commuter balances, it can be distinguished between commuters travelling to outside of their originating municipality (“external commuters”) and those commuting within their originating municipality (“internal commuters”). Most of the internal commuters live in Salzburg city, Strasswalchen, and Sankt Gilgen. The lowest proportion is registered in Göming. In 2001 there were only seven municipalities considered as in-commuting municipalities (positive commuter balance), meaning, more people commuted in than out. All other municipalities had negative commuter balances [7] . A GIS-based travel-time analysis in the pilot region shows that the longest distance covered by daily commuters (crossing municipalities) is from 61 km resp. 43 min (40 commuters), whereas the shortest distance is 3 km resp. 4 min (132 people) [11] .
[12] showed that in 2007 more than 50% of all distances in the whole province of Salzburg were covered by car. Besides, approximately 17% of the travels were taken by public transport, 11% by bike, and 18% by foot. Focusing on the pilot region, a slightly different modal split distribution is obtained. In 2004 even 65% of all travels were undertaken by motorized individual traffic, travels by foot covered about 15%, 12% was taken by public transport and 6% by bike.
[7] analyzed the commuters’ choice of transport in 2001. Thereby external and internal commuters were analyzed. The majority (~52%) of the internal commuters in Salzburg-Umgebung travelled by car, and around 3% took a motorbike. The rest (~45%), made use of eco-mobility, i.e. foot, bike, or public transport. Compared to commuter flows only within the city of Salzburg, people in Salzburg-Umgebung made less use of eco-mobility (−10%). Thereby, the use of buses decreased significantly from 23% within the city to 2% in Salzburg-Umgebung. Turning to the modal split of external commuters in Salzburg-Umgebung, the situation was rather different: More than three-quarters (81%) went by car or by motorbike. This represents an increase of more than 25% compared to internal commuters. Besides, the use of buses and trains gained a lot more importance (10% and 7% respectively) [7] .
These analyses show a higher car-dependency in rural, often dispersed areas, and a higher usage of public transport in urban areas. To find out about how the modal split has changed, only values from the province of Salzburg versus the region of Salzburg-Umgebung plus Hallein were available [10] [12] . The development of these regions between 1995 and 2004 resp. 2007 is presented in Table 2.
Summing up, the development in Salzburg-Umgebung and Hallein in the past twelve years shows a substantial increase of car use (driver) from 56% to 65% and a decrease of travels by foot from 22% to 14% [12] . This rise is important when considering that the number of commuters rose by a quarter between 1991 and 2006 in Austria [8] and will further increase in future. The development will thus have a strong effect on future traffic volume.
In order to measure the accessibility in the pilot region, networkand potential-analyses are conducted. To compare supply and demand in the public transport sector, public transport stops of bus and local trains in the

Table 2. Modal split of commuters in general in 1995 and 2004 resp. 2007.
pilot region (provided by SAGIS in 2009) are analyzed concerning their customer potential. Therefore service areas of 500 m walking distance around bus stops and 1000 m around train stops are calculated and a population grid (250 × 250 m) from 2008 is overlaid [13] . From this intersection the number of inhabitants within the service area was summed. The analysis shows that 222,504 (78%) people live within a distance of 500 m around bus stops, 13,915 (5%) people live within 1000 m around train stops, and 50,748 (18%) live outside of both distances. In the same way the customer potential of selected local supply facilities (schools, supervision and care centers, medical care, daily supply facilities, posts, and banks) outside the city region was analyzed. Service areas were calculated for walking distances of 1000 m and 2000 m and a population grid with a cell size of 250 × 250 m from 2008 was overlaid again. In the rural pilot region of Salzburg (excluding the inhabitants and area of Salzburg city) there are 91,091 people (65%) living within 1000 m, and 28,156 people (20%) living within 2000 m around service facilities. 19,923 (15%) people live outside of both areas. In order to foster regions of short ways it is necessary to guarantee the availability of supply facilities in walking or bike-riding distance, and connectivity to an effective public transport network with a good service frequency. Therefore spatial planning and mobility planning have to go in line. Regions of short ways can help to decrease car-dependency and thus reduce traffic [8] .
SWOT Analysis of the Salzburg Pilot Region
Based on the characterization of the pilot region presented in Section 2, a SWOT (strengths, weaknesses, opportunities, threats) analysis was conducted. The findings are presented in Table 3.
3. Literature Review
3.1. Mobility
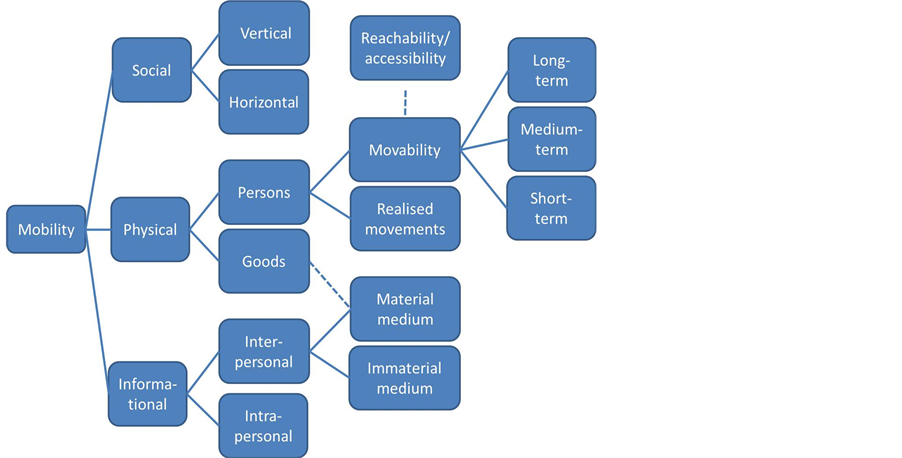
Per definition mobility is part of the people’s lives including aspects like flexibility, activities and being able to move from one place to another. Scientifically, the meaning of mobility depends more on the context in which the term is used [15] . The different meanings of “mobility” are outlined in Figure 2.
[16] divides mobility into social, physical or informational mobility activities of persons or goods. According to [17] social mobility can further be distinguished between vertical mobility, including different layers of society, and horizontal mobility, which differentiates between various groups within one society layer. With regard to informational mobility [16] separates inter-personal mobility and intrapersonal mobility. Inter-personal mobility in this realm refers to media-linked mobility between persons; intra-personal mobility describes the mental mobility of one person. Intra-personal mobility can in turn take place with or without material transport. Last, the personal mobility is divided into theoretical/potential movability on the one hand, and realized movements in the short-, mediumor long-term, on the other hand. Short term in this context describes everyday mobility, resp. mobility on a daily basis. Medium-term mobility refers to temporal but reversible changes of locations, and long-term mobility includes migration or movements of a whole family and/or household [15] . The term “mobility” in the context of the article at hand will be used as physical mobility of persons in space. Mobility of private households is here seen as the potential changes of location that one or more members of a household make to satisfy certain needs [15] .
3.2. Residential Location Decisions and Motivation
Long-term residential location decisions and decisions to move can be influenced by norms, lifestyle factors, quality of life aspects, or housing preferences. The motivation to change a location can be identified as the ability to change one’s behavior, and influences initiation, intensity, persistence of behavior, or direction [18] . According to [19] (cited after [18] ), motivation has the following principles:
• The goal of motivation must be attainable.
• The goal must be perceived as a desired goal and which people believe is good for them.
• People need reasons for what they do.
• Conditions can affect the action’s value and the perception of attainability.
Important influencing factors concerning the attractiveness of a location are accessibility and proximity (e.g. distance to central business district, access to job centers, access to public green and recreation areas), socio-economic parameters like residential density, neighborhood or municipal image, or the availability of public
transport facilities [20] -[22] . [20] further emphasizes, that a desired residential location is influenced by social factors like social status, risks (e.g. getting a victim of robbery), and the sense of belonging to a neighborhood. Concerning housing and property prices, the main influences, as stated by [23] are the view, air quality, noise level, and other structural and neighborhood attributes. Positive influences do have the view and neighborhood structures, negative influences on the other hand do have air quality and noise pollution. Besides, [23] state that residents are willing to pay more for an apartment or house with desirable natural amenities. Further reasons to move into urban areas are working related or educational reasons, and income. Considering that so many factors play roles in residential location selection, successful residential location choice has been viewed as a process of balancing trade-offs among residence’s accessibility, preference and characteristics of housing [24] (cited after [18] ). Residential location decisions, according to [25] are generally influenced by factors like pollution, crime, and housing affordability, dissatisfaction with the house itself or the household structure (e.g. results of birth, death, divorce or marriage). They call these factors, according to [26] , “push factors”, as they can force people to change their residential location. On the other hand they mention “pull” factors, which attract people to move. These factors include access to a good public service structure (health care, education, etc.), employment, leisure and recreational facilities, or other housing ambitions. These factors influence the initial decision to change the residential location. After this general decision is taken, other related decisions concerning tenure, house, locations, or neighborhood are made. This principle underpins their opinion that residential location decisions are taken in stages, and they emphasize that these decisions often depend on the stage of the peoples’ life cycle.
Also [22] notice that people’s preferences for housing and residential locations change with the course of their life cycle. Households with children for example, would rather prefer locations with good access to green spaces and the natural environment as well as good environmental parameters (e.g. clean air). On the other hand, households with no children would rather prefer locations with low commuting costs, good accessibility to job and other activity centers. Those households also have a strong preference for low-density dwellings [22] [27] . This is also underpinned by [28] who again emphasize that household composition has a strong influence on residential location decisions. Single households or people being separated or divorced tend to move to urban areas rather than people with new partners, households with children, or young families, which in turn rather move to suburbs.
[28] further found out that people often return to places where they once lived before. This is due to still existing ties with the former place of living, emotional reasons, or because of once having taken wrong decision concerning the movement. Further they state that people always tend to move to a similar environment as they have lived before, whereas it is not yet defined if this affinity is related to childhood or adulthood experiences.
In relation to transport factors [29] states, that people are willing to accept longer commutes as long as they are closer to local amenities, which can be lakes, rivers or specific buildings. [25] found out in their extensive literature review, that especially households in and around Los Angeles commute more than they actually would need to, which leads to the conclusion, that commuting alone is not a highly important factor during the residential decision process. A totally different view proposes a study in Oxfordshire, UK, which reveals, that transport factors indeed are important, and that long travel times to work or shopping facilities can influence the decision to move (“push factor”). Another survey from the US shows, that transport factors become more important in a later stage of the people’s life cycles. School quality for example decreases heavily in a later stage, whereas transport factors, i.e. access to public transport/road network, increases.
3.3. Relevant Existing Cost Calculators
In order to make people, but also spatial planners aware of mobility and residential costs at different residential locations, various cost calculators have already been developed in recent years. Also in the project MOR€CO cost calculators are developed that make aware of negative consequences of residential location decisions. One of them is called MOR€CO Tool for Settlement Assessment. The target groups of this calculator are spatial and regional planners who are in charge of—among others—assigning new building land.
This section presents tools, which were found during a literature review or were recommended by planning or research experts. Already existing calculators also served as basis for the development of the MOR€CO Tool for Settlement Assessment in terms of design, setup and content. It was also assumed that regions in Germany or other regions in Austria may have similar problems and challenges like the Salzburg pilot region. Thus, mainly tools in German language were examined.
3.3.1. EFES—Energy Efficient Development of Settlements (German)
This tool serves as a planning and steering instrument as well as a praxis-oriented assessment tool. EFES examines the energy efficiency of settlements in Austrian municipalities concerning—among others—the (building) development and location-dependent traffic relations. The tool estimates areas and distances, and compares data of single-family houses with multi-family houses. It uses information about the household structure (how many people, how old, etc.) and the supply with renewable energy resources, resp. the desired energy supply.
Concerning spatial data, this tool provides no address search but the name and the code of the respective community is required which leads to a pre-fill in of municipality-specific data. The tool was published in the framework of a project which lasted from 01.10.2008 to 30.09.2010 and is available via: http://www.energieeffizientesiedlung.at/
3.3.2. ELAS—Energetic Long-Term Analyses for Settlement Structures (German)
The ELAS-calculator works with partly pre-calculated data for Austrian settlements but one can also insert individual data when, for example, choosing a settlement in Germany. The tool aims at the presentation of consequences of a settlement structure concerning the use of energy in form of a coherent parameter. For this tool two different modes are selectable: a mode for private households and a mode for municipalities.
The topics are divided into: location details, building details, electricity, municipality, mobility, regional economic analysis, and results. The ELAS calculation tool can be downloaded via the following link: www.elas-calculator.eu
3.3.3. How Much Is the Building Land? (German)
This tool is divided into an online version simulating follow-up costs and an Excel-based version estimating follow-up costs. The online tool offers the opportunity to test playfully your own building-land-strategy in your municipality concerning (follow up) costs. The follow-up costs simulation tool shows how the costs for technical infrastructure and green areas are rising depending on various planning-strategies, and who has to pay for it. This tool is kept rather simple. The user has to provide information about the relevant municipality concerning how many flats will be built in future and where they are planned to be built. Based on that, follow-up costs are calculated for the next 40 years. The Excel based version is more complex. The follow-up costs can be chosen to be estimated for one potential residential building area (concerning construction plan) or for more potential residential building areas (concerning land use plans).
In both tools the planning alternatives for the settlement development are considered as well as their follow-up costs. Also a comparison of various alternatives is possible.
The tool was built by Gertz-Gutsche-Rümenapp Stadtentwicklung & MobilitätGbR and can be downloaded at: http://was-kostet-mein-baugebiet.de/cms/index.php?action=single&lang_key=de&id_live_cms_data=1&PHPSESSID=648035b5176af99e6cd3d539f60f4691
3.3.4. WoMo—Living and Mobility Cost Calculator for Munich and Hamburg (German)
This residentialand mobility-cost calculator gives an overview of all costs of possible residential locations including the comparison between different means of transport. Additionally the tool informs about the travel time consumption and the ecological footprint, as well as the CO2 footprint.
The tool indicates working locations and (planned, new) residential locations (per address-search) for calculation and can also evaluate further possible locations for comparison. Also information about the structure in a household and the travel mode to work is mandatory.
The calculator was developed by GertzGutscheRümenappGbR in Hamburg. It was developed for the Munich transport and tariff association and was published in 2011. It is available at: http://womo.mvv-muenchen.de/
A similar tool was developed for Hamburg. It supports the transparency of consequences of a location decision and of the utilization of land in Hamburg. With the tool the user can easily calculate the residential and mobility costs for a household and for a current residential location in Hamburg as well as in the surrounding area. The calculator offers the opportunity to present all costs for living and mobility for one household in one overview.
The tool was online on the in January 2009. The partners for development were HCU (Hafen City University Hamburg), GertzGütscheRümenapp, and F + B Forschung & Beratung. The tool is available at: http://www.womo-rechner.de/rechner.php
3.3.5. Zeiner Mobility Calculator (German)
The tool calculates mobility costs of various transportation modes as per-person-kilometers. No data is required, except for a personal cost calculation the user has to insert the main transportation mode and the distance in kilometers. Average values for transport are calculated according to the transport mode. One can also add personal data. The calculation in general is rudimentary. The outputs of this calculation are: Costs and CO2 emission per year per transportation mode and the individual distance travelled. The data for the cost calculation originate from a study of INFRAS and IWW from 2009 and was complemented with data from the VCÖ. The tool was developed by K.-H. Zeiner in 2012 and is available at: http://www.zeiner.at/mobility/index.html
3.3.6. Energy Certification for Settlements (German)
The Energy Certification for Settlements is available for Lower Austrian municipalities and is based on Excel. This tool calculates the overall energy efficiency of settlements. The user of the tool has to give information on the development plan, distances to important public facilities and infrastructures, land reserve for future construction and topography. Based on defined parameters building alternatives on different locations can be compared to each other. The output includes development costs per living unit per year, CO2 emissions of traffic per living unit per year, and quality of location and building. Also the settlement in general is evaluated due to the scheme from A (very good or efficient) to G (rather inefficient). Also a comparison with a model settlement is presented and the values are projected for the whole district or province.
The project report can be found at: http://www.energieausweis-siedlungen.at/wp-content/uploads/2009/04/bedienungsanleitung-energieausweis-fur-siedlungen.pdf. The Energy certification tool was published in January 2011 and can be tested at: http://www.energieausweis-siedlungen.at/
3.3.7. Traffic Follow-Up Cost Estimation Tool (German)
This is an Excel-based tool that estimates midand long-term costs of settlement development. The tool was created mainly for the branch of building land development and for the assessment of traffic and infrastructural costs (internal and external development of traffic and public transport).
The data requirements concern the planned development area. Here the user can insert detailed data or he/she chooses from proposed statistical data or averaged values.
The tool presents detailed information about traffic connection and development (crossing aids, traffic island), and a detailed cost report. It furthermore is suited for traffic planning. The data bases can be found at http://edoc.difu.de/edoc.php?id=19OL85Z7. The tool itself was presented in October 2010 as version 1.0 and can be downloaded at: http://www.bbsr.bund.de/cln_016/nn_629248/BBSR/DE/Veroeffentlichungen/BMVBS/Online/2011/ON022011.html
3.3.8. ICMA—Improving Connectivity and Mobility Access (English)
This is a cost price model in English language. It is an Excel based tool divided in three sections: Social Framework, Financial Framework—Costs, and Financial Framework—Revenue. With this tool traffic companies and commissioners should be able to model cost structures of multi-modal mobility services also if they are provided by different institutions. The tool allows the users to get a detailed understanding of the most important cost parameters of the DRT (demand responsive transport) from the perspective of the end-user as well as the provider before a service is implemented. This shall enable users to identify the consequences that a schema will have on costs and turnovers.
Further information can be found at: http://www.icma-mobilife.eu/fileadmin/icma/uploads/cost_models/The_Master_SPT_Virtual_Fleet_and_Cost_Price_Report_April_2011.pdf. It was published online in September 2011 and can be downloaded at: http://www.icma-mobilife.eu/themes/economics/
3.3.9. Cost Calculator Schwerin (German)
This tool is divided into two separate tools: one for calculating mobility costs and one for giving residential location information. The residential location information is a free offer of the City of Schwerin. One is counseled competently, and independently. The target groups of users for this tool are households looking for a new residential location.
The mobility calculator roughly estimates commuting costs to the workplace and/or place of education. The user can also compare different locations with each other. For the residential location information he/she has to state which form of living he or she is searching for (rent, buy) and how important different characteristics are (e.g. quality, security, etc.).
The tool was published in October 2011 and was developed in the project “Wohnstandortberatung” (residential location consulting) and can be downloaded at: http://www.schwerin.wohnstandort.info/
3.4. Cost Calculators—Synthesis
• The various calculators are quite heterogeneous. One part of them is Excel based (e.g. energy certification, ICMA calculator, Traffic follow-up costs estimation tool, How much is the building land) others are programmed as online applications (e.g. WoMo, Zeiner, ELAS).
• The basic supply is considered in the ELAS calculator, in EFES, in the energy certification and the calculator of Schwerin. EFES considers the basic supply when describing the settlement itself. The user has to define the extent of the next local supplier within 300 m and is asked to define the accessible/available area of local supply. The ELAS calculator considers local supply data too by asking the user if there’s a retailer, an elementary school, a doctor, post, bank, pharmacy etc. around in the village/town. Accordingly, a degree of centrality is assigned. Also the energy certification of settlement considers local supply in form of categories where the user has to define how far away the next playground, etc. is. Also the calculator of Schwerin is taking into account the local supply by asking about the importance of different local supply facilities to be reached within walking distance.
• Diagrams as outputs are presented in the energy certification, in the traffic follow-up costs estimator and in the tool “How much is the building land?”
• Energy data is considered in the EFES and ELAS calculator only.
• The calculators of Munich and Hamburg (both WoMo), and the calculator of Schwerin use GIS applications to define working places or residential locations.
• A relationship to existing municipalities is established via the municipalities’ code in EFES, ELAS, and at the traffic follow-up costs estimation tool.
• Scenarios are calculated in the ELAS calculator and the Traffic follow-up costs estimation tool. ELAS provides two possible scenarios: the trend scenario and the green scenario. The trend scenario extrapolates trends until the year 2040. The green scenario implies a more respectfully treatment of environment. The output is consisting of the same data as it was for the cost calculation, just new values are assigned. The other tool calculates values anyway until 2038.
• The calculator of Schwerin is the only calculator that works with slide bars for data input.
• A comparison of alternatives is possible e.g. with the tool “How much is the building land?” with the energy certification for settlements, with the WoMo calculator of Munich as well as with the calculator of Schwerin.
• Different modes can be chosen with ELAS (private mode & mode for municipalities), in “How much is the building land” and in the calculator of Schwerin (information about location versus a mobility calculator).
Missing Items in Existing Cost Calculators
Although a bunch of cost calculators already exist, we still identified missing topics/items which led us to the development of a totally new calculator. Important contents, that should be included in the MORECO Tool for Settlement Assessment, were mainly identified within workshops and round tables together with e.g. spatial planning experts and traffic planners of the provincial government of Salzburg. Remarks included:
• Often missing automated address search or interactive map components for selecting a residential or working location (except the Munich WoMo calculator);
• No calculator included regional indicators, characteristics of the region/municipality, or distance to or availability of infrastructural facilities (public transport stops, kindergartens, local supply, public green space…) extensively;
• The modal split is an important parameter, which is hardly considered in the analysis processes;
• Some of the existing calculators were missing CO2 emissions in the output or distance parameters and the evaluation of public transport quality;
• Greater account should be taken of the mobility behavior, especially within Alpine regions;
• To guarantee the use of the calculator, it has to fit the planning principles and objectives of the region which it serves for.
These were the main points that were identified as being missing in many calculators resp. that were just partly available. The MOR€CO Tool for Settlement Assessment was therefore supposed to include:
• The opportunity to search a location by inserting the whole address or by clicking on a map;
• The analysis of the modal split in the relevant region;
• An output table including CO2 emissions and an overview of distances and overall qualities like for public transport;
• The mobility behavior, as for example big differences in height cause a changed use of transport mode;
• An orientation on existing planning principles and development objectives of the region.
4. Result—The MOR€CO Settlement Calculator The following section gives an overview of the development of the MOR€CO Tool for Settlement Assessment and its implementation in the pilot region around the city of Salzburg. The aim of the tool is to assess areas within the pilot region concerning various indicators, which have an impact on the resulting mobility costs of a possible household living there. The tool shall be used by planners to get an objective basis for decision making processes in terms of settlement development. When dedicating new settlement areas it is extremely important to consider long-term effects and costs. In order to evaluate different locations regarding these costs and effects the MOR€CO settlement calculator was developed for regional and spatial planners. By comparing specific locations or building areas concerning mobility-influencing aspects, the user of the tool gets an overview of distances to important destinations, probable choice of transport mode or mobility efforts like annual km or CO2 emissions for a statistically averaged household.
Table 4 shows the steps towards the development of a balanced indicator set. The first step is the collection of Leitbilder and objectives which can be found e.g. in spatial or regional development plans (for example regarding the topic of settlement development and mobility). As example the Leitbild of living and working in a “region of short ways”, as it was defined in the sectoral program of 2009, is mentioned. Next the definition of Leitbild-oriented indicators like the land utilization around settlements has to be done. Finally the relations and consequences have to be explored which are linked to this indicator. In the example above this would be that in purely residential areas inhabitants often have to cope with more distant ways, so they are used to take the car. In mixed settlement areas (also including commercial areas) probably more ways or transactions and activities can be done close to home, so more ways can be taken by non-motorized traffic.
This information served for developing a framework for the calculation of mobility efforts. The indicators have been transferred to spatial indicators representing characteristics of a special region or location. GIS (GeoInformation-System) tools were then used for analysis of spatial relations and influences. The outputs were several raster datasets providing information for the whole pilot area. These are afterwards visualized in a webbased calculation tool, the MOR€CO Settlement Calculator.
4.1. Derived Indicators
The following list gives an overview of the derived indicators (location related and municipality related), which
Table 4. Steps towards a balanced indicator set.
are based on indicators represented in existing cost calculators and they shall be tackling one or more objectives mentioned in the Leitbilder before:
• Proximity to social infrastructure facilities (kindergartens, schools, pharmacies, doctors, etc.)
• Proximity and quality of basic supply
• Proximity to leisure facilities and recreation areas
• Availability of private green spaces
• Proximity and quality of public transport
• Proximity to local or regional centers
• Proximity to working/job centers
• Accessibility of walking and biking lanes
• Dominating settlement type
• Land use
• (Re)densification
• Height difference Municipality related indicators
• Settlement density
• Centrality
• Averaged out-commuting distance
• Share of out-commuters
• Quality of bike and walking infrastructure
4.2. Calculation of Mobility Efforts
By using this tool, a planner shall have the opportunity to estimate upcoming mobility efforts of a certain address or estate, which in turn offers him the option to compare residential locations, in order to support a well-founded decision making process. The mobility efforts, calculated by the settlement calculator are annual kilometers driven by car of a statistically averaged household at the particular location concerning the distances to facilities proposed by the calculator, the shares of distances probably taken by motorized individual traffic and the resulting CO2 emissions. An important interim result is the modal split estimated for a particular location. In Figure 3 the processing steps are presented. The main inputs are the spatial indicators, a regional modal split, and the number of ways to various targets. The single steps cover: 1): based on a regional modal split and the indicator values, a modal split is estimated for the considered location; 2) The annual kilometers of an average household are estimated by multiplying the number of ways to certain target locations with the related distances; 3) Based on the estimated modal split and the calculated annual kilometers of a statistically averaged household, the share of kilometers is calculated, which will probably be taken by car; 4) Based on these findings the CO2 emissions are calculated caused by individual motorized traffic through multiplication of the kilometers taken by car with an averaged value for CO2 emissions per kilometer.
4.3. Implementation and Visualization in a Web Viewer
The results for the pilot region of Salzburg in form of a web-based application are available at:
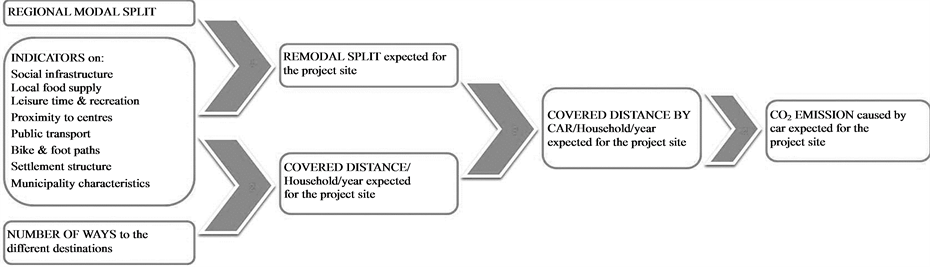
Figure 3. Calculating mobility efforts [32] .
www.moreco.at/siedlungsrechner. The application is divided into 4 themes (see Figure 4): “Local Infrastructure”, “Connection & Traffic”, “Municipality & Settlement”, and “Results”. After defining the respective location by either clicking on the map or directly entering an address, the user gets the information/values for each indicator. The input indicator values can be changed by the user optionally or the sample values (averaged values of the whole province of Salzburg) can be kept. Afterwards the user gets overview of the overall results which shall help him to evaluate a location regarding the suitability to serve as sustainable residential location.
4.4. Calculation Example
For better understanding of how the calculator works, we explore an example. We do a settlement assessment for a project site in the municipality of Koppl. Koppl is located around 9 km away from the city of Salzburg. It has a low centrality rank and a settlement density of 42 inhabitants per hectare of building land. The particular project site we assess here is close to the municipal center which consists of the church and the municipal administrative office. There is located a bus stop next to our project site, having a low service frequency. The neighborhood is dominated by residential buildings mainly consisting of single and double-family houses. The project site can furthermore be characterized as a gap closure, since it is directly adjacent to other, already existing building sites.
After clicking on the map to identify the exact location of the sample project site, default values are automatically filled in at the respective fields. Thus, the calculated results for this project site can be viewed immediately. Figure 4 gives an overview of the parameters values and the results for the respective example.
On top of the result sheet is a diagram which gives a summarized overview of the existing local infrastructure in the environment of the project site. Below, the user is shown the modal split of the whole region, where the project site is located in, as well as the estimated changes concerning the modal split for residents at this particular location. In this case it can be expected that the share of individual motorized transport is higher than the average value for the region. This is because of the long distances to many facilities, which supports this mode

Figure 4. Web-application of the MOR€CO Settlement Calculator.
of transport. Next to this, on the right side, the public transport quality at the project site is evaluated. In this example the public transport quality is evaluated as “medium”, saying that the distance to the next bus stop is more than 250 m, the service interval at this bus stop is above 60 min, and there is no regional train stop around.
Finally, at the bottom of this sheet, the annual distances in kilometers are estimated for a statistically averaged household (2.32 people [33] ) living at this location. On the left, ways to and from work are excluded, on the right, these ways are included. Only the distances to local infrastructures and to centers are included here. Holiday trips, for example, are not included in this estimation at all. For this project site the calculation estimates 6500 - 7000 km per year in total not including ways to and from work. On average, 4000 - 4500 km of this amount will be covered by individual motorized transport causing CO2 emissions of 0.7 to 0.8 t per year. When looking at the result, including ways to and from work, the annual kilometers rise up to 11,000 - 11,500 km, of which 7500 - 8000 km will assumable be covered by individual motorized transport. In this case CO2 emission of 1.3 - 1.4 t per year can be expected. Due to individual mobility behavior, like e.g. in the field of leisure time related ways, significantly higher values can be expected in reality.
5. Conclusion and Discussion
This final section sums up and discusses the proposed research questions:
1) What influences residential location decisions?
Residential location decisions are influenced by a broad range of factors. But, first of all, a person or a household needs a motivation to change a residential location. Motivation in this context is defined as the ability to change behavior. It forces people to act because certain behavior is directed towards a certain goal. When people act, they need reasons to do so. The motivation of changing a residential location depends on the goal, which must first of all be attainable and the goal must be perceived as a desired one and one that can be recognized as good. Finally conditions under which actions take place can affect the action’s value and the perception of attainability. This underpins the fact that residential location decisions are often taken in stages. First there are pushing factors, like crime, dissatisfaction or changed affordability conditions that force people to think about moving. On the other hand there are pull factors that attract people to other locations, like service quality, employment and recreational opportunities etc. This leads finally to the decision to move to a new home and to make a new residential location decision. And finally, related decisions about the type of neighborhood or house and the location etc. are made. Further influencing factors are the attractiveness of a certain location as well as the accessibility and proximity to certain service facilities (supply facilities, leisure and recreation facilities), socio-economic parameters like residential density, neighborhood or municipal image, the availability of public transport facilities or social factors like social status, risks (e.g. getting a victim of robbery), or the sense of belonging to a neighborhood. Similar factors also influence house or property prices: view, air quality, noise level, and other neighbourhood related attributes. Residential location decisions also depend on the stage of the people’s life cycle and are related to the current household structure: single households or people being separated or divorced tend to move to urban areas. Households with children on the other hand would rather prefer locations with good access to green spaces and the natural environment as well as good environmental parameters (e.g. clean air).
2) How is mobility behavior characterized in urban and in rural areas?
The pilot region is a rural region located in Salzburg, Austria. For comparison, also the area of the city of Salzburg has been taken into account during analyses. Population increases mainly in the municipalities surrounding the city of Salzburg. This is evident for the short-term and long-term development, and the projection values. The households in the region are getting smaller and smaller. Yet the one-person households are the dominating household type in many municipalities. This trend leads to an increase in traffic, respectively an increase of individual motorized traffic. Especially commuters crossing the boundaries of their originating municipality make use of the car as driver more often. As comparison, the use of eco-mobility (foot, bike, public transport) in the city of Salzburg is 10% higher than that in the peripheral areas of the pilot region. These findings go in line with the changed degree of motorization in Salzburg, which has increased and will also do so in future. The cars per 1000 inhabitants increased from 315 in 1981 to 513 in 2011, and are projected to be 615 in 2031.
One fact that supports this trend concerns the prices per m² of building land, which increased heavily from 2011 to 2012 in some regions. For example, in the city of Salzburg, the price increased by 224 €. In all municipalities but in one the prices rose within this year.
The different living areas influence the distances covered each day. In the city center (densely populated area) the travel distance is 13.5 km on average per day, whereas 36% of these distances are travelled by eco-mobility. In comparison, people from surrounding municipalities travel 30 km on average per day, of which only 24% are done by eco-mobility. The travel behavior in the pilot region changed in a way that travels per person and day increased from 2.8 to 3.1 and the total duration of travel time increased from 62 to 68 min between 1983 and 2004. The average duration per travel activity is about 2 min longer for the region of Flachgau/Tennengau (23.2 min) than for the city centers. This means that living in the city decreases car ownership, travel distances, travel time, monetary travel costs and fosters an environmentally friendly eco-mobility. Analysis also shows that settlement density and car ownership is coupled. Car ownership increases at lower density values and the motorization rate is the highest in dispersed settlement structures. As a consequence, dense settlement structures in the city area with attractive public transport accessibility lead to a lower rate of car ownership, to a decreased individual motorized traffic and to a sustainable and environmentally friendly development.
3) Can cost calculators raise awareness of long-term consequences of location decisions?
During literature research, it has become evident that a range of cost calculators estimating residential, traffic, mobility, energy, or infrastructural costs do already exist. So, the authors came to the conclusion that these tools seem to form a good basis to make people aware of long-term consequences due to location decisions. Nevertheless, it seems important not only to inform private households but also those people who assign building land, and plan future building projects. Because of these reasons, the MOR€CO Settlement Calculator was developed for the target group of regional and spatial planners in the pilot region. Another challenge is to make people aware of the existence of such calculators and to convince them to make use of it.
4) What are essential indicators in a cost calculator for spatial planners?
To define the relevant parameters, values and indicators, spatial development plans and strategies have been analyzed concerning Leitbilder and long-term objectives. They include mainly the maintaining and development of compact settlement structures with clearly defined borders towards outer areas and economical usage of land. Furthermore, they recommend the concentration and densification of settlements along efficient public transport axes. Also, the raise of functional diversity of settlement centers is an important factor. Living and working in regions of short ways should be an ambitious goal to satisfy long-term needs concerning accessibility. This goes in line with guaranteeing a homogeneous supply of the inherent population with a low dependence on motorized individual traffic and supporting and enhancing the accessibility, usage of existing infrastructure to raise economic and social benefits and to decrease negative environmental consequences. Besides, the existing cost calculators have been examined to find out recurring indicators to describe and characterize a building project or a land parcel and attached costs.
5) How can a possible cost calculator look like?
Existing cost calculators, Leitbilder as well as strategic objectives have been considered to derive indicators describing potential locations of future residential sites regarding local infrastructure facilities, traffic connection, and other municipal and settlement characteristics. This information was turned into a web-tool to calculate settlement and mobility efforts. These consist of proximity values, travel time, CO2 emissions and estimating monetary costs per year. Excluded are holiday and business trips. The web tool was implemented as Java Servlet Application and can be accessed via: www.moreco-project.eu
Acknowledgements
The research was partly funded by the Austrian Science Fund (FWF) through the Doctoral College GIScience (DK W 1237-N23).
References
- Haslauer, E., Schnurch, D. and Prinz, T. (2013) A Spotlight on Mobility and Interconnection in Rural vs. Urban Areas. Proceedings of the GI Forum 2013, Salzburg, 2-5 July 2013, 177-186.
- Bruck, E., Haslauer, E. and Prinz, T. (2013) Social Impact of Mobility Infrastructure. Atlantis Magazine, 24.1, 14-17.
- Holz-Rau, C., Scheiner, J. and Schwarze B. (2010) Information on Residential Living Locations for Private House-holds (German). Dortmunder Beitrage zur Raumplanung, V9, Dortmund.
- Kupferschmied, J., Muhlich, N., Rubi, S. and Tschirner, V. (2014) Sechs Thesen zur Mobilitatskultur der Zukunft (Six Theses about Future Mobility Culture). Regionale Schienen, Vol. 33.
- Raos, J. and Faschinger, N. (2008) Bevolkerung im Bundesland Salzburg und den Regionen 2007-2032 (Population: Province of Salzburg and Its Regions), Salzburg.
- Gewinn Verlag (2012) Grundstuckspreise in Salzburg 2012 (Prices for Building Land in Salzburg in 2012). http://www.gewinn.com/immobilien/preisuebersichten/salzburg/
- Statistik Austria (2001) ISIS-Statistical Database.
http://www.statistik.at/web_en/publications_services/superstar_database/index.html - Verkehrs Club Osterreich (Austrian Traffic Club) (2007) Verkehr und Mobilitatim Demographischen Wandel (Mobility and Traffic in the Context of Demographic Change). In: VCO, Ed., Mobilitat mit Zukunft, Vienna.
- Statistik Austria (2012) Kraftfahrzeuge-Bestand 2011 (Number of Automobiles 2011).
www.statistik.at/web_de/statistiken/verkehr/strasse/kraftfahrzeuge_-_bestand/index.html - Herry Consult (2004) Mobilitatsanalyse 2004 der Stadt Salzburg und Umgebung (Mobility Study of Salzburg City and Hinterland), Vienna.
- SAGIS (Salzburg Geographical Information System) (2007) Travel Time Matrix.
- BMVIT (Federal Office of Traffic, Innovation and Technologies in Austria) and Verkehrs Club Osterreich—VCO (Austrian Traffic Club) (2008) Modal Split der Osterreichischen Bundeslander 2008 (Modal Split in Austria’s Provinces in 2008).
http://doku.cac.at/vcoe_mobilitaetsform_nach_bundesland_vgl_95-07.pdf - Statistik Austria (2008) Regionalstatistische Rastereinheiten (Regional Statistical Rasterentities).
www.statistik.at/web_de/klassifikationen/regionale_gliederungen/regionalstatistische_rastereinhe
iten/ - Franz, S. (2012) SWOT Analysis. Report of the MOR€CO Project.
http://www.moreco-project.eu/Results.php - Cadus, S. (2013) A Housing and Mobility Cost Calculator for the Province of Salzburg. Master Thesis, University of Salzburg, Salzburg.
- Zanger, T. (2000) Mikroanalyse des Mobilitatsverhaltens im Alltag und in der Freizeit (Microanalysis of Mobility Behaviour in Everyday Life and during Leisure Time). In: Institut für Mobilit?tsforschung (Institute for Mobility Research), Ed., Mobilitatsverhalten im Alltag und in der Freizeit (Mobility Behaviour in Everyday Life and during Leisure Time), Berlin, 19.�
- Ritter, E.H. (2005) Handworterbuch der Raumordnung (Glossary of Spatial Development). Akademie fur Raumfor-schung und Landesplanung (ARL), Hannover, 654.
- Gulic, A. (2012) SWOT Appendix 2—Motivations for Residential Site and Mobility Mode Decisions. http://www.moreco-project.eu/Results.php
- Quick, T.L. (1985) The Manager’s Motivation Desk Book. Wiley, New York.
- Kauko, T. (2006) Expressions of Housing Consumer Preferences: Proposition for a Research Agenda. Housing, Theory, and Society, 23, 92-108. http://dx.doi.org/10.1080/14036090600773097
- Raju, K.A., Sikdar, P.K. and Dhingra, S.L. (1998) Micro-Simulation of Residential Location Choice and Its Variation. Computers, Environment and Urban Systems, 22, 203-218.
http://dx.doi.org/10.1016/S0198-9715(98)00043-X - Kim, T.K., Horner, M.W. and Marans, R.W. (2005) Life Cycle and Environmental Factors in Selecting Residential and Job Locations. Housing Studies, 20, 457-473.
http://dx.doi.org/10.1080/02673030500062335 - Hui, E.C.M., Chau, C.K., Pun, L. and Law, M.Y. (2007) Measuring the Neighboring and Environmental Effects on Residential Property Value: Using Spatial Weighting Matrix. Building and Environment, 42, 2333-2343. http://dx.doi.org/10.1016/j.buildenv.2006.05.004
- Menchik, M. (1972) Residential Environmental Preferences and Choice: Empirically Validating Preference Measures. Environmental and Planning, 4, 445-458.
- Curtis, C. and Montgomery, M. (2006) Housing Mobility and Location Choice. Department of Urban and Regional Planning, Curtin University, Perth.
- Rossi, P.H. (1955) Why Families Move: A Study in the Social Psychology of Urban Residential Mobility. The Free Press, Glencoe.
- Fjortoft, I. and Sageie, J. (2000) The Natural Environment as a Playground for Children: Landscape Description and Analyses of a Natural Playscape. Landscape and Urban Planning, 48, 83-97. http://dx.doi.org/10.1016/S0169-2046(00)00045-1
- Feijten, P., Hooimeijer, P. and Mulder, C.H. (2008) Residential Experience and Residential Environment Choice over the Life-Course. Urban Studies, 45, 141-162.
http://dx.doi.org/10.1177/0042098007085105 - Chen, F. (2008) Commuting Distances in a Household Location Choice Model with Amenities. Journal of Urban Economics, 63, 116-129. http://dx.doi.org/10.1016/j.jue.2006.12.008
- Amt der Salzburger Landesregierung (Agency of the Provincial Governmentof Salzburg) (2009) Sachprogramm Stand-ortentwicklung für Wohnen und Arbeiten im Salzburger Zentralraum. Entwicklungs programme und Konzepte (Sectoral Program: Location Development Plan for Living and Working in the Central Region of Salzburg), Salzburg, 5.
- Amt der Salzburger Landesregierung (Agency of the Provincial Government of Salzburg) (2003) Salzburger Landesentwicklungs Programm. Entwicklungs Programme und Konzepte (Regional Development Plan of Salzburg: Development Programs and Concepts), Salzburg, 3.
- Schnurch, D., Cadus, S., Haslauer, E. and Prinz, T. (2013) Settlement Assessment—Framework B of MOR€CO Tools for Planners and Mobility Actors. http://www.moreco-project.eu/Results.php
- Statistik Austria (2012) Privathaushalte nach Geburtsland der Haushaltsreferenzperson, Haushaltsgrobe und Bundeslandern—Jahresdurchschnitt 2011 (Private Households by Land of Birth of the Reference Person, Household Size and Province—Annual Average 2011).
http://www.statistik.at/web_en/statistics/population/households_families_living_arrangements/house
holds/index.html
NOTES

1For this study only values for Salzburg Umgebung plus the adjacent district of Hallein—as a joint region—were available.