Journal of Environmental Protection
Vol.5 No.8(2014), Article
ID:46820,13
pages
DOI:10.4236/jep.2014.58069
Dynamic Behavior of Polycyclic Aromatic Hydrocarbons and Their Derivatives after Oils Spill in Water
Pranudda Pimsee1, Caroline Sablayrolles1, Mireille Montréjaud-Vignoles1, Julien Guyomarch2, Nicolas Lesage3, Pascale de Caro1
1Université de Toulouse, INPT-ENSIACET, LCA (Laboratoire de Chimie Agro-industrielle), Toulouse, France
2Centre de documentation, de recherche et d’expérimentations sur les pollutions accidentelles des eaux (CEDRE), Brest, France
3TOTAL Petrochemicals, Lacq, France
Email: pranudda.pimsee@ensiacet.fr, caroline.sablayrolles@ensiacet.fr, mireille.vignoles@ensiacet.fr, Julien.Guyomarch@cedre.fr, Nicolas.lesage@total.com, pascale.decaro@ensiacet.fr
Copyright © 2014 by authors and Scientific Research Publishing Inc.
This work is licensed under the Creative Commons Attribution International License (CC BY).
http://creativecommons.org/licenses/by/4.0/


Received 22 March 2014; revised 21 April 2014; accepted 19 May 2014
ABSTRACT
Within the framework of Migr’Hycar research project, the fate of oil spill was studied with the aim to characterize their physical-chemical behaviour. For this purpose, seven petroleum oils commercially available were tested and the distributions of the water soluble components were determined according to two experimental devices; laboratory conditions and pilot conditions in Polludrome. In the dissolved fraction, 41 polycyclic aromatic hydrocarbons and their derivates were quantified, among them are 16 EPA priority pollutants. A coupling of the stir bar sorptive extraction method and high performance gas chromatography mass spectrometry were used. Analyses showed that naphthalenes series constitute the major part of the water soluble fraction from fresh oils. In fact, light and heavy molecules have different contributions to solubilization kinetics. From the results, a linear correlation was established between the density of oils and the times of maximum solubilization. Moreover, the effect of 10% ethanol in gasoline was observed on the profile of solubilized PAHs in water. Kinetic patterns obtained with Polludrome showed the influence of surface water/oil ratio (WOR) on the volatilization process. Compared to laboratory conditions, the dynamic conditions of Polludrome led to an enhanced evaporation process, thus shifting the solubility peak.
Keywords:Monitoring, Water Soluble Fraction, PAHs, Stir Bar Sorptive Extraction

1. Introduction
The effects of crude oils and petroleum products in the marine environment have been extensively studied since the 1970s. The literature review showed that most of the significant spills that occurred in Europe over the last 5 years were due to accidental releases of hydrocarbons. About 90% of the reported spills were greater than 7 tons, and approximately 600 tons of industrial oils were discharged in 2002 in France [1] . Among the accidents identified, are listed accidental leakage of household or industrial tanks, petrol station leakage, wastewater treatment plant overflows, truck accidents, fire and deliberate or accidental discharges of river boats.
Within the framework of the Migr’Hycar project, experiments under controlled conditions were conducted to evaluate the dissolved oil evolution in water. This water soluble fraction is mainly composed of PAHs such as naphthalenes, phenanthrenes and dibenzothiophenes, which have a high bio-availability towards marine organisms, thus causing potential toxic effects [2] .
This context has created the obligation to monitor water quality for human consumption and industrial activities [3] . Thus, PAHs are classified as priority hazardous substances [4] . The European Water Framework Directive mentions that the sum of the concentrations of several PAHs in water for human use must not exceed 0.1 µg∙L−1. Moreover, the concentration of benzo[a]pyrène is limited to 0.01 µg∙L−1.
The fate and mobility of PAHs in the environment are mainly controlled by their chemical properties [5] . PAHs have a melting point above 100˚C and a boiling point above 300˚C. They are non-polar compounds, and their solubility in water is low to moderate for heavy compounds. The partition coefficients of PAHs match those of bioaccumulative substances, as their log Kow values (octanol-water partition coefficients) range from 3.37 to 6.5 [6] . These rather high values also indicate that PAHs can be extracted with organic solvents.
Different methods have been proposed for the extraction of PAHs from aqueous samples including liquidliquid extraction [7] , solid-phase extraction (SPE) [8] , solid-phase microextraction (SPME) [9] and stir bar sorptive extraction (SBSE) [10] . SBSE is a simple, fast, solvent-free and inexpensive sample preparation technique.
The objectives of this work were to study the dynamic behavior in water of the selected PAHs and to identify the effect of an oxygenated compound (ethanol) on the transfer of PAHs in water.
2. Material and Methods
2.1. Studied Oils
Seven different oils, supplied by TOTAL, were selected because of their common use: bitumen, heavy fuel, domestic fuel, jet fuel (A1), gasoline (SP98), gasoline (SP95-E10) and diesel fuel. Physical and chemical properties of the oils are described in Table 1, and gas chromatograms are presented in Figure 1. The oil was stored at +4˚C. Before use, light oils were kept at room temperature for 12 hours, and heavy oils were heated at 70˚C for 1 hour.

Table 1. Specifications of the oils used and their main properties.


Figure 1. Chromatograms of fresh diesel fuel (HRGC-MS analysis in SIM mode) and of the water soluble fraction after 24 h of contact.
2.2. Preparation of Water Soluble Fractions at the Laboratory Scale
In total, 1500 g of Milli-Q water (18.2 MΩ∙cm) was added to a 3 L glass beaker followed by the deposition of 150 mg of oil onto the water surface, leading to an approximately 10% surface area ratio. The mixture was gently stirred using a magnetic stir bar so that a vortex was not produced. Mixing time ranged from 0.25 hour up to 48 hours. The beaker was stored in the dark to avoid photodegradation of the PAHs. Temperature was measured continuously to account for variations in room temperature. A volumetric pipette (100 mL) was used to take an oil-free water sample after the water had been exposed to oil for a given amount of time. Table 2 summarizes the different experimental conditions. During the experiments, a blank trial consisting of a beaker without oil deposition was performed to evaluate potential pollution from glassware and the water used. To evaluate the reproducibility of the extraction protocol, water soluble fractions for each oil and mixing time were repeated twice under the same conditions.
2.3. Preparation of Water Soluble Fractions at a Pilot Scale
The weathering of crude oils is complex as different processes (evaporation, dissolution, emulsification, photooxidation, …) take place simultaneously. Laboratory methodologies exist to simulate each of these different processes. For example, evaporation can be simulated by a simple topping (distillation) per evaporation or rotary evaporation.
However, no laboratory method exists to consider all the parameters simultaneously and to simulate the whole weathering process. In order to simulate these various phenomena realistically, Cedre has equipped its facilities with a hydraulic canal (Figure 2) in which different marine as well as inland water conditions can be recreated,
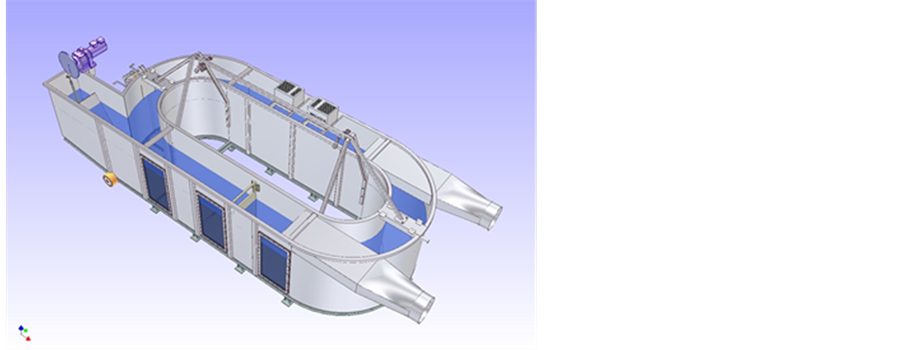
Figure 2. Device for tests at pilot scale (Polludrome).
Table 2. Experimental set up for the oil spill protocol (oil to water ratio 1:100. w:w).
such as wind, waves and UV lights. This canal consists of a loop in which the water can be circulated. Large windows located along the canal allow observations at the surface and in the water column. The canal is set in an air-conditioned room and is equipped with a wave beater (adjustable period), current and wind generators, and UV lights. With this equipment, it is possible to weather samples of a specific oil under a variety of climatic conditions.
The general characteristics of the canal are:
• Canal dimensions: width: 0.6 m; wall height: 1.4 m; average water depth: 0.9 m.
• Waves typical characteristics: period 3 seconds, amplitude ±0.1 m.
• Climate room: from 1˚C to 30˚C.
All tests were run assuming a low mixing energy corresponding to river conditions (no waves and slight agitation generated by the wind current). The corresponding parameters for the Polludrome were a current speed (water) close to 30 cm/s and a wind velocity of 5 m/s. The volume of water was 7.5 m3 for 8.4 m2 area. The temperature was set at 20˚C. Approximately 15 water samples were regularly collected, from 1 hour up to 3 days.
2.4. Quantification of Dissolved PAHs
2.4.1. Materials and Reagents
Glassware was cleaned carefully with water, Milli-Q water and acetone (HPLC grade).
The PAH mix solution (CUS9305) containing 21 PAHs (naphthalene, benzothiophene, biphenyle, acenaphthylene, acenaphthene, fluorene, phenanthrene, anthracene, dibenzothiophene, fluoranthene, pyrene, benzo [a] anthracene, chrysene, benzo [b] fluoranthene, benzo [k] fluoranthene, benzo [e] pyrene, benzo [a] pyrene, perylene, indeno [1, 2, 3-cd] pyrene, dibenz [a, h] anthracene and benzo [g, h, i] perylene) each at 1 µg∙mL−1 in an acetonitrile/acetone mixture was purchased from LGC Standards (France). A deuterated PAH mix solution (CUS11492) containing naphthalene-d8, biphenyl-d10, phenanthrene-d10, chrysene-d12 and benzo [a] pyrene-d12 each at 1 µg∙mL−1 in acetone was purchased from LGC Standards (France).
The calibration solutions were prepared by dilution of the PAH mix solution in 100 mL of Milli-Q water leading to 8 solutions: blank, 0.5 ng∙L−1, 1 ng∙L−1, 5 ng∙L−1, 10 ng∙L−1 100 ng∙L−1, 500 ng∙L−1, and 1 000 ng∙L−1. The extraction standard solution was prepared by diluting 1 mL of the deuterated PAH mix solution in 1 L of methanol (ROTISOLV ≥99.98% Ultra LC-MS by Carl Roth). The standard solutions were stored in amber glass bottles at +4˚C.
2.4.2. Extraction and Analysis of PAHs
The SBSE (Stir Bar Sorptive Extraction) consists in the concentration of apolar dissolved compounds by the apolar phase (PolyMethylPolySiloxane) deposited on a stir bar. The extraction is ensured by a stirring at 700 rpm for 2 hours. The quantification is achieved by introducing internal standards at the beginning of the sample preparation procedure. These standards (5 perdeuterated PAHs) are introduced in a methanolic solution in order to get a complete solubilization, and this final 10% content in methanol also prevent compounds from being sorbed on the glass walls. As 100 mL water samples were analyzed, they were added with 10 mL of methanol containing 10 ng of each perdeuterated PAH (final concentration of 100 ng/L). After the extraction, bars were recovered, rinsed with distilled water, dried over paper and placed on the automatic sampler in order to thermally desorb the compounds which are then introduced in the GC/MS equipment.
Stir Bars covered with PDMS (20 mm long and 0.5 mm film thickness) were purchased from the Gerstel Company (Switzerland).
The analysis was performed by Gas Chromatography coupled to Mass Spectrometry (GC/MS). The GC was an HP 7890N (Hewlett-Packard, Palo Alto, CA, USA) equipped with a Twister Desorption Unit combined with a Cooled Injection System (TDU and CIS-4, Gerstel, Switzerland). The thermal desorption was performed in splitless mode (TDU temperature program: from 50˚C to 280˚C (8 minutes) at 60˚C/min) and the cryofocussing was performed at −10˚C by using liquid nitrogen. The interface temperature between the TDU and the CIS-4 units was maintained at 290˚C. The injection was performed in splitless mode (CIS temperature program: from −10˚C to 300˚C (10 min) at 12˚C/s). The GC temperature program was: from 50˚C (1 min) to 150˚C at 10˚C/ min and 320˚C (5 min) at 5˚C/min. The carrier gas was helium at a constant flow of 1 mL/min. The capillary column used was a HP-5 ms (HP, Palo Alto, USA): 30 m × 0.25 mm ID × 0.25 µm film thickness. The GC was coupled to an HP 5975 Mass Selective Detector (MSD) (Electronic Impact: 70 eV, voltage: 2000 V). The interface temperature was 300˚C. PAHs quantifications were done using Single Ion Monitoring mode with the molecular ion of each compound at a minimum of 2 cycles/s.
The quantification of dissolved PAHs was focused on parents and alkylated molecules. As regards the parents’ ones, the 16 PAHs of the US EPA list were completed with biphenyl, benzo[e]pyrene and perylene, and also two sulphur aromatics (benzothiophene and dibenzothiophene). For most of PAHs, from naphthalene to chrysene, alkylated derivatives characterized by up to 3 additional carbons atoms, were also quantified relatively to the parent PAH. PAHs were quantified relatively to the perdeuterated PAHs introduced at the beginning of the sample preparation procedure by using calibration curves.
3. Results and Discussion
In total, 41 compounds or groups of compounds were quantified to describe the composition of the fresh oils and water soluble fractions (Table 3). The results are presented based on the sum of the 41 PAHs as a global indicator, with naphthalene representing the light and most water soluble PAHs (2 rings), phenanthrenes representing the medium weight compounds (3 rings), chrysenes representing the high molecular weight compounds (5 rings) and dibenzothiophenes illustrating the sulfur pollution.
3.1. Fresh Oil Characterization
A wide range of oils was studied (Table 1) with densities ranging from 0.753 for SP98 and SP95-E10 up to 0.907 for heavy fuel (IFO 380).
Gas chromatograms of the fresh diesel oil and corresponding water soluble fractions after 24 hours contact time are shown in Figure 1. PAH levels in the initial oils are presented Figure 3. Oil characterization showed that domestic fuel had the highest PAH content, and bitumen had the lowest.
Table 3. PAHs and derivatives studied.
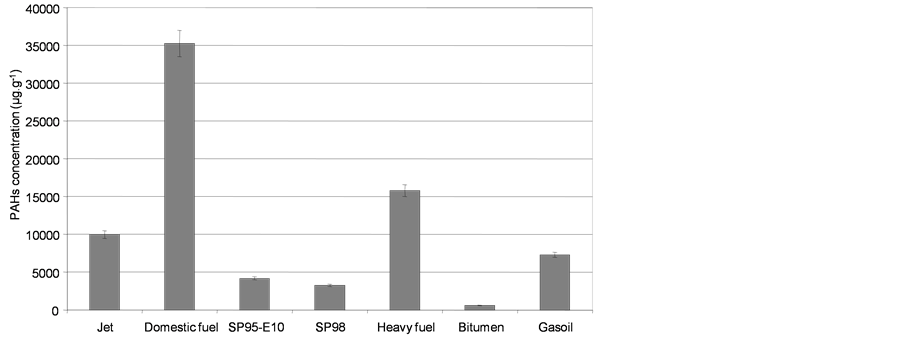
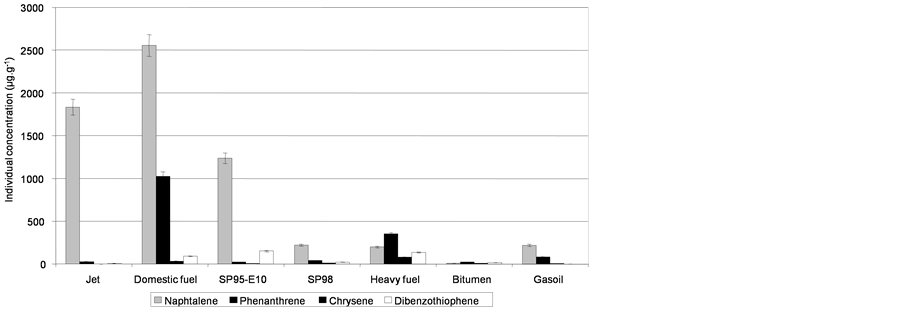
Figure 3. Initial concentrations of the 41 PAHs in oils and individual concentrations of light PAHs (naphthalene), medium PAHs (phenanthrene), heavy PAHs (chrysene) and sulfured PAHs (dibenzothiophene). Expressed in µg PAHs per g of fresh oil.
Distillation curves are presented in Figure 4. The maximal evaporation rate of the products spilled onto the water surface corresponds approximately to molecules that distil up to 250˚C. Percentages of maximum evaporation were, in weight, 86%, 84%, 79%, 36%, 32%, 3% and 2%, respectively, for SP95-E10, SP98, jet, diesel fuel, domestic fuel, heavy fuel, and bitumen.
3.2. Characterization of Water Soluble Fraction (Laboratory Scale)
Figures 5-10 present the concentrations of water soluble fractions and their chemical composition according to contact time for all the tested products.
3.2.1. Oil Behavior and Maximum Solubility
The chemical patterns of the water soluble fractions, as shown by the GC chromatograms (Figure 1), were different from the parent oils ones due to the selective solubility of the various oil components. This also enabled to check that quantified compounds were dissolved and not dispersed nor in a miscellaneous shape. As expected, the concentration of dissolved fractions in the water increases with the PAHs contents of the oils.
3.2.2. Temporal Repartition of PAHs (Contact Time Effect)
As shown in Figures 5-10, the amount of dissolved compounds varies over time in a similar way: an increase and then a decrease of PAH levels in water as function of the time was observed. These two steps can be interpreted as the result of three processes: a partial solubilization of PAHs in water, the volatilization of PAHs from the dissolved fraction and the vaporization of PAHs from the surface deposit. In fact, in the first step, we observed a decrease in the deposited oil both due to its progressive dissolution in water and its partial vaporization.
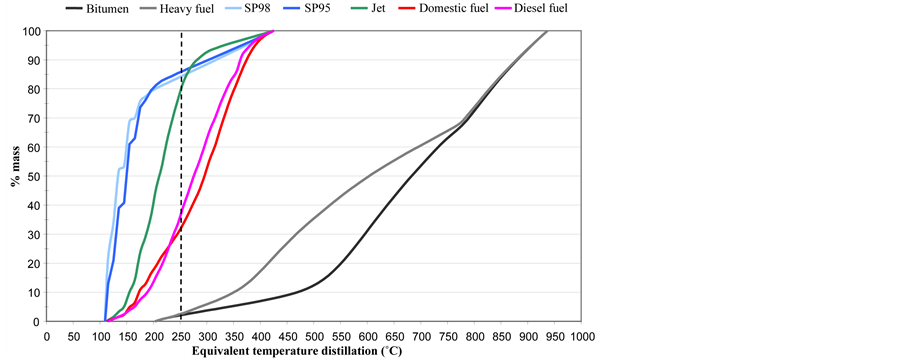
Figure 4. Distillation curves of oils.
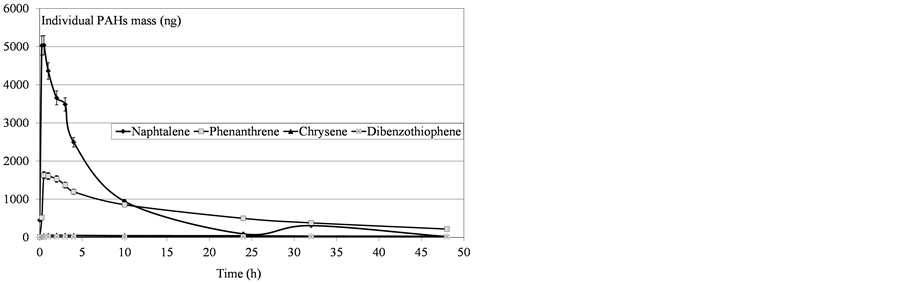
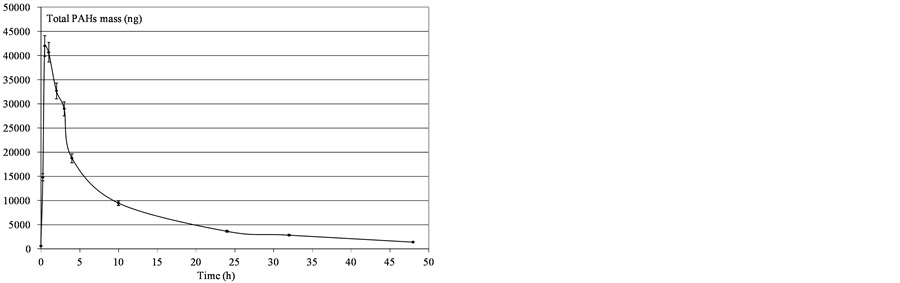
Figure 5. Determination of mass PAHs dissolved in water after SP98 deposition.
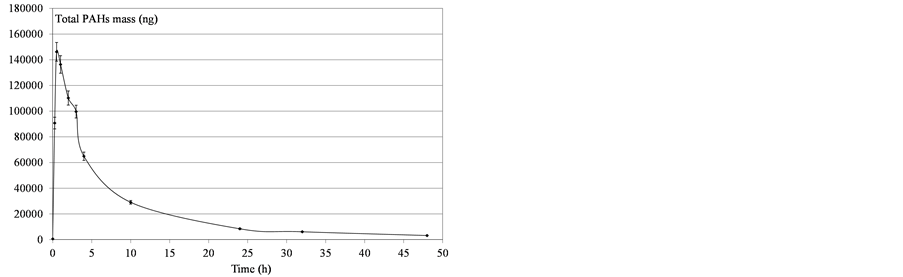

Figure 6. Determination of mass PAHs dissolved in water after SP95-E10 deposition.
This increasing dissolution led to a maximum concentration in water. In the second step, the volatilization of the dissolved fraction occurred and became paramount, resulting in a decrease of the PAH fraction in water.
Variability was observed in the molecules’ behavior: all the compounds did not converge asymptotically towards a maximum limit. Naphthalenes (especially naphthalene and the C1-naphtalenes) were more present in the soluble fraction, as expected according to their lower log Kow values. Indeed, naphthalenes were the dominating component of the PAH profile because of their high solubility in water but were also more affected by the subsequent volatilization process. On the contrary, heavier molecules such as phenanthrenes/anthracenes were characterized by slower kinetics of solubilization but the volatilization process seemed to be less important. The resulting concentrations proved, in some cases, to regularly increase over time. Considering these various behaviours,

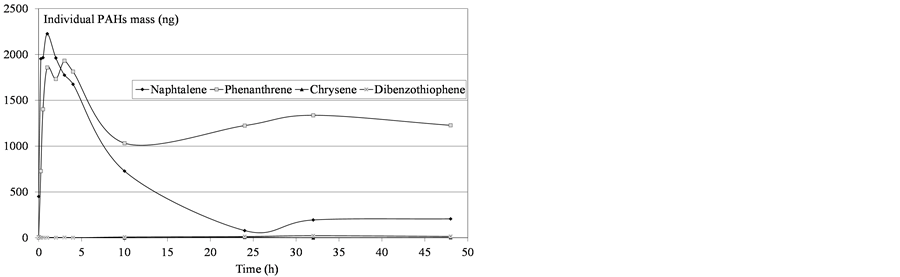
Figure 7. Determination of mass PAHs dissolved in water after diesel fuel deposition.

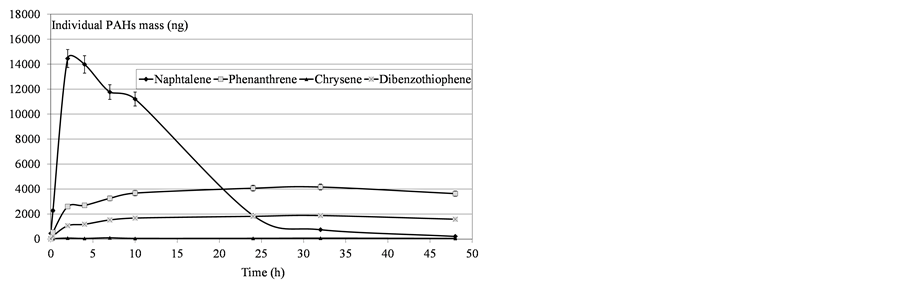
Figure 8. Determination of mass PAHs dissolved in water after heavy fuel deposition.

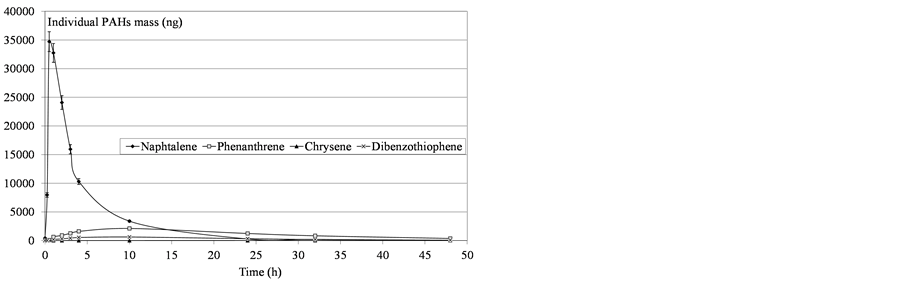
Figure 9. Determination of mass PAHs dissolved in water after jet deposition.


Figure 10. Determination of mass PAHs dissolved in water after domestic fuel deposition.
the initial physical-chemical properties of the tested oils should lead to significant differences between products. As illustrated by Figure 11, the contact time corresponding to the maximum of solubilization is related to the nature of the products. It seems that it is directly linked to the relative proportions of light molecules. This proportion can be assessed through two parameters: the oil density and the distillation cut corresponding to compounds liable to evaporate in real conditions (vapor temperature below 250˚C). As shown in Figure 12, there is a relationship between the time required to get the maximum of solubilization and the relative distribution between light and heavy compounds.
Thus, the optimal contact time between water and oil for a maximum PAH dissolution was selected at 1 hour for all oils, except for heavy fuels where 2 h was preferred, based on the behaviour of individual PAHs. These values have been used to perform a Taguchi experimental design where the influence of parameters (temperature, oil/water ratio, salinity, suspended solid) was investigated towards soluble fraction [11] .
3.2.3. Comparison between SP 98 and SP 95-E10
The effects of organic solvents on the solubility and sorption of hydrophobic organic compounds (HOCs) were mainly studied using contaminated soils and showed an increased elution of PAHs in the presence of alcohol in water [12] . In the case of subsurface spills, the solubility of PAHs was already correlated to the co-solvency power [13] . In the present work, tests were performed with SP98 and SP95-E10 to determine the influence of an oxygenated compound on the dissolution process. Percentages of dissolution at different mixture time, corresponding to the weight ratio between PAH in water and the same PAH in deposition, are presented in Table4 We observed that the addition of a water miscible oxygenated compound increases the global oil solubility as indicated by the sum of PAHs. However, we note that the transfer was different according to the type of PAHs: ethanol improved the solubility of the most hydrophobic compounds (with the highest Kow) such as phenanthrene, whereas the transfer of the less hydrophobic compounds (naphthalene) was reduced in the presence of ethanol (SP95-E10). This behaviour, due to the co-solvency effect of ethanol, is then selective towards hydrocarbons, leading to a soluble fraction enriched in hydrophobic PAHs.
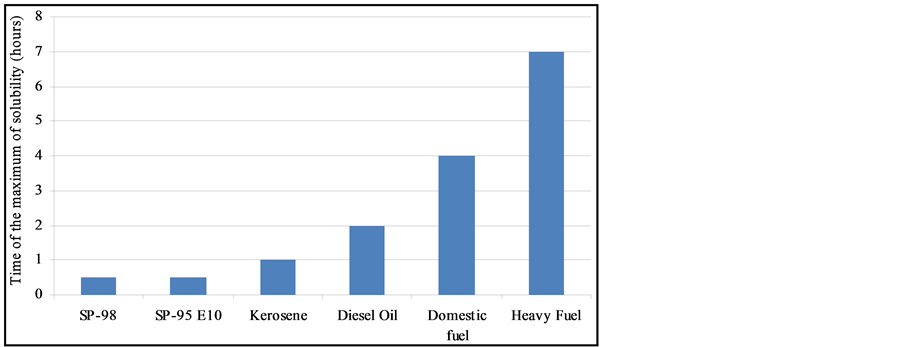
Figure 11. Maximum of solubility of oils ranked according to their increasing naphthalene content.
Table 4. Weigh percentages of PAHs transferred in water.
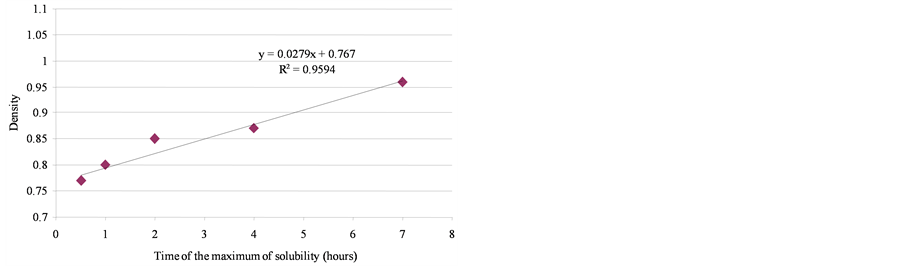
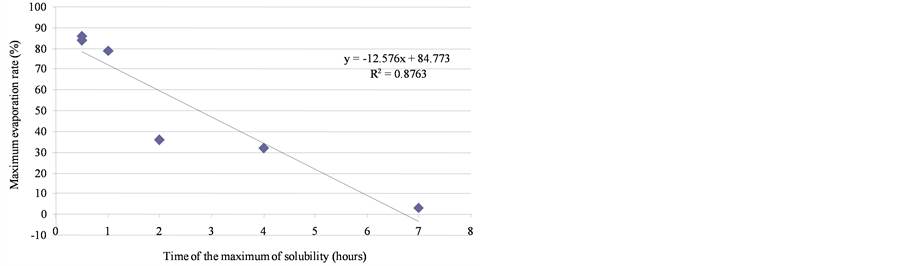
Figure 12. Relationship between the time of the maximum solubilization and the relative distribution between light and heavy compounds.
3.3. Pilot Scale Results
Tests performed at the pilot scale were characterized by dynamic conditions in Polludrome: the water was continuously circulated and a wind current was created, thus accelerating the evaporation processes. The behavior of a diesel fuel slick was thus investigated.
3.3.1. Influence of the Oil/Water Ratio (OWR)
Figure 13 illustrates the kinetics obtained for 3 different OWRs, corresponding respectively to 10, 50 and 200 mL poured onto the water surface (polludrome area of 8.4 m2 with a volume of 7.5 m3). It appears that the time required to reach the maximum is directly linked to the amount of oil, which can be explained by the competition between the various processes. The maximum ratio corresponds to a continuous slick of approximately 24 µm thickness, which limits the volatilization process, in spite of the wind current (the maximum theoretical evaporation is close to 36%). The PAHs concentrations therefore regularly increase over time. As regards the two lower ratios, volatilization is less affected by the oil film (thicknesses of respectively 6 µm and 1 µm) and the solubilization peak observed earlier and at lower levels.
3.3.2. Comparison with Laboratory Results: Scale Effect
Similar kinetic patterns were observed in both conditions (laboratory and Polludrome). However, later solubilization peaks occurs in Polludrome compared to the laboratory scale (Figure 14). This difference can be explained by an increased evaporation at Polludrome scale (under wind current), which concentrates heavy molecules in the slick. These molecules have indeed lower solubilization kinetics (cf. 3.2.2).
Moreover, the maximum values are not directly related to the solubilizing capacity of the medium, resulting in ratio (OWR). In spite of a volume WOR 100 times higher for the laboratory tests, there are only twice as many dissolved PAHs. It means that the values are close of the maximum of solubilization of PAHs: the medium is saturated with PAHs.
4. Conclusions
The observed kinetics must be interpreted as the result of competition between evaporation, solubilization and volatilization. The kinetics curves showed a maximum dissolution of the PAHs followed by a decrease of the dissolved fraction. This behavior can be explained by the dissolution being combined with the evaporation of PAHs from the slick. Subsequently, partial volatilization of the dissolved PAHs occurs and affects the main part of this fraction. The kinetics and the maximum of solubility were proven to depend on the nature of the products, particularly the relative distribution of the PAHs. The most soluble products, characterized by a lower octanolwater partition coefficient, are also the most volatile ones. But, we observed that the heaviest molecules like phenanthrene which gradually enrich the soluble fraction, generate solubility peaks offset in time.
These experiments were also useful to determine the optimal contact time between water and oil to reach the maximum PAH dissolution.
At a pilot scale (Polludrome), the surface WOR acted on the solubilization kinetics, according to the thickness of oil layer, being able to slower the volatilization process.

Figure 13. Determination of PAHs concentration of a diesel fuel for different ratios on polludrome.
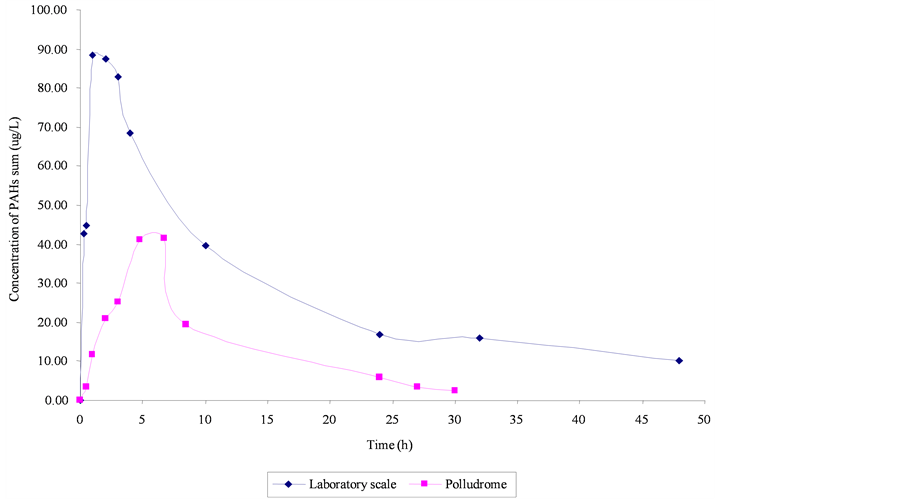
Figure 14. Comparison of PAHs solubilization of diesel fuel between laboratory scale and polludrome (50 mL into Polludrome and 150 mg into beaker).
The comparison between results obtained at laboratory and pilot scale clearly showed the effect of dynamic conditions (water and wind current) which amplifies evaporation process of the volatile molecules, and then delays the time of the maximum solubilization. We noticed that the OWR is not necessary representative for the solubilizing capacity of the aqueous medium, given the limits of solubility.
Moreover, the addition of water miscible oxygenated compounds, such as ethanol, to fuels, increased the global solubility of PAHs. In fact, the addition of 10% ethanol to gasoline enhances the solubility of the most hydrophobic compounds (with the highest Kow) such as phenanthrene. For oxygenated gasoline, the distribution of the dissolved PAHs was then different from conventional gasoline SP98.
Finally, this work supplied a database used in the development of a modeling software, which was the ultimate objective of this project.
Acknowledgements
We would like to thank Daphne Pestourie for her technical help. This work was supported by the French Government in the framework of the Research National Agency “ANR PRECODD” program, contract n˚ ANR- 08-ECOT-008-005.
References
- RNDE (Reseau National des Donnees sur l’Eau), 2002. http://www.sandre.eaufrance.fr/.
- Neff, J.M., Ostazeski, S., Gardiner, W. and Stejskal, I. (2000) Effects of Weathering on the Toxicity of Three Australian Crude Oils and a Diesel Fuel to Marine Animals. Environmental Toxicology and Chemistry, 19, 1809-1821. http://dx.doi.org/10.1002/etc.5620190715
- EU (2000) Directive 2000/60/EC of 23 October 2000 Establishing a Framework for Community Action in the Field of Water Policy. Official Journal of the European Communities, L327, 22 December 2000, 1-37.
- EU (2001) Decision No. 2455/2001/EC of the European Parliament and of the Council Establishing the List of Priority Substances in the Field of Water Policy and Amending Directive 2000/60/EC. Official Journal of the European Communities, L331, 15 December 2001, 1-5.
- Gabet, S. (2004) Mobilisation of Polycyclic Aromatic Hydrocarbons (PAHs) in contaminated soils with biological surfactants. PhD Thesis, University of Limoges, Limoges. (in French)
- Mackay, D., Shiu, W.Y. and Mal, K.C. (1992) Illustrated Handbook of Physical-Chemical Properties and Environmental Fate for Organic Chemicals. Vol. 2. Polynuclear Aromatic Hydrocarbons, Polychlorinated Dioxins, and Dibenzofurans. Lewis Publishers, Boca Raton.
- Diaz-Moroles, N.E., Garza-Ulloa, H.J., Castro-Rios, R., Ramirez-Villarreal, E.G., Barbarin-Castillo, J.M., Salazar-Cavazos, M.-L. and Waksman-de Torres, N. (2007) A Comparison of the Performance of Two Chromatographic and Three Extraction Techniques for the Analysis of PAHs in Sources of Drinking Water. Journal of Chromatographic Science, 45, 57-62. http://dx.doi.org/10.1093/chromsci/45.2.57
- Ma, J., Xiao, R., Li, J., Yu, J., Zhang, Y. and Chen, L. (2010) Determination of 16 Polycyclic Aromatic Hydrocarbons in Environmental Water Samples by Solid-Phase Extraction Using Multi-Walled Carbon Nanotubes as Adsorbent Coupled with Gas Chromatography-Mass Spectrometry. Journal of Chromatography A, 1217, 5462-5469. http://dx.doi.org/10.1016/j.chroma.2010.06.060
- Rianawati, E. and Balasubramanian, R. (2009) Optimization and Validation of Solid Phase Micro-Extraction (SPME) Method for Analysis of Polycyclic Aromatic Hydrocarbons in Rainwater and Stormwater. Physics and Chemistry of the Earth, 34, 857-865. http://dx.doi.org/10.1016/j.pce.2009.07.003
- Garcia-Falcon, M.S., Cancho-Grande, B. and Simal-Gándara, J. (2004) Stirring Bar Sorptive Extraction in the Determination of PAHs in Drinking Waters. Water Research, 38, 1679-1684. http://dx.doi.org/10.1016/j.watres.2003.12.034
- Pimsee, P., Sablayrolles, C., De Caro, P., Guyomarch, J., Lesage, N. and Montrejaud-Vignoles, M. (2014) Effect of Environmental Parameters on the Water Solubility of the Polycyclic Aromatic Hydrocarbons and Derivatives Using Taguchi Experimental Design Methodology. World Academy of Science, Engineering and Technology, 86, 541-544.
- Chen, C.S., Suresh, P., Raob, C. and Delfino, J.J. (2005) Oxygenated Fuel Induced Cosolvent Effects on the Dissolution of Polynuclear Aromatic Hydrocarbons from Contaminated Soil. Chemosphere, 60, 1572-1582.
- Corseuil, H.X., Kaipper, B.I.A. and Fernandez, M. (2004) Cosolvency Effect in Subsurface Systems Contaminated with Petroleum Hydrocarbons and Ethanol. Water Research, 38, 1449-1456. http://dx.doi.org/10.1016/j.watres.2003.12.015