Journal of Environmental Protection
Vol.5 No.4(2014), Article ID:43853,15 pages DOI:10.4236/jep.2014.54028
Long-Term Drainage and Nitrate Leaching below Well-Drained Continuous Corn Agroecosystems and a Prairie
Kevin C. Masarik1, John M. Norman2, Kristofor R. Brye3
1College of Natural Resources, University of Wisconsin-Stevens Point, Stevens Point, USA
2Department of Soil Science, University of Wisconsin, Madison, USA
3Department of Crop, Soil, and Environmental Sciences, University of Arkansas, Fayetteville, USA
Email: kmasarik@uwsp.edu
Copyright © 2014 by authors and Scientific Research Publishing Inc.
This work is licensed under the Creative Commons Attribution International License (CC BY).
http://creativecommons.org/licenses/by/4.0/


Received 31 December 2013; revised 28 January 2014; accepted 23 February 2014
ABSTRACT
Many studies have evaluated nitrate-N leaching from tile-drained agricultural soils, but little longterm research has been performed on well-drained soils commonly throughout the Midwest. Equilibrium tension lysimeters installed at a depth of 1.4 m were used to measure year-round (12 months) nitrate-N leaching below chisel-plow (CP) and no-tillage (NT) continuous corn (Zea mays L.) agroecosystems to determine the potential effects of common agricultural practices on subsurface water quality. The corn systems were fertilized at a rate of 10 kg N ha−1 of starter fertilizer and 180 kg N ha−1 as NH4NO3. For comparison, nitrate-N leaching from a natural ecosystem was performed on a nearby prairie restoration (PR). Drainage, nitrate-N leaching loss, and flow-weighted mean nitrate-N concentrations for 8 years of data (1996-2003) are reported for the CP, NT and PR ecosystems. Results show that 52%, 37%, 16% of cumulative precipitation was collected as drainage, while 18%, 19%, 0.5% of the total N input was leached as nitrate-N in the CP, NT, and PR, respectively. Nearly three-quarters of the total nitrate-N was leached from each ecosystem during the period from 1 April to 30 June. The 8-yr, flow-weighted mean nitrate-N concentration measured in leachate was 9.5, 12.2 and wang#Bracket##0.1 mg L−1 for the CP, NT and PR treatments. Annual drainage volumes and nitrate-N leaching losses were highly variable, stressing the importance of long-term studies capable of measuring year-round drainage for understanding N leaching dynamics and evaluating effects of cropping practices on potential groundwater quality.
Keywords:Nitrate Leaching; Flow-Weighted Mean Concentration; Maize Agroecosystems; Prairie Ecosystem

1. Introduction
Approximately one half of the United States’ drinking water comes from groundwater [1] ; while in upper Midwestern states such as Wisconsin approximately 70% of residents rely on groundwater as their primary water supply [2] . The US Environmental Protection Agency has a primary drinking water standard for nitrate-N of 10 mg∙L−1. Excessive nitrate concentrations have been linked to methemoglobinemia, a potentially fatal condition in infants [3] . A survey of Wisconsin wells showed that 21% of wells in predominantly agricultural districts exceeded the groundwater enforcement standard [4] . Municipal water supplies that exceed federal safe drinking water standards for nitrate-N have cost communities in Wisconsin millions of dollars when municipalities have had to install nitrate removal systems or drill deeper wells [5] . Many private well owners and small businesses in rural areas have spent hundreds to thousands of dollars to install water treatment systems or drill deeper wells to reduce nitrate concentrations from agricultural sources [6] .
Commercial nitrogen fertilizer use combined with other agricultural nitrogen inputs (i.e., legumes, crop rotations, and manure applications) to increase productivity over time has resulted in elevated levels of nitrate in water resources throughout many agricultural regions [7] . While many concerns have been raised regarding the use of N additions to increase crop production and the subsequent impact on the environment, nitrate-N leaching also represents an economic loss for producers who apply N fertilizers above economic optimal levels. Studies of nitrogen recovery on maize in the north-central United States showed that the average amount of nitrogen applied that is recovered by the aboveground plant biomass was only 37%, leaving a substantial amount susceptible to immobilization, denitrification, volatilization or leaching [8] . Past studies show that even with the best possible management practices for optimal crop production, the concentration of nitrate-N in drainage water from fertilized agricultural land is often two times or more greater than the nitrate drinking water standard [9] [10] .
Nitrate losses to surface and groundwater resources have implications far from the pollution source. Many rivers and streams in Wisconsin and other portions of the Midwest receive the majority of streamflow from groundwater aquifers [11] . The elevated nitrate concentration in groundwater recharged by agricultural lands has been linked to a steady increase of nitrate loading to surface waters that reflect the historical increase in N-fertilizer use [12] . Increased nitrate loading from groundwater is partially responsible for a doubling of the nitrateN concentration and a tripling of the N flux in the Mississippi River since 1960 [13] . The loading of N and phosphorus from primarily Midwestern states has been linked to the increase of hypoxic zones in the Gulf of Mexico [14] [15] . Because of the lag time between when groundwater recharges and when it is discharged, the N loading from base flow-dominated agricultural watersheds is expected to continue increasing until equilibrium is reached with current nitrogen application rates and cropping systems as newer water replaces older water within the aquifer [16] [17] .
In an attempt to reduce pollution loading, the Total Maximum Daily Load (TMDL) program was established to characterize surface water’s ability to receive pollution and set limits on the total amount of pollutant allowed to be discharged into a river or stream. A total pollutant load for individual streams is established so as not to exceed critical concentrations in stream flow [18] . Although the TMDL program has been able to quantify and begin to set targets for point-source pollution in some watersheds, loading from non-point pollutants, like nitrate-N, is less easily calculated. Even at constant fertilizer application rates, non-point source losses to the environment can be highly variable from year to year [19] [20] . In addition, the time required for drainage to reach streams and rivers [12] [16] makes it difficult to evaluate the effectiveness of recommended practices to reduce non-point source losses to surface waters. In 2011, the US Environmental Protection Agency reaffirmed its commitment to reducing nitrogen pollution in the Mississippi River Basin [21] . As states develop and implement nutrient reduction strategies, there is a need for quality nitrate leaching data that represents a wide spectrum of landscape practices and hydrologic settings.
Subsurface drain (i.e. tile drainage) studies have commonly been used to measure drainage and nitrate-N loss. An advantage of tile-drained fields is that they provide an extensive sampling system that takes into account the spatial variability within the field. Drainage calculated from tile-flow measurements and periodic sampling of nitrate-N concentrations in tile-flow discharge have been used to calculate flow-weighted-mean nitrate-N concentrations (FWMN) and exports to surface waters [19] [20] [22] . However, calculation of the water flux using tile drains can be subject to error because of uncertainty about the source of drainage and the area from which it originated [23] . In addition, shallow root systems and tiles may limit absorption of nitrate by plant roots in studies performed on poorly drained soils and may not accurately reflect nitrate-N concentrations and subsequent losses to groundwater for well-drained sites. This leads to the question: whether FWMN concentrations from tile-drained studies may be overestimating losses below moderate to well-drained soils where export of nitrate to groundwater is the major concern.
Measurement of drainage in unsaturated soils is difficult, but quantifying drainage and nitrate leaching beneath well-drained soils in Wisconsin and other Upper Great Lake states is critical because the groundwater contribution to streams and rivers is high [11] and fewer acres are tile drained compared to other Midwestern states [24] . Alternatively, the water budget method has been used to indirectly estimate nitrate leaching [10] . In this method, annual drainage estimated from the water budget and annual mean nitrate-N concentrations measured from porous cup samplers or groundwater wells have been used to compute nitrate-N loads; however, because the concentration is not flow-weighted, this method is also susceptible to error in years when annual losses are dominated by a few large leaching events. In addition, porous cup samplers, which require a tension greater than surrounding soil be applied to induce collection of soil water, may not accurately represent water that ultimately drains to groundwater. Consequently, lysimeter technology has been employed to measure drainage and solute fluxes below the root zone. Equilibrium tension lysimeters (ETLs) developed by Brye et al. [25] have been used successfully in agricultural and non-agricultural ecosystems to measure year-round drainage in an undisturbed and well-drained soil profile, and maintain the natural flow paths of water by adjusting lysimeter suction to match the matric potential of the surrounding bulk soil.
The objective of this research was to quantify and investigate differences in long-term drainage and nitrate leaching loss from chisel-plowed and no-tillage continuous-corn agricultural treatments and a nearby prairie. Annual and seasonal differences were also investigated. Equilibrium tension lysimeters were used to directly measure year-round drainage and nitrate-N leaching losses over an 8-yr period in a well-drained, agricultural landscape in south-central Wisconsin.
2. Methods and Materials
2.1. Experimental Sites
Two experimental sites were established in 1995, one compared two tillage systems at the University of Wisconsin-Madison Arlington Research Farm near Arlington, WI (43˚17′ N, 89˚22′ E). The other site was a prairie restoration at the Audubon Society’s Goose Pond Sanctuary 2.5 km northeast of the Arlington Farm. Climate for this location is humid-continental with the 1963-2003 average rainfall of 809 mm; temperatures in July average 21.8˚C while temperatures in January average −8.8˚C [26] . Both the Arlington farm sites and prairie restoration are located on Plano silt loam (well-drained fine-silty, mixed, superactive, mesicTypicArgiudoll, USDA Classification) with <3% slopes. The soil profile consists of silty loess with a silty-clay-loam subsoil texture underlain by sandy-loam till. A survey of wells in the surrounding area indicated that 51% of household wells are above the maximum contaminant level for nitrate-N [27] .
In spring 1995, a randomized complete block design was established for fertilized continuous-corn treatments under no-tillage (NT) and chisel plow (CP) (Figure 1). Four plots were created for each treatment with each plot measuring 6.1 m by 12.2 m (Figure 1). Four unfertilized reference plots were also established. Each year (i.e., 1995 through 2003) a 105-day relative maturity hybrid maize variety was planted in both tillage treatments at a rate of 80,308 seeds ha−1 and all plots received 10 kg N ha−1 as a starter fertilizer at planting. Fertilized plots received a broadcast application of 180 kg N ha−1 as ammonium nitrate (NH4NO3) immediately following planting. Herbicide was applied early after emergence in all plots to control weed growth. In the CP treatments, tillage (i.e., chisel plowing) was conducted each year following grain harvest and disked in the spring prior to planting. From 1996 to 2002, grain yields were measured and sub-samples of grain were collected, dried, and ground for total N analysis to determine the amount of grain N removal. Grain measurements were made on both fertilized and unfertilized reference plots for the purposes of determining N fertilizer removal efficiency (NFRE) using the N difference method [8] .
The prairie restoration (PR) site was established on a former agricultural ecosystem in June 1976 [28] . The vegetation is classified as mesic tall grass prairie and was periodically burned. Controlled burns were performed at the prairie site during this study on 18 Apr 1998 and 18 Apr 2001. Atmospheric N deposition (i.e. NO3-N and NH4-N) was determined from rainfall and snowfall samples collected at the prairie and agricultural sites [29] .
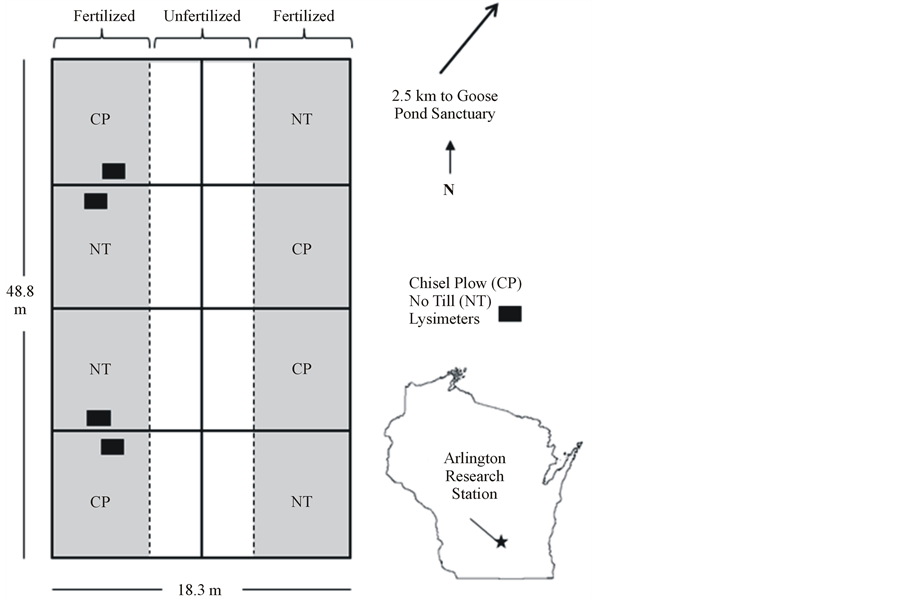
Figure 1. Schematic of agroecosystem plots and location of equilibrium tension lysimeters at the Arlington Research Farm located in Wisconsin, USA. Prairie site located 2.5 km northeast at the Goose Pond Sanctuary.
Soil matric potentials 1.4 m below the soil surface and soil temperatures at depths of 10, 30, 70, and 120 cm were recorded in each tillage treatment and prairie restoration. A weather station located <150 m from the tillage treatments provided air temperature, relative humidity, wind speed, solar radiation, and precipitation data for both study sites.
2.2. Equilibrium Tension Lysimeters
Replicate stainless steel ETLs (0.25 × 0.76 m) were installed in each treatment (n = 2) during summer and fall 1995 [25] [30] . A total of six ETLs were installed 1.4 m below the soil surface in the no-tillage, chisel plow, and prairie ecosystems. Heat-dissipation sensors [31] , installed in the bulk soil directly next to ETLs, measured soil matric potentials. From 1995 to July 2001, a regulated vacuum system was used to apply suction to individual ETLs and the amount of suction was manually adjusted several times a week to match the matric potential of the surrounding soil. In July 2001, automated vacuum systems were installed, which continuously adjusted ETL suction to match that of the surrounding soil [32] .
The ETLs were sampled approximately once every two weeks between March and December and approximately once every four weeks the rest of the year. A polypropylene tube was inserted into a stainless steel sampling tube that extended above the soil surface and connected to the collection reservoir of the ETL. Leachate was removed from the lysimeter using a vacuum pump and collected in high-density polypropylene bottles. The first 1 L of leachate was collected and taken to the laboratory where the volume was measured, filtered through glass fiber filter paper (Whatman G6), and stored at 4˚C for chemical analysis. The volume of the remaining leachate in excess of 1 L was measured and discarded.
2.3. Flow-Weighted Mean Determination
Leachate samples were analyzed for NO3-N and NO2-N using a continuous-flow auto analyzer [33] . Nitrate was reduced to nitrite by passing through a copper-cadmium column and then diazotized with sulfanilamide followed by coupling with N-(1-naphthyl) ethylenediaminedihydrochloride. The resulting color development was detected at a wavelength of 520 nm. The NO3-N concentration was multiplied by the total volume of leachate collected and divided by the lysimeter collection area to determine the mass loss NO3-N per unit area (hereafter referred to as N leaching loss) for each sampling period. The cumulative N leaching loss divided by the cumulative drainage volume per unit area for a given averaging period provides an estimate of the FWMN concentration on an annual, quarterly, and cumulative basis. For purposes of this paper, seasons are defined as: Winter (Jan. 1-Mar. 31), Spring (Apr. 1-June 30), Summer (July 1-Sept. 30), Fall (Oct. 1-Dec. 31).
2.4. Statistical Analysis
Data were subjected to analysis using the statistical package Minitab 15.1. Values reported and graphed are treatment means, standard errors are also reported in some cases. Significant differences between treatment means were determined for drainage, nitrate leaching and flow-weighted mean concentration using an unpaired t-test; least significance difference was also calculated at the 95% confidence level. A Pearson correlation coefficient was calculated to determine whether there was a significant linear relationship between annual precipitation and drainage.
3. Results and Discussion
3.1. Precipitation and Drainage
Annual precipitation for the 8-yr period was variable, but the mean was close to the long-term average for the study location (Figure 2). The study period included two years of precipitation >110% of the long-term aver-age, three years of precipitation <90% of the long-term average, and two years of near-average years +/−10% of the long-term average. Overall, variability of annual drainage was significantly correlated with annual precipitation in the CP (r = 0.81), NT (r = 0.86), and PR (r = 0.78) treatments at the 95% confidence level. For the years 1998 and 2000, when the greatest amount of precipitation was received, the greatest amount of drainage was also recorded in the CP and NT agroecosystems. However, in the PR system, 1998 was the year of largest drainage, 2001 was the second largest drainage, while 2000 was the third largest drainage (Table 1). This difference between the two corn treatments versus the prairie may reflect the influence of the controlled burns conducted in the spring of 1998 and 2001 which coincided with the two greatest drainage years of the PR treatment. Elimination of vegetation and accumulated thatch exposing the soil surface following the controlled burn certainly resulted in less interception and likely contributed to greater infiltration.
Little to no drainage occurred when the soil matric potential was less than field capacity (i.e., < 30 kPa) (Figure 3). In most years, soil matric potential measurements showed the soil profile drying out as the growing season progressed. The decreasing matric potentials illustrate time periods when water demand of the vegetation in excess of actual precipitation was met by removing water stored within the soil matrix. Water drainage below
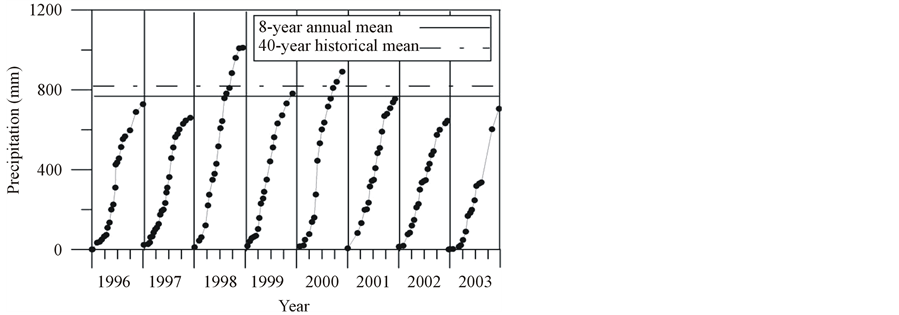
Figure 2. Annual precipitation for period from 1996 through 2003 with 8-yr study mean and previous 40-year historical mean for the Arlington Research Station.

Table 1. Eight-year summary of precipitation, drainage, and nitrate leaching data for no-tillage (NT) and chisel-plow (CP) corn agroecosystems and a nearby prairie restoration (PR).
‡Values within each column followed by the same letter are not significantly different based on Fisher’s least significant difference (LSD) at the 95% confidence level. †Columns without letters represent years in which no significant differences were detected.
the root zone virtually stopped once field capacity was exceeded in each of the eight years that data were collected. Following the growing season, drainage generally did not resume until wetting of the soil profile to field capacity was reached. In five of the eight years, little to no drainage occurred between 1 July and 31 December. In 1998, 2001, and 2003, when fall drainage was measured, soil matric potentials showed a rapid wetting of the soil profile after significant fall rain events, which help validate the drainage measurements (Figure 3).
Contrary to other tile-drain studies of water loss from the soil profile [19] -[20] [34] , although not statistically significant, the CP routinely had greater drainage than the NT agroecosystem (Table 1). This discrepancy may represent a difference between poorly drained soils where tile drains are common, and the well-drained soil studied here. Some tile-drain studies have attributed greater drainage from NT to a better-connected network of macropore flow than in conventionally tilled fields [20] . However, macropores can act as conduits through which water can easily be transported from the soil surface to subsurface tile drains, and have previously been described to act as shallow pathways to surface water [7] [35] . In well-drained soil like that evaluated in this study, macropores may still carry preferential flow deep into the soil profile; however, macropores tend to diminish with soil depth and without tile drains there is no outlet and water may then be redistributed throughout a soil profile by matrix flow. Furthermore, the depth to which plant roots can extract water in well-drained soils usually is considerably deeper than tile-drained soils and upward movement of water from below the root zone may even be important.
From 1996 through 2003, 57% and 69% less drainage was observed in the PR than in NT and CP treatments, respectively (Table 1). Only differences between the PR and CP were statistically significant. Brye et al. [36] cited a greater ability of standing vegetation and residue in prairie ecosystems to intercept precipitation as a

Figure 3. Annual cumulative drainage measured by sampling period using replicate equilibrium tension lysimeters from 1.4 m below the soil surface for prairie restoration (PR), no-tillage (NT), and chisel-plowed (CP) treatments. Solid line represents monthly average soil-water matric potential measurements.
cause of less drainage below the prairie. In addition, the ability of perennial vegetation in the PR to begin water uptake before the corn system has established a substantial root system, and the opportunity to continue water uptake longer into fall may also contribute to lower overall drainage amounts from the PR. These results are similar to those reported in a tile drain study that found drainage from annual row crops was two times greater than from perennial crops [37] . Strock et al. [38] reported that planting a winter rye (Secale cereale L.) cover crop reduced subsurface drainage. While the PR system resulted in less drainage, the soil matric potential measurements indicated that the soil profile of the PR usually did not reach the same level of dryness as the CP and NT corn agroecosystems (Figure 3). The usually greater soil matric potential measurements in PR may reflect a N limitation within the PR ecosystem. Under similar water availability conditions, vegetation in low N input systems has been observed to use less water than a system where N was added [39] .
3.2. Grain Yield, N Removal, and N-Fertilizer Removal Efficiency
Grain yield, N removal and NFRE collected for the agroecosystem treatments were variable during the years when data were collected (Table 2). Yields were substantially greater in 1998, which coincided with the greatest annual precipitation. Low yields occurred in 2002 when annual precipitation was 20% lower than the long-term average. The low yields measured in 2001 may have been influenced by a delayed herbicide application. Grain yield and N removal were not measured in 2003. Average seven-year grain yields were 9.4 and 8.3 Mg ha−1, while N removal was 110 and 97 kg∙ha−1 for the CP and NT systems respectively. Total grain yield and N removal did not differ between CP and NT systems. Grain yield and N removal from unfertilized treatments were used as a measure of N mineralization and were subtracted from grain N removal from fertilized treatments to calculate NFRE. The NFRE followed a similar pattern to the grain yields. Over the 7 years that measurements were collected the CP and NT found an average of 32% and 31% of the N applied as fertilizer was removed through the harvested grain, leaving a sizable pool of N susceptible to leaching. Cassman et al. [8] estimated N fertilizer uptake efficiency (which accounted for all above ground biomass) to be 37% for maize agroecosystems of the Midwestern US [8] .
3.3. Nitrate Concentrations and N Leaching Losses
Leachate nitrate-N concentrations at 1.4 m below the surface in the CP and NT systems ranged from <0.1 to 43 mg L−1 over the period from 1996 through 2003 (Figure 4). Concentrations in both the NT and CP agroecosystems followed a cyclical pattern during the 8 yrs. Beginning in winter through the summer, nitrate-N concentrations increased even before fertilizer application, and reached a maximum near the beginning of summer. Since no fall application of N occurred, much of the spring increase in concentration can be attributed to mineralization of soil organic N or translocation of inorganic N from the upper horizons. Fertilizer application may have contributed to increased concentrations later in the spring following planting in some years, however this study did not distinguish between N loss from spring applied N versus N produced from mineralization organic N or residual inorganic sources in the soil profile.
Following July 1, nitrate-N concentrations decreased substantially. This decrease was likely in response to increased plant uptake during the latter half of the growing season. Concentrations remained low following the growing season. Low nitrate-N concentrations likely persisted until optimal conditions for crop residue and soil organic N to undergo mineralization were met or residual inorganic N pools in the upper portion of the soil profile were transported deeper into the soil profile where drainage was collected.
Nitrate-N leachate concentrations in the PR were significantly less than in the NT and CP treatments through
Table 2. Annual mean (standard error) grain yields and nitrogen removal from fertilized and unfertilized treatments used to calculate N fertilizer removal efficiency. Fertilized chisel plow (CP), fertilized no tillage (NT), chisel plow unfertilized (CPnf) and no tillage unfertilized (NTnf).
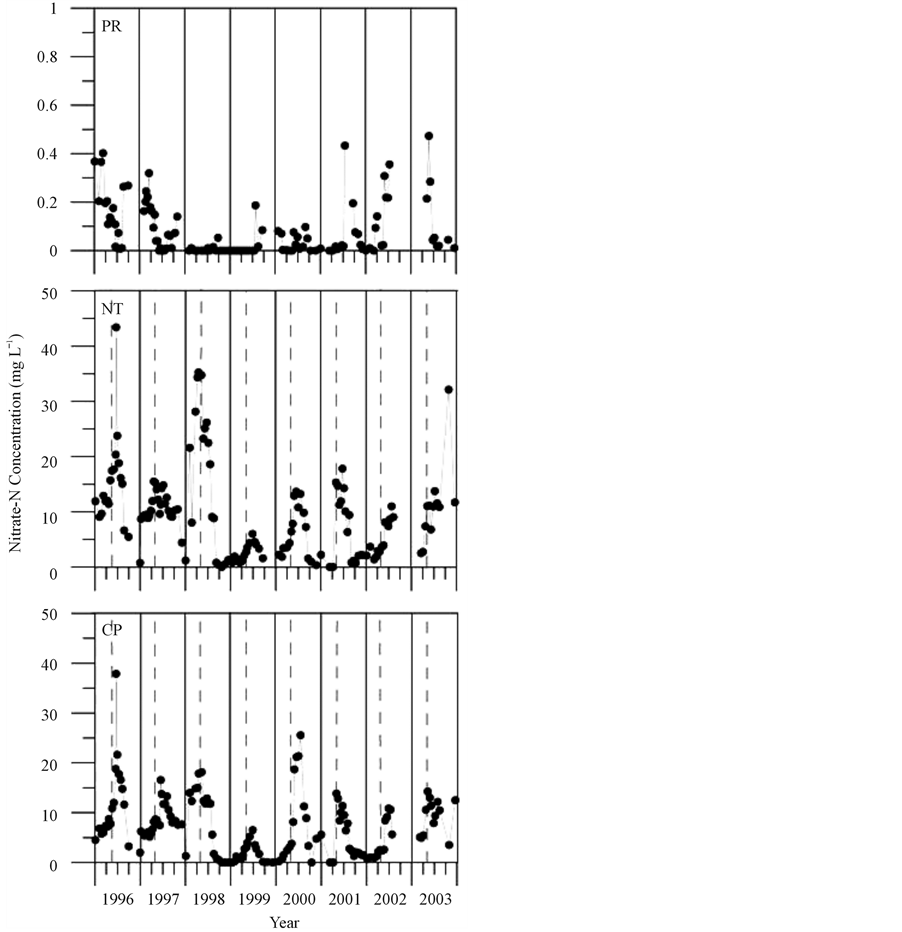
Figure 4. Nitrate concentrations measured for each sampling period from 1996 through 2003 using replicate equilibrium tension lysimeters from 1.4 m below the soil surface for prairie restoration (PR), no-tillage (NT), and chisel-plowed (CP) treatments. Breaks in plot lines indicate periods when lysimeters collected zero drainage. Vertical dashed lines represent dates when fertilizer was applied to NT and CT agroecosystem treatments.
out the study and ranged from <0.1 to 0.4 mg NO3-N L−1 (Figure 5). Nitrate concentrations <1 mg L−1 are typical of what is generally considered to be baseline or natural levels of nitrate in groundwater [40] . Other studies have measured low levels of N loss below Conservation Reserve Program lands and naturally vegetated landscapes [37] [41] [42] . Prairie and other grassland ecosystems have demonstrated a greater N use efficiency and ability to cycle N which limits the amount of nitrate available in the soil to leach [29] [43] .
The N leaching loss for any one individual sampling period in the corn treatments ranged from <0.01 to 32.3 kg N ha−1. Differences in the annual N leaching losses between the CP and NT corn treatments were not statisti-
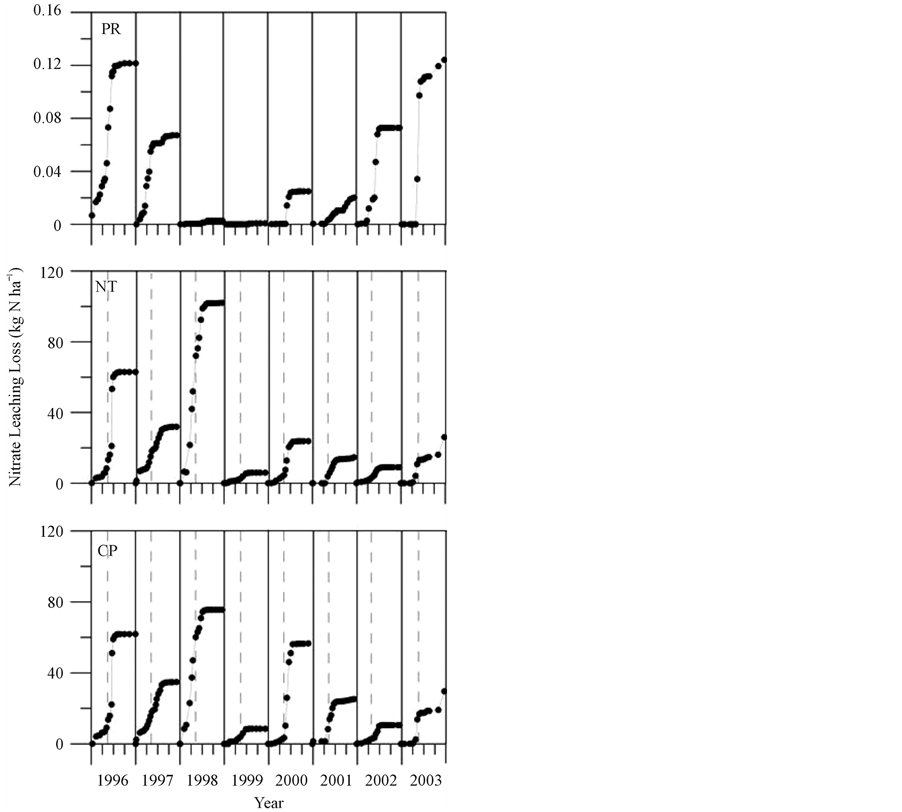
Figure 5. Annual cumulative nitrate leaching loss determined for each sampling period using replicate equilibrium tension lysimeters from 1.4 m below the soil surface for prairie restoration (PR), no-tillage (NT), and chisel-plowed (CP) treatments from 1996 through 2003. Vertical dashed lines represent dates when fertilizer was applied to NT and CP agroecosystem treatments.
cally significant (Table 1). Nitrate-N leaching losses during the study period in the two corn agroecosystems were variable from year to year, but intra-annual variability tended to follow similar leaching patterns (Figure 5). The greatest N leaching loss, 76 and 102 kg N ha−1, occurred in 1998 and the least loss, 9 and 6 kg N ha−1, in 1999 for the CP and NT treatments, respectively (Table 1). While drainage amounts during 1999 were near average, the low leaching results were the result of low nitrate concentrations in the leachate and suggest a purging of inorganic soil N from the soil profile during the previous and wettest year of the study period. Large differences in annual N leaching losses have been observed in other studies, which like this study, have also shown significant increases in N leaching when a wet year followed a dry year [19] [34] . Nitrate-N losses from the PR were consistently lower than from both the CP and NT treatments (Table 1).
The large variation in N leaching between years in the corn treatments highlights the importance of datasets that represent long-term climatic variations when considering the recommendation of agricultural practices to control N losses and protect groundwater quality. A study of nitrate leaching performed during a particularly wet period would likely overestimate the average long-term losses. Conversely, a study conducted during a dry period would severely underestimate long-term average N losses.
3.4. Seasonal and Cumulative 8-yr Summary
Drainage and N losses for the 8-yr period were separated into quarters to determine intra-annual variability (Table 3). Although cumulative drainage and nitrate-N leaching losses differed between treatments, similar seasonal patterns emerged for all three land uses. In the CP, NT, and PR, 58%, 60%, and 64% of the drainage occurred during the spring period (i.e. 1 April through 30 June). Drainage occurred even during periods when soil temperatures showed the upper regions of the soil profile were below 0˚C, emphasizing that drainage during periods when the upper portion of the soil horizon is considered frozen can be significant and are important to measure.
Nitrate-N leaching losses during the spring accounted for 73%, 75%, and 69% of the yearly totals for CP, NT, and PR, respectively. As a result, drainage and nitrate leaching during the spring period also had the most impact on the flow-weighted mean nitrate-N concentration of soil leachate. In well-drained landscapes, where there is a strong relationship between drainage from the soil profile and groundwater recharge, these results suggest the vertical transmission of soil leachate solution during this relatively short period has a large influence on overall groundwater quality within a watershed. The winter period resulted in the second greatest amount of water drainage and nitrate leaching loss in all three treatments. In the CP and NT treatments the next greatest amount of drainage occurred in summer followed by fall. The PR treatment had slightly more drainage occur in fall followed by summer. While drainage resumed in fall during 1998, 2001, and 2003 the low nitrate concentrations at this time meant virtually no nitrate loss below 1.4 m occurred during the second half of the year. Since nutrients in this study were only applied in spring, results here do not reflect the losses that would occur with manure, other bio-solid nutrient application or commercial N being applied in the fall. However, the relatively large winter and spring drainage suggests that fall applications could be problematic depending on the form of nitrogen applied.
The increase in nitrate-N concentration prior to spring fertilization suggests that a significant portion of annual leaching loss is likely the result of residual soil N from the previous season’s crop and management practices or organic N mineralization followed by nitrification. While nitrate-N concentrations measured in soil leachate solution during the growing season were high, it did not translate into large leaching losses because drai
Table 3. Seasonal variation of mean (standard error) drainage, leaching loss, and flow-weighted mean nitrate concentration (FWMN) for chisel-plow (CP), no-tillage (NT), and prairie restoration (PR) treatments.
nage in these particular soils virtually stopped around 1 July of each year. Studies conducted in the Upper Midwest that neglect to collect leachate prior to planting and fertilization likely underestimate annual N leaching losses and may confound the interpretation of water quality implications from various practices.
As a fraction of overall precipitation, drainage constituted 54%, 37%, and 16% for the CP, NT, and PR, respectively (Table 4). Relative to the total amount of N input to the fields (i.e., fertilizer N + atmospheric N deposition), the amount of total N lost to leaching was 18% and 19% for the CP and NT. Comparatively, only 0.5% of the estimated total N input to the PR system (i.e., atmospheric N deposition) was leached. Slightly more nitrate-N loss occurred in the CP agroecosystem, however the FWMN concentration was less than the NT system because of dilution from the increased drainage volume. The FWMN concentration, when determined for the whole 8-yr period, was 9.5 mg L−1 in the CP compared with 12.2 mg L−1 in the NT, however the differences between CP and NT were not statistically significant. While some studies on continuous corn tile drain fields have reported FWMN concentrations that were two times or more greater than the current drinking water standard [20] [37] , similar concentrations to those reported in this study were observed in at least one other longterm, continuous corn study also on tile-drained fields [19] . The PR had a FWMN concentration of <0.1 mg L−1 and showed no indication of degraded water quality at any time during the 8-yr period. Compared to the 8-yr loss of 0.43 kg N ha−1 below the PR, nitrate losses below the CP and NT treatments measured 705 and 644 times greater respectively than from the PR.
These results emphasize the importance of long-term studies that quantify both mass loss and water drainage. For land managers and agronomists, the mass loss of nitrogen is a critical measure for comparing which agricultural practices reduce N loss and improve N fertilizer use efficiency. For regulatory agencies however, the long-term FWMN concentration, which requires accurate measure of N loss and drainage, is a useful metric for comparing the potential impact of various land-use practices to groundwater standards. Measurements of mass N loss and drainage from well drained soils may also be useful for investigating land-use interactions and the combined potential impact of subsurface drainage on groundwater quality within a watershed or wellhead protection area.
4. Conclusions
Nearly three-quarters of N leaching loss occurred during the 3-month period from April 1 to June 30; however, measuring year-round drainage is important for relating the amount of N loss below agricultural ecosystems to the potential impact on groundwater quality. The cumulative FWMN concentrations in CP and NT continuous corn were near the MCL for nitrate-N. However the annual FWMN concentration was as much as 2.5 times greater than the MCL during years with above-average precipitation. N leaching losses and FWMN concentrations did differ between agricultural ecosystems and prairie; however differences between tillage treatments were not significant. Leachate below the PR showed no signs of reaching pollutant levels. Establishment of low N input perennial vegetated systems is an effective strategy for reducing subsurface N loss. However, drainage
Table 4. Summary of average annual precipitation, drainage, and nitrate leaching for N-fertilized chisel-plow (CP) and notillage (NT) corn agroecosystems and a nearby restored prairie restoration (PR) over an 8-yr period from 1996 through 2003.
from the PR was lower than that from CP and NT ecosystems, suggesting that on a per-unit-area basis the impact of drainage on regional subsurface water quality is likely greater from agricultural land uses than from perennial vegetated land.
This 8-yr investigation of drainage and N leaching offers an important long-term data set that contributes to the understanding of subsurface nitrate losses from well-drained agricultural soils of the Upper Midwest. Considering that significant levels of nitrate were observed to leach below 1.4 m prior to spring fertilization and planting, researching practices aimed at capturing or reducing inorganic N pools in the soil profile during winter and early spring months are worth investigating for their potential to reduce N losses in the Upper Midwest. Due to carryover of N from year to year, this research highlights the benefits of quantifying year-round drainage and N leaching losses when evaluating effects of N management strategies and cropping rotations on subsurface water quality.
Acknowledgements
We would like to thank the University of Wisconsin’s College of Agriculture and Life Sciences’ Hatch Interdisciplinary Research Program and Non-Point Source Pollution Project, and the Wisconsin Groundwater Research Program in cooperation with the University of Wisconsin Water Resources Institute for providing the resources to conduct this research project. We would also like to thank the Madison Audubon Society and Mark and Sue Martin for their cooperation on the use of Goose Pond Sanctuary. Field and technical assistance provided by Peter Wakeman, Todd Andraski and Dave Kroll. The comments and insight provided by Dr. Larry Bundy were indispensable and greatly appreciated.
References
- US Geological Survey (1998) Strategic Directions for the US Geological Survey Ground-Water Resources Program: Report to Congress.
- Wisconsin Department of Natural Resources (1997) Status of Groundwater Quantity in Wisconsin.
- Knobeloch, L., Salna, B., Hogan, A., Postle, J. and Anderson, H. (2000) Blue Babies and Nitrate-Contaminated Well Water. Environmental Health Perspectives, 108, 675-678. http://dx.doi.org/10.1289/ehp.00108675
- Department of Agriculture, Trade and Consumer Protection (2008) Agricultural Chemicals in Wisconsin Groundwater. http://datcp.wi.gov/uploads/Environment/pdf/ARMPub180.pdf
- Chern, L., Kraft, G. and Postle, J. (1999) Nitrate in Groundwater-A Continuing Issue for Wisconsin Citizens. http://dnr.wi.gov/topic/Groundwater/documents/pubs/NitrateInGroundwater.pdf
- Lewandowski, A.M., Montgomery, B.R., Rosen, C.J. and Moncrief, J.F. (2008) Groundwater Nitrate Contamination Costs: A Survey of Private Well Owners. Journal of Soil and Water Conservation, 63, 153-161. http://dx.doi.org/10.2489/jswc.63.3.153
- Dinnes, D.L., Karlen, D.L., Jaynes, D.B., Kasper, T.C., Hatfield, J.L., Colvin, T.S. and Cambardella, C.A. (2002) Nitrogen Management Strategies to Reduce Nitrate Leaching in Tile-Drained Midwestern Soils. Agronomy Journal, 94, 153-171. http://dx.doi.org/10.2134/agronj2002.0153
- Cassman, K.G., Dobermann, A. and Walters, D. (2002) Agroecosystems, Nitrogen-Use Efficiency, and Nitrogen Management. Ambio, 31, 132-140.
- Jemison, J.M. and Fox, R.H. (1994) Nitrate Leaching from Nitrogen Fertilized and Manured Corn Measured with Zero-Tension Pan Lysimeters. Journal of Environmental Quality, 23, 337-343. http://dx.doi.org/10.2134/jeq1994.00472425002300020018x
- Andraski, T.W., Bundy, L.G. and Brye, K.R. (2000) Crop Management and Corn Nitrogen Rate Effects on Nitrate Leaching. Journal of Environmental Quality, 29, 1095-1103. http://dx.doi.org/10.2134/jeq2000.00472425002900040009x
- US Geological Survey (2003) Base-Flow Index Grid for the Conterminous United States. US Geological Survey Open-File Report 03-263, Reston.
- Browne, B.A. and Guldan, N.M. (2005) Understanding Long-Term Baseflow Water Quality Trends Using a Synoptic Survey of the Ground Water-Surface Water Interface, Central Wisconsin. Journal of Environmental Quality, 34, 825- 835. http://dx.doi.org/10.2134/jeq2004.0134
- Bratkovich, A., Dinnel, S.P. and Goolsby, D.A. (1994) Variability and Prediction of Freshwater and Nitrate Fluxes for the Louisiana-Texas Shelf: Mississippi and Atchafalaya River Source Functions. Estuaries, 17, 766-778. http://dx.doi.org/10.2307/1352746
- Rabalais, N.N., Turner, R.E. and Wiseman Jr., W.J. (2002) Gulf of Mexico Hypoxia, a.k.a. The Dead Zone. Annual Review of Ecology and Systematics, 33, 235-263. http://dx.doi.org/10.1146/annurev.ecolsys.33.010802.150513
- Goolsby, D.A., Battaglin, W.A., Aulenbach, B.T. and Hooper, R.P. (2001) Nitrogen Input to the Gulf of Mexico. Journal of Environmental Quality, 30, 329-336. http://dx.doi.org/10.2134/jeq2001.302329x
- Tesoriero, A.J., Duff, J.H., Saad, D.A., Spahr, N.E. and Wolock, D.M. (2013) Vulnerability of Streams to Legacy Nitrate Sources. Environmental Science & Technology, 47, 3623-3629. http://dx.doi.org/10.1021/es305026x
- Sprague, L.A., Hirsch, R.M. and Aulenbach, B.T. (2011) Nitrate in the Mississippi River and Its Tributaries, 1980 to 2008: Are We Making Progress? Environmental Science &Technology, 45, 7209-7216. http://dx.doi.org/10.1021/es201221s
- Shoemaker, L., Lahlou, M., Bryer, M., Kumar, D. and Kratt, K. (1997) Compendium of Tools for Watershed Assessment and TMDL Development. US EPA Office of Water, Washington DC.
- Randall, G.W. and Iragavarapu, T.K. (1995) Impact of Long-Term Tillage Systems for Continuous Corn on Nitrate Leaching to Tile Drainage. Journal of Environmental Quality, 24, 360-366. http://dx.doi.org/10.2134/jeq1995.00472425002400020020x
- Weed, D.A.J. and Kanwar, R.S. (1996) Nitrate and Water Present in and Flowing from Root-Zone Soil. Journal of Environmental Quality, 25, 709-719. http://dx.doi.org/10.2134/jeq1996.00472425002500040010x
- Stoner, N.K. (2011) Working in Partnership with States to Address Phosphorus and Nitrogen Pollution through Use of a Framework for State Nutrient Reductions. US Environmental Protection Agency, Memorandum.
- Gentry, L.E., David, M.B., Smith-Starks, K.M. and Kovacic, D.A. (2000) Nitrogen Fertilizer and Herbicide Transport from Tile Drained Fields. Journal of Environmental Quality, 29, 232-240. http://dx.doi.org/10.2134/jeq2000.00472425002900010030x
- de Vos, J.A. (2001) Monitoring Nitrate Leaching from Submerged Drains. Journal of Environmental Quality, 30, 1092-1096. http://dx.doi.org/10.2134/jeq2001.3031092x
- Ruark, M.D., Panuska, J.C., Cooley, E.T. and Pagel, J. (2009) Tile Drainage in Wisconsin: Understanding and Locating Tile Drainage Systems. University of Wisconsin Cooperative Extension, Madison.
- Brye, K.R., Norman, J.M., Bundy, L.G. and Gower, S.T. (1999) An Equilibrium Tension Lysimeter for Measuring Drainage through Soil. Soil Science Society of America Journal, 63, 536-543. http://dx.doi.org/10.2136/sssaj1999.03615995006300030016x
- National Climatic Data Center (2013) Climate Data Online: Annual Climatological Summary. http://www.ncdc.noaa.gov/cdo-web/quickdata
- Center for Watershed Science and Education (2013) WI Well Water Viewer. http://www.uwsp.edu/cnr-ap/watershed/Pages/wellwaterviewer.aspx
- Wagai, R., Brye, K.R., Gower, S.T., Norman, J.M. and Bundy, L.G. (1998) Land Use and Environmental Factors Influencing Soil Surface CO2 Flux and Microbial Biomass in Natural and Managed Ecosystems in Southern Wisconsin. Soil Biology & Biochemistry, 30, 1501-1509. http://dx.doi.org/10.1016/S0038-0717(98)00041-8
- Brye, K.R., Norman, J.M., Gower, S.T. and Bundy, L.G. (2003) Methodological Limitations and N-Budget Differences among a Restored Tallgrass Prairie and Maize Agroecosystems. Agriculture, Ecosystems and Environment, 97, 181- 198. http://dx.doi.org/10.1016/S0167-8809(03)00067-7
- Brye, K.R., Norman, J.M., Bundy, L.G. and Gower, S.T. (2001) Nitrogen and Carbon Leaching in Agroecosystems and Their Role in Denitrification Potential. Journal of Environmental Quality, 30, 58-70. http://dx.doi.org/10.2134/jeq2001.30158x
- Reece, C.F. (1996) Evaluation of a Line Heat Dissipation Sensor for Measuring Soil Matric Potential. Soil Science Society of America Journal, 51, 1386-1388. http://dx.doi.org/10.2136/sssaj1996.03615995006000040009x
- Masarik, K.C., Norman, J.M., Brye, K.R. and Baker, J.M. (2004) Improvements to Measuring Water Flux in the Vadose Zone. Journal of Environmental Quality, 33, 1152-1158. http://dx.doi.org/10.2134/jeq2004.1152
- Lachat Instruments. (2000) QuikChem® Method 10-107-04-1-A: Nitrate/Nitrite, Nitrite in Surface Water, Wastewater. Lachat Instruments, Milwaukee.
- Kladivko, E.J., Frankenberger, J.R., Jaynes, D.B., Meek, D.W., Jenkinson, B.J. and Fausey, N.R. (2004) Nitrate Leaching to Subsurface Drains as Affected by Drain Spacing and Changes in Crop Production System. Journal of Environmental Quality, 33, 1803-1813. http://dx.doi.org/10.2134/jeq2004.1803
- Zhao, S.L., Gupta, S.C., Huggins, D.R. and Moncrief, J.F. (2001) Tillage and Nutrient Source Effects on Surface and Subsurface Water Quality at Corn Planting. Journal of Environmental Quality, 30, 998-1008. http://dx.doi.org/10.2134/jeq2001.303998x
- Brye, K.R., Norman, J.M., Bundy, L.G. and Gower, S.T. (2000) Water-Budget Evaluation of Prairie and Maize Ecosystems. Soil Science Society of America Journal, 64, 715-724. http://dx.doi.org/10.2136/sssaj2000.642715x
- Randall, G.W., Huggins, D.R., Russelle, M.P., Fuchs, D.J., Nelson, W.W. and Anderson, J.L. (1997) Nitrate Losses through Subsurface Tile Drainage in Conservation Reserve Program, Alfalfa, and Row Crop Systems. Journal of Environmental Quality, 26, 1240-1247. http://dx.doi.org/10.2134/jeq1997.00472425002600050007x
- Strock, J.S., Porter, P.M. and Russelle, M.P. (2004) Cover Cropping to Reduce Nitrate Loss through Subsurface Drainage in the Northern US Corn Belt. Journal of Environmental Quality, 33, 1010-1016. http://dx.doi.org/10.2134/jeq2004.1010
- Owensby, C.E., Hyde, R.M. and Anderson, K.L. (1970) Effects of Clipping and Supplemental Nitrogen and Water on Loamy Upland Bluestem Range. Journal of Range Management, 23, 341-346. http://dx.doi.org/10.2307/3896163
- Mueller, D.K., Hamilton, P.A., Helsel, D.R., Hitt, K.J. and Ruddy, B.C. (1995) Nutrients in Ground Water and Surface Water of the United States: An Analysis of Data through 1992. USGS Water-Resources Investigations Report: 95-4031.
- Schilling, K.E. (2002) Chemical Transport from Paired Agricultural and Restored Prairie Watersheds. Journal of Environmental Quality, 31, 1184-1193. http://dx.doi.org/10.2134/jeq2002.1184
- Schilling, K.E. and Spooner, J. (2006) Effects of Watershed-Scale Land Use Change on Stream Nitrate Concentrations. Journal of Environmental Quality, 35, 2132-2145. http://dx.doi.org/10.2134/jeq2006.0157
- Vitousek, P. (1982) Nutrient Cycling and Nutrient Use Efficiency. The American Naturalist, 119, 553-571. http://dx.doi.org/10.1086/283931