Journal of Environmental Protection
Vol.4 No.12B(2013), Article ID:40635,7 pages DOI:10.4236/jep.2013.412A2003
Behavior of Arsenic and Fluoride Concentration in Guadiana Valley Aquifer of Durango, Mexico
![]()
1Chemical Engineering Department, Technological Institute of Durango (ITD), Durango, Mexico; 2National Polytechnic Institute Interdisciplinary Research Center for Regional Integral Development at Durango (IPN-CIIDIR-DGO), Durango, Mexico.
Email: *adriana.martinez@orst.edu, maelena0359@gmail.com
Copyright © 2013 María Adriana Martínez-Prado et al. This is an open access article distributed under the Creative Commons Attribution License, which permits unrestricted use, distribution, and reproduction in any medium, provided the original work is properly cited. In accordance of the Creative Commons Attribution License all Copyrights © 2013 are reserved for SCIRP and the owner of the intellectual property María Adriana Martínez-Prado et al. All Copyright © 2013 are guarded by law and by SCIRP as a guardian.
Received September 17th, 2013; revised October 19th, 2013; accepted November 16th, 2013
Keywords: Aquifer; Arsenic; Fluoride; Groundwater Quality; Guadiana Valley
ABSTRACT
Fluorine (F) and arsenic (As) are inorganic elements present in the subsurface depending on the geology of the region. These compounds are found in high concentrations in the underground strata of Guadiana Valley of Durango affecting water quality for human consumption (NOM-127-SSA-1994). In the present research the main objective was to assess the behavior in time and space of fluoride (F−) and arsenic concentration, from 1996 to date, in the groundwater of the city of Durango and some wells of the rural area as a reference. The highest concentration of arsenic was found in a rural well, Colonia Hidalgo (0.149 mg/L or ppm), 6 times the maximum permissible limit (MPL); within the city well 54 located in the western sector had the highest value (0.076 ppm), 3 times the MPL, 67% of the wells in the city and 60% of the Guadiana Valley had levels that exceeded the MPL (0.025 ppm), the concentration in the city ranged from 0.009 to 0.149 ppm and from 0.08 to 0.15 ppm for the rural zone. With respect to F−, the highest value was also found in the Colonia Hidalgo well (17.8 mg/L), 12 times the MPL; within the city the highest value was recorded in well 16 in the eastern sector with 7.6 ppm (5 times the MPL) 97% of the wells in the city and 100% of the wells in the Guadiana Valley rural area had concentrations greater than MPL (1.5 ppm), the concentration in the city ranged from 1.1 to 7.6 ppm, while in the Guadiana Valley from 1.7 to 17.8 ppm. Statistical analysis showed no significant difference for fluoride concentration over time (1996-2013); whereas the concentration of arsenic decreased, probably due to the degree of precision required for such small concentrations in groundwater and different analysts ran the samples.
1. Introduction
One of the most common practices to obtain water for human consumption is to extract it from aquifers in the subsoil. An aquifer is a layer of rock or stratum that can store, transmit and yield water to a well or spring. Water demand in the state of Durango is covered by groundwater sources (33%) and surface water (67%); groundwater is mainly supplied for 11 (out of 30) aquifers, nine of them were categorized as overexploited and four of these have closure decree. The municipality of Durango covers 100% of the water demand with groundwater extracted from the Guadiana Valley aquifer [1].
The Guadiana Valley is a 1572 km2 plain located in the south central part of Durango State (Coordinates: 24˚56'05"N 104˚54'43"W), Figure 1; Durango City and surroundings are supplied with drinking water through the aquifer exploitation of 1097 wells with an estimated extraction volume of 148.31 × 10 6 m3/year, Table 1 [2].
The Guadiana Valley aquifer (code 1003) has a surface area of 4817 km2 and it is located in the southeastern portion of the state of Durango within the municipality of the same name. It is considered as an unconfined aquifer (based on its geological and pumping tests) and it is contained primarily in granular materials represented by porous medium, associated with alluvial and fluvial environments. This aquifer has been studied by the National
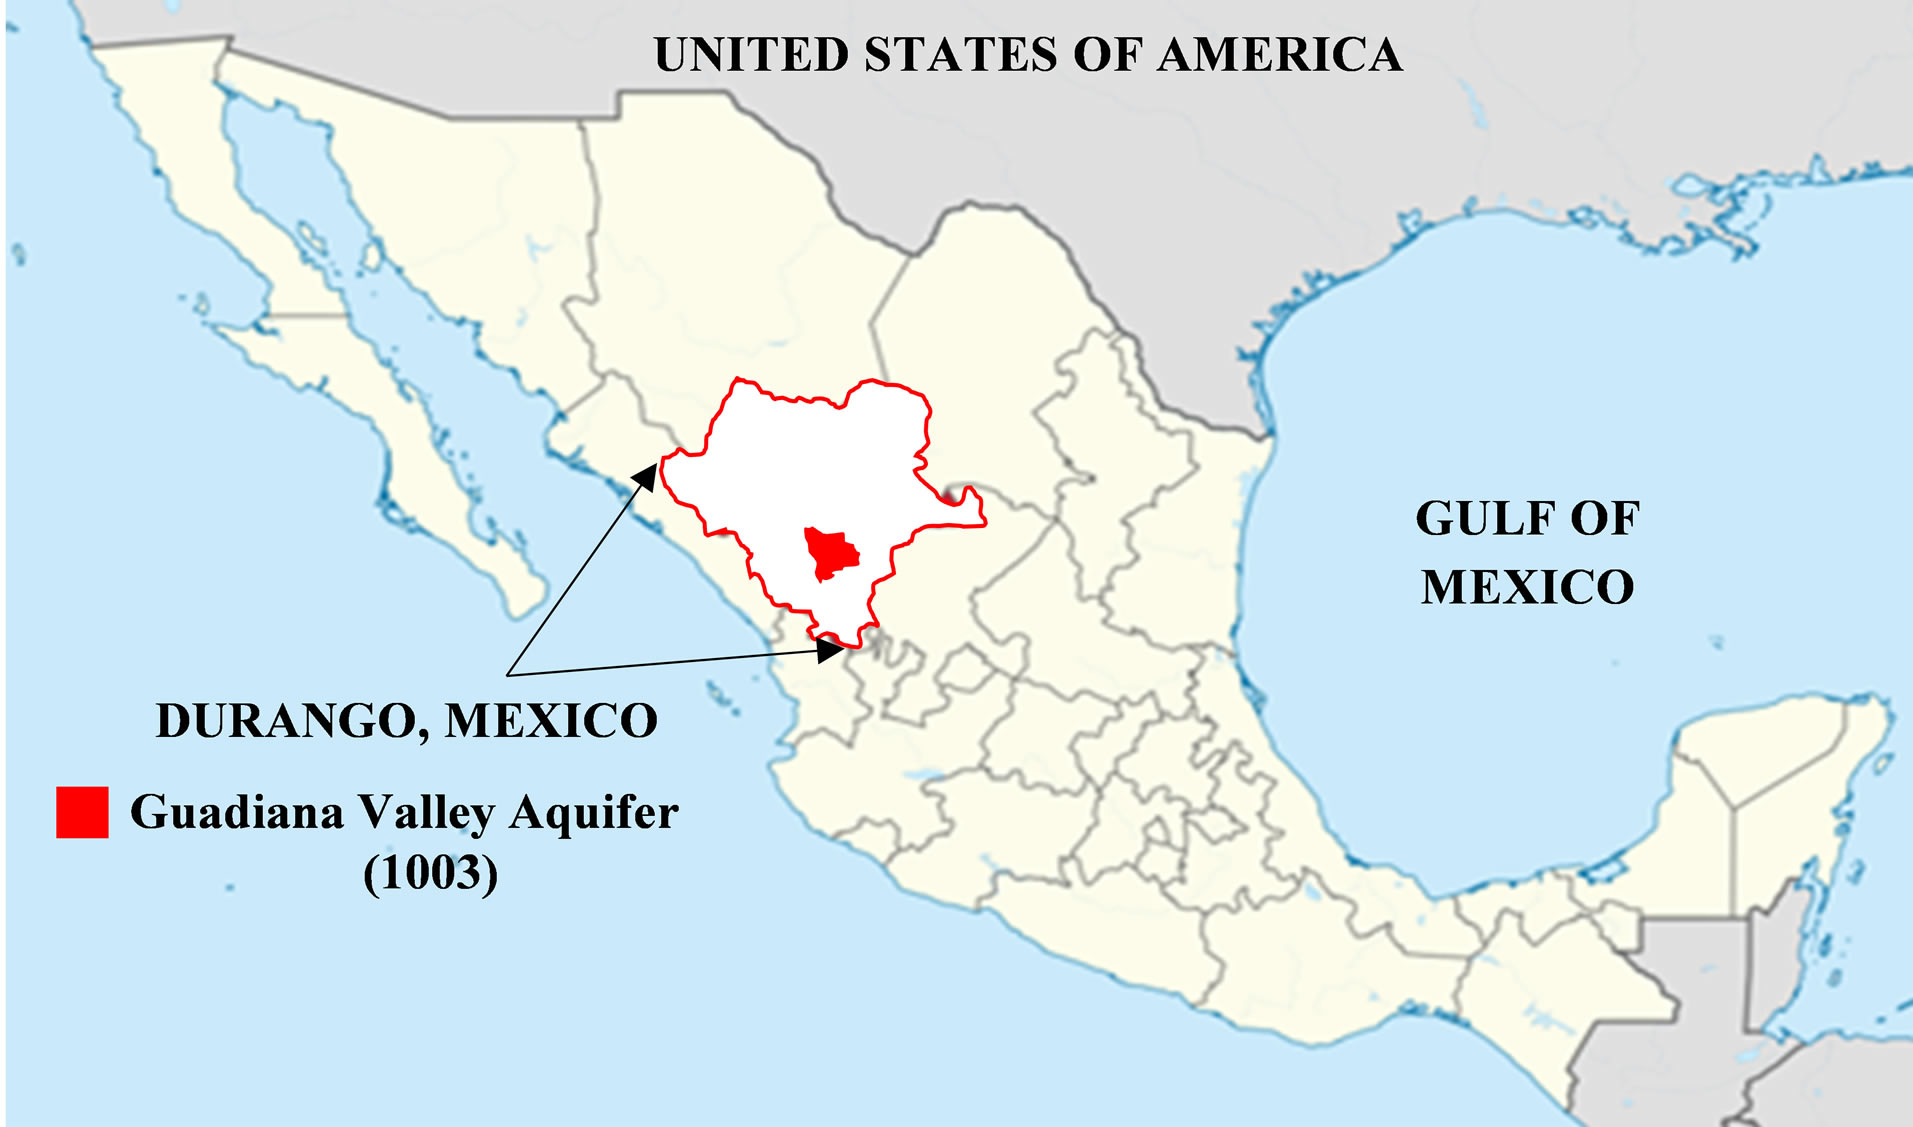
Figure 1. Study Area. Location of Guadiana Valley Aquifer in Durango, Mexico.
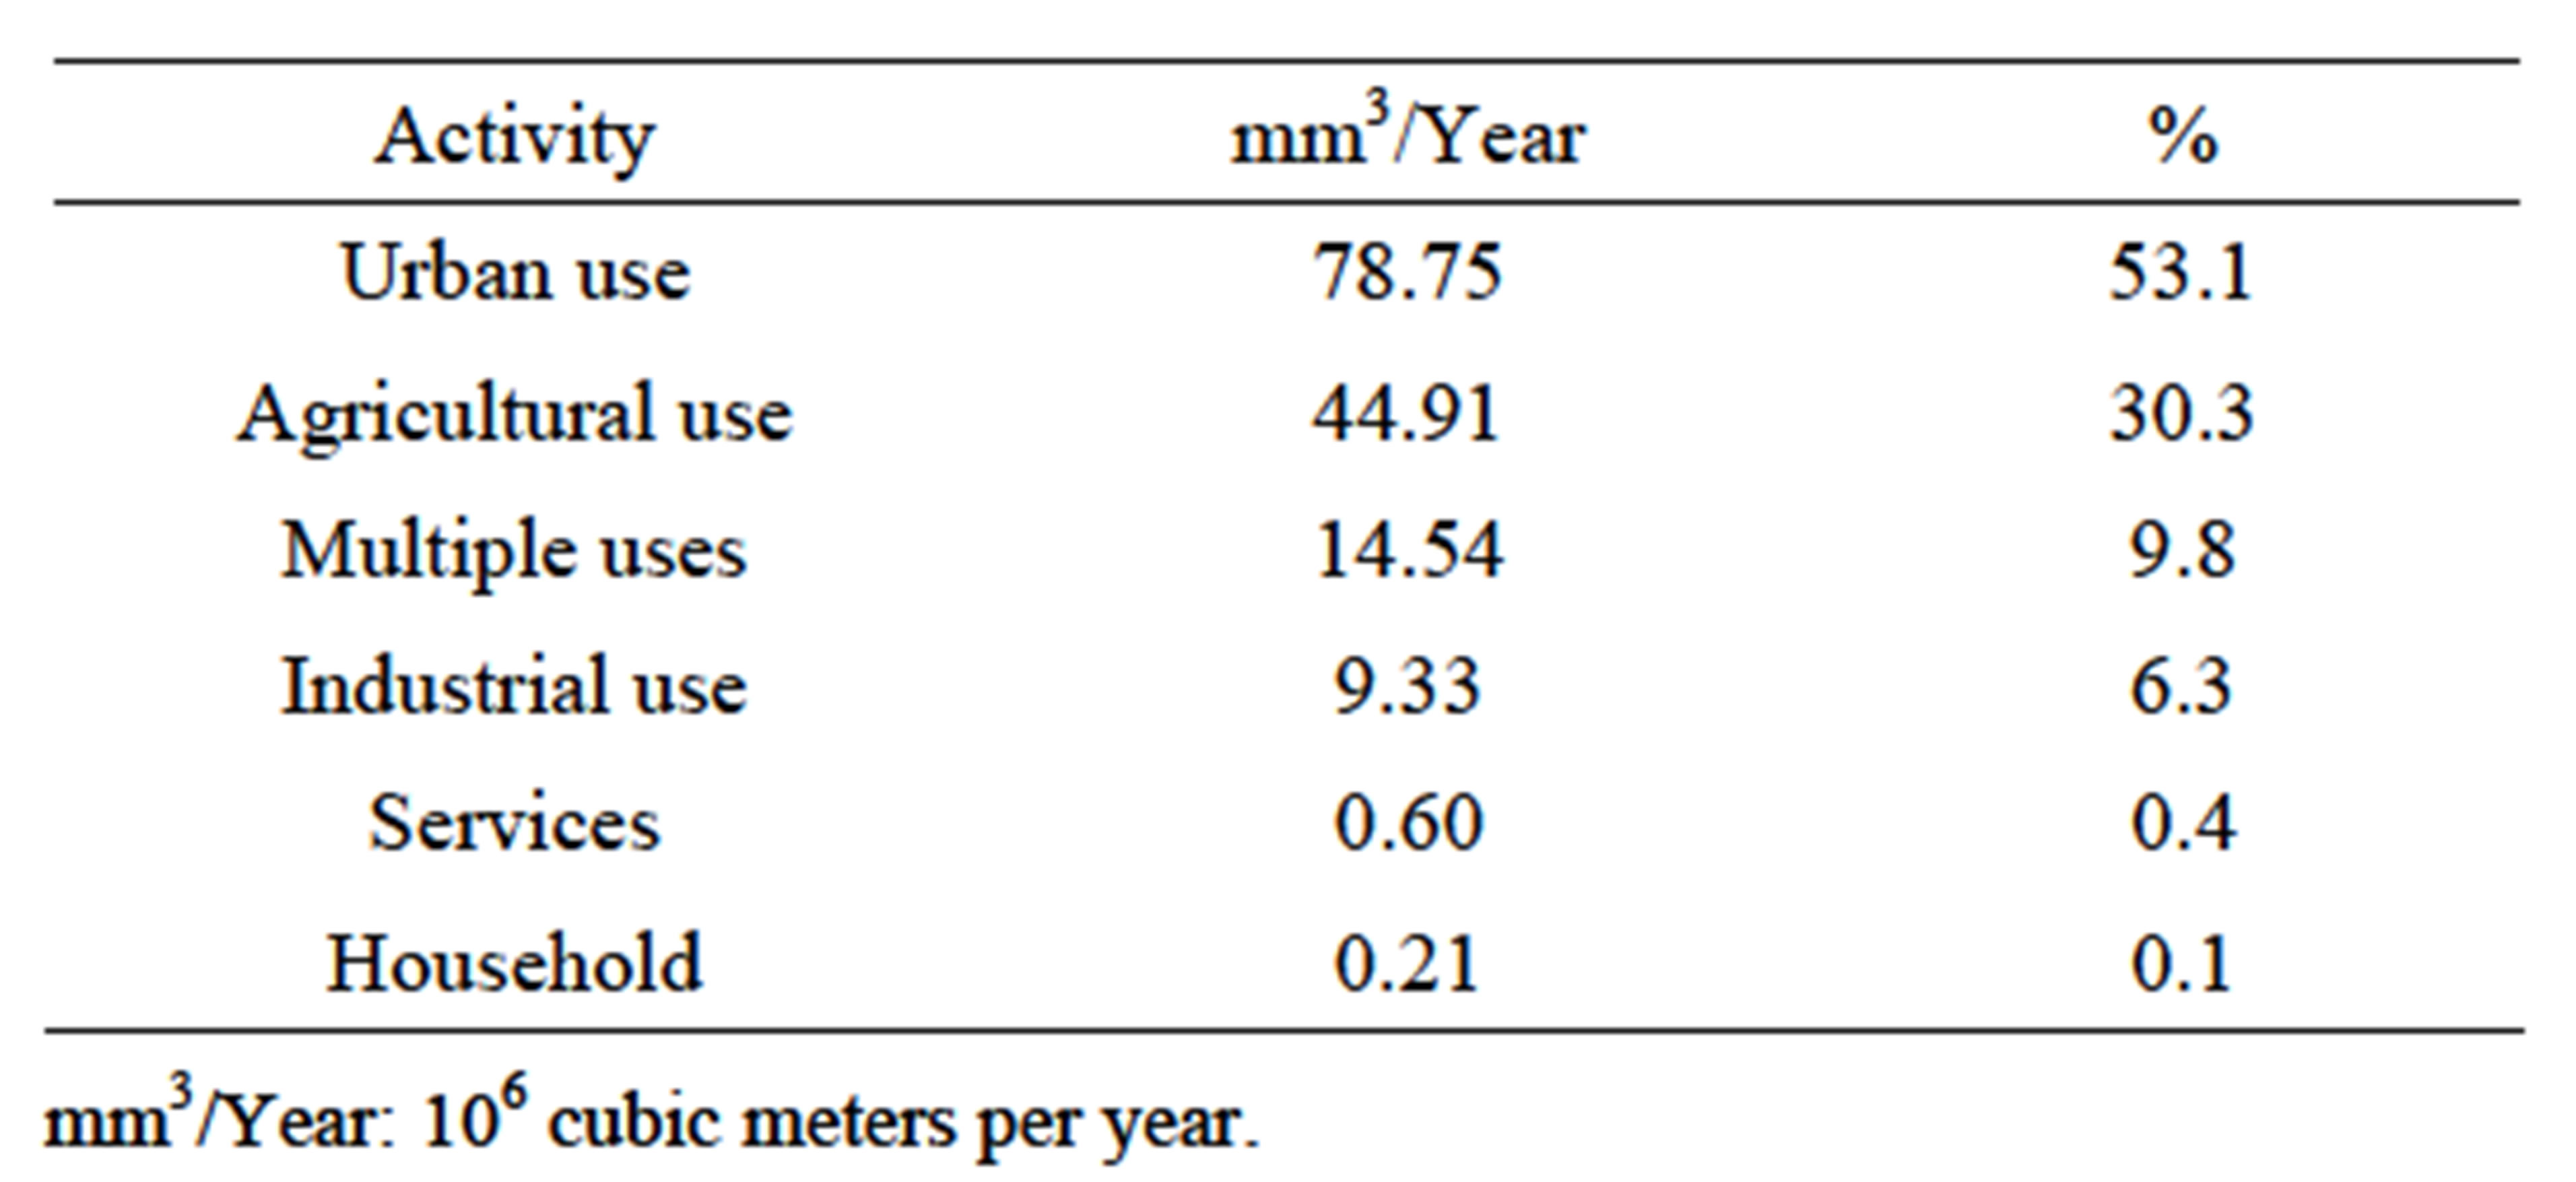
Table 1. Uses of water extracted from Guadiana Valley Aquifer.
Water Commission (CNA, Spanish acronym) and the institutions that preceded the National Water Management and it is currently classified as overexploited, highlighting the presence of toxic elements in groundwater, such as fluorine and arsenic. Groundwater levels in 2007 were recorded at depths of one meter in the northeastern part of the Valley to the La Sauceda River and 47 meters to the north of Durango City. In the area of greatest concentration of wells, depths have reached 20 to 30 meters, the greatest depth recorded was 75 meters and has been documented that there is no significant groundwater discharge from the aquifer [2]. For 2009 there were 7 × 10⁶ m3 as a deficit in its annual average availability and mean water level fell down 27 cm/year; the deficit was caused by overexploitation and increasing demand, because extraction exceeds the natural recharge of the aquifer, producing an increase in the concentration of dissolved minerals. Commonly water extraction takes place at depths of 250 meters at which the elements that form the volcanic rocks have been naturally dissolved, however 75% of the population of the country has satisfied their drinking water needs from much deeper wells, in which fluoride and arsenic concentrations are higher than the limits established in NOM-127-SSA1-1994 [3].
At present there is a latent problem because the Guadiana Valley aquifer is polluted by the presence of inorganic chemicals such as fluorine (F) and arsenic (As) whose presence can be attributed to both industrial leachate and waste from livestock industry such as insecticides, fertilizers, etc. However, as for this research, their presence is attributed mainly to the geological composition of underground strata [4-6].
The Gonzalo Río Arronte I.A.P., a non-governmental organization, has developed activities that promote the management of water resources and reports that a total of 17 states of the Mexican Republic have problems of water pollution with fluoride (F−) and arsenic, including Durango State. It has been reported that these chemicals cause health problems in bones and teeth at high fluoride concentration and even cancer in the case of arsenic [7]. For this reason, researchers from several universities presented to the Senate an opinion that highlight the seriousness of the problem and calls for immediate action from Government.
The World Health Organization (WHO) sets maximum allowable concentrations of each element, in mg/L or parts per million (ppm), which could pose a health damage; hence established 0.01 mg/L for arsenic and 0.7 mg/L for fluoride in water is for human use and consumption. Meanwhile Mexican law issued NOM-127-SSA1- 1994 [3] by establishing maximum permissible limits (MPL) for arsenic and fluorine (quantified as fluoride, F−) present in groundwater. For arsenic established 0.025 ppm (after 2005), due to the damage that this element can cause to human health according to its toxic, carcinogenic, and organoleptic properties. Arsenic is a normal component of the human body in its organic forms and in their inorganic forms is poisonous; its absorption is carried out easily through the skin, lungs and gastrointestinal tract and it is distributed once absorbed by blood throughout the body and undergoes a process of methylation, highlighting it is highly carcinogenic [8-17]. The MPL for fluoride is 1.5 ppm, due to the damage in humans such as dental fluorosis, skin damage, softening and bone fractures by skeletal accumulation, among others [4,6,16-22].
Based on such background, the main objective in this investigation was to evaluate the behavior, in time and space, of arsenic and fluoride concentration present in the Guadiana Valley aquifer; by sampling groundwater wells of Durango City and some wells of the rural area as a reference, and evaluating historical data from 1996 to 2013.
2. Materials and Methods
2.1. Inventory, Mapping, and Sampling of Wells
All wells were inventoried with information provided by the Water of Durango Municipality (AMD, Spanish acronym), categorized by sectors, and located with coordinates in a map using AutoCAD®. During 2006 seventy-three groundwater wells of Durango City and five strategic wells of the Guadiana Valley (with the highest concentration, as reported by reference [4]) were sampled; on a quarterly basis over a period of one year, to account for seasonal changes. Sampling and preservation were performed according to the procedure established by the Standard Methods of Analysis [3,23]. Samples were collected directly from the well or nearest faucet before the chlorination point. For fluoride, flasks were washed and rinsed with distilled water; for arsenic, material was washed with a solution (20% by volume) of nitric acid and hydrochloric acid and to preserve samples addition of concentrated nitric acid to reduce pH < 2.0 [3, 6,23].
2.2. Fluoride and Arsenic Analysis
Fluoride analysis was performed using SPADNS spectrophotometric method according to the NMX-AA-077- SCFI-2001 [24] and arsenic with atomic absorption spectrophotometry with graphite furnace (AAS-GF) established by standard methods [23].
2.3. Data Analysis
The average of the results obtained in four samplings of 2006 was used to establish changes in the concentration of fluoride and arsenic to obtain isoconcentration map (same concentration) using software Surfer® version 8.
To establish if there were changes in concentration of arsenic and fluoride, in each well with respect to time, the available historical information for 11 wells was analyzed for fluoride (1996-2007) and for arsenic (1996- 2009) [4,6,16,25]; additionally, to see changes up to 2013, 5 wells out of the 11 were selected and sampled as already described.
The differences found were validated with a randomized block ANOVA, where wells were the treatments and years were the blocks and a mean Newman-Keuls test, both with an α = 0.05. Before running statistical tests, the concentration values were standardized to values of Z to help normalize and homogenize the data, all tests were conducted using the software Statistica® version 7 [26].
For rural area wells no statistical analysis was conducted since there were many gaps in data reported by reference [25]; however, according to available data, range concentration for arsenic and fluoride were much higher than Durango City wells.
3. Results and Discussion
A total of 73 groundwater wells located in Durango City (North = 19, South = 23, East = 14, and West = 17) and 5 wells of the Guadiana Valley (rural area) with the highest concentrations as reported by reference [4], were sampled.
3.1. Calibration Curves and Quantification of Fluoride and Arsenic
Calibration curves were developed for fluoride and arsenic. With the concentration data obtained in all four samplings average values were determined, by well and by sector. The results were evaluated by comparing them with the maximum permissible limits (MPL) in drinking water according to the regulation (1.5 and 0.025 ppm, for fluoride and arsenic, respectively).
3.2. Durango City Wells
Fluoride: The highest concentration, 7.6 ppm (5 times the MPL) was found in well 16 in the eastern sector. Data gathered showed that 97% of the city wells sampled had concentrations that exceeded the MPL (1.5 ppm). The concentration range for fluoride in the city was 1.1 to 7.6 ppm. The bar graph in Figure 2 shows the average concentrations for each geographical area.
Arsenic: The highest arsenic concentration, 0.076 ppm (3 times the MPL) was registered in well 54 in the western sector. In general, concentrations of 67% of the wells in Durango City ranged from 0.026 to 0.076 mg/L, and only the remaining 33% met the MPL (0.025 ppm). The overall average concentration in the city was 0.032 mg/L and the lowest concentration (0.006 mg/L) was found in well 45 (western sector). Figure 3 shows the average concentrations for each geographical area. Table 2 summarizes the results for concentration and % range of both elements.
3.3. Guadiana Valley Wells (Rural Area)
Concentrations quantified in the five rural area wells were much higher in comparison to the wells of Durango City, as discussed below. The range of fluoride concentration ranged from 1.7 to 17.8 mg/L, exceeding all cases the MPL (1.5 ppm).
The Colonia Hidalgo well is geographically located to the north of the Guadiana Valley and it had the highest
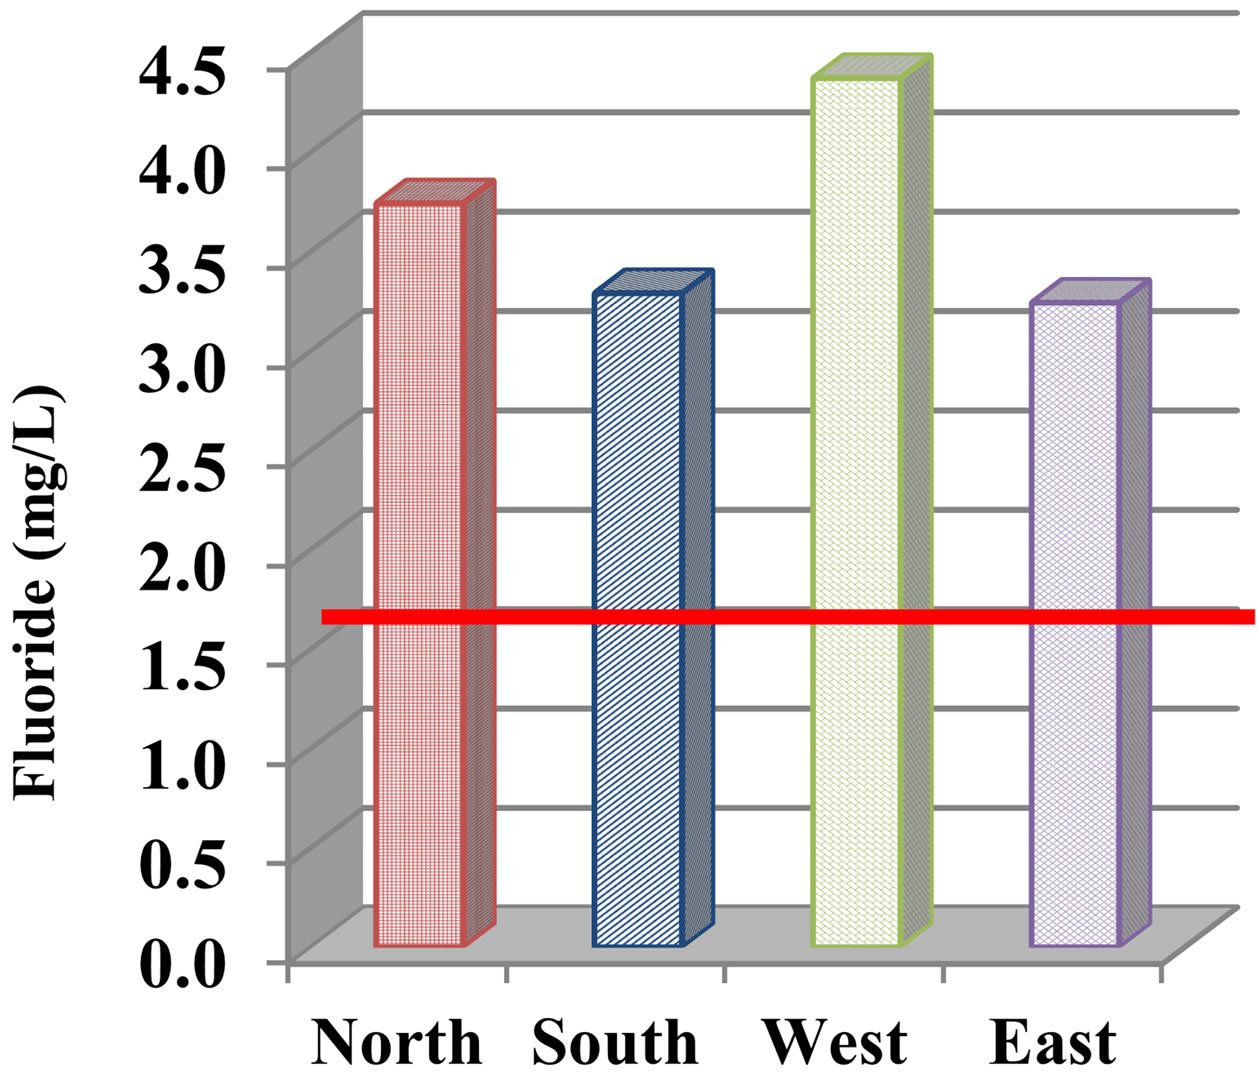
Figure 2. Average concentration of fluoride in Durango City groundwater wells. Red line indicates the maximum permissible limit (MPL).
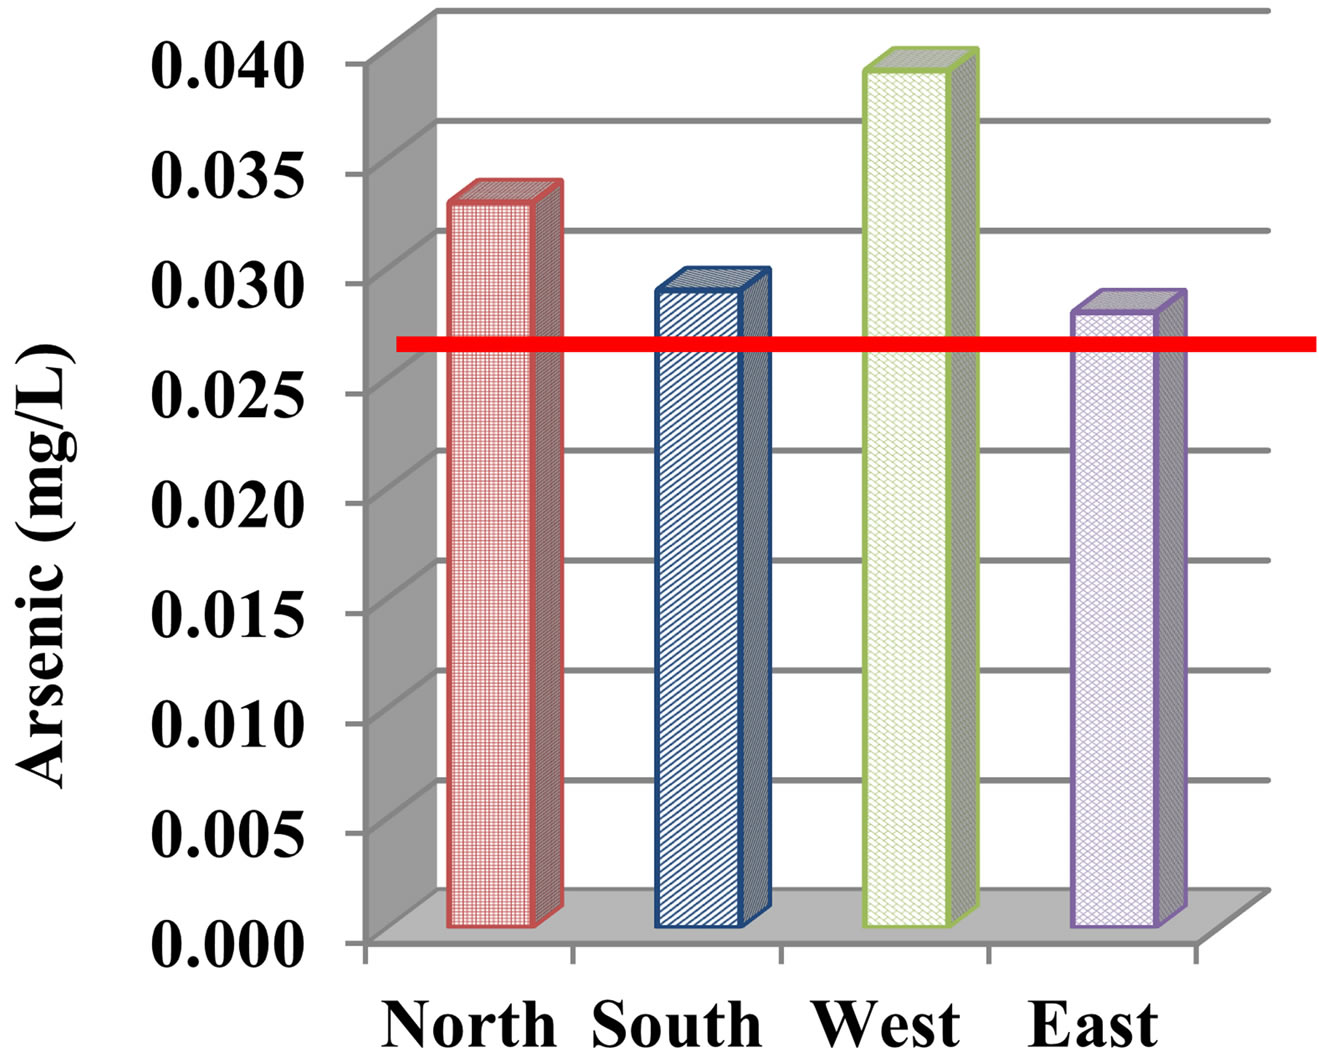
Figure 3. Average concentration of arsenic in Durango City groundwater wells. Red line indicates the maximum permissible limit (MPL).
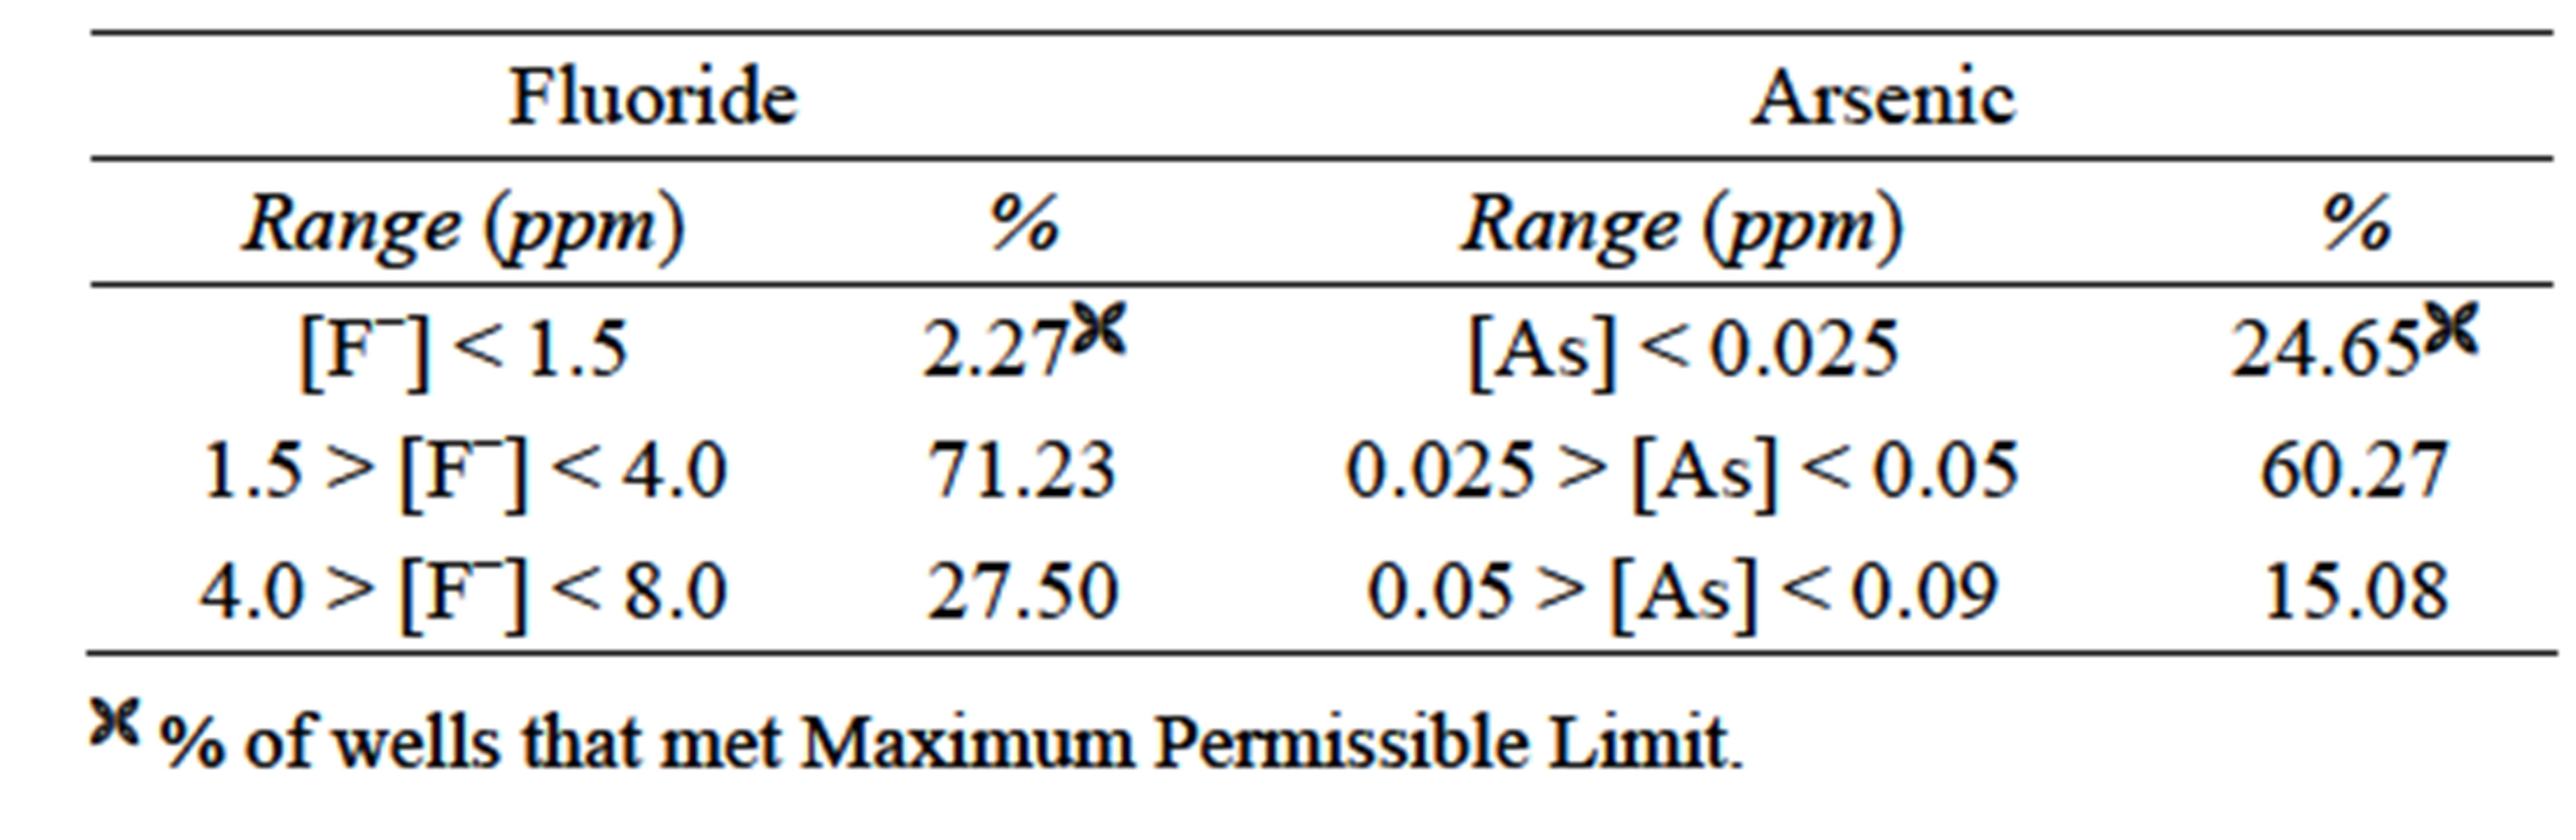
Table 2. Distribution of wells (%) for Durango City sectors, according to concentration range for fluoride and arsenic.
concentration of fluoride (17.8 mg/L, 11.9 times the MPL), Table 3. It should be noted that the other four wells are located in the aquifer recharge zone; because of this, it should be considered that the groundwater quality in this sector is much better than the northern area. For arsenic analysis values ranged from 0.009 to 0.149 mg/L. As in the case of fluoride, the Colonia Hidalgo well presented the highest average concentration of arsenic as well, 0.140 mg/L, 5.6 times the MPL. Only two of the five wells sampled (40%) were below the MPL (0.025 mg/L), Table 3, sharing the hypothesis that the source of this contamination is mainly attributable to geological composition.
3.4. Behavior of Fluoride and Arsenic Concentrations with Time
It is important to mention that several samples for this research (2007 and 2013 data) were sent for analysis at random to a certified laboratory in order to support results and give certainty to the information generated; no significant difference was observed when compared to own values.
Data of fluoride and arsenic concentrations gathered in this research [6] was compared to historical values (1996- 2013) reported by different sources [4,16,24]. It was demonstrated that the concentration of fluoride in each of the 11 wells did not change with time for the 1996-2007 period (F = 1.166 and p = 0.5154). The 2009 data was not included in this statistical analysis, because they were out of range as compared to the data from the rest of the sources. The same behavior, no change in fluoride concentration, was observed for the 5 wells tested in 2013 with respect to its historical data from 1996 to 2013 (F = 1.112 and p = 0.3765); for that reason no graphs are shown.
On the other hand, when evaluating trend of arsenic concentration; there were significant differences for 1996-2013 data of five wells (F = 33.22 and p = 0.0000), as for 1996-2007 data among 11 wells (F = 26.23 and p = 0.0000), Figure 4. Data analyzed showed that concentration was getting lower with time; however, in this case, probably due to the degree of precision required for such small concentrations (parts per billion range) in groundwater and different analyst ran the samples.
3.5. Isoconcentration Maps
For a better interpretation on the distribution of the concentration of fluoride and arsenic, in the aquifer, Surfer® (version 8) software was used to elaborate maps with lines of equal concentration (isoconcentration). With this tool, it is easy to identify the location of the most affected areas. Figures 5 and 6 (bottom) show the distribution of fluoride and arsenic, respectively, for Durango City wells (small red stars) sampled in 2006. The big
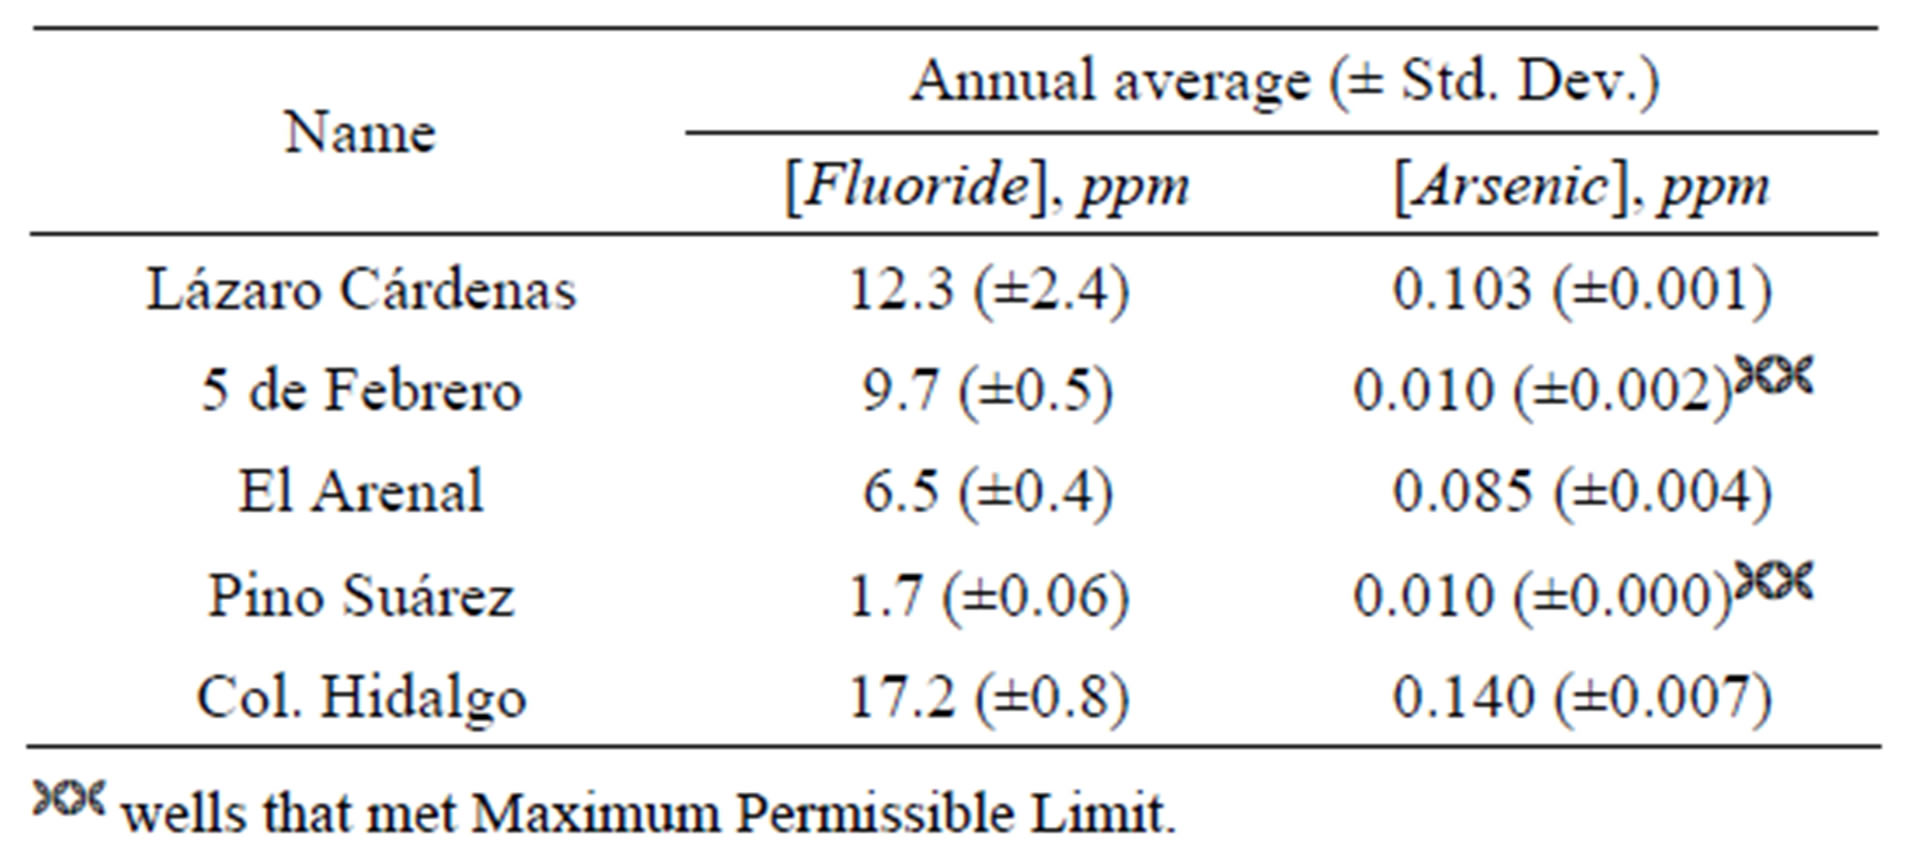
Table 3. Fluoride and arsenic concentration for rural Guadiana Valley wells.
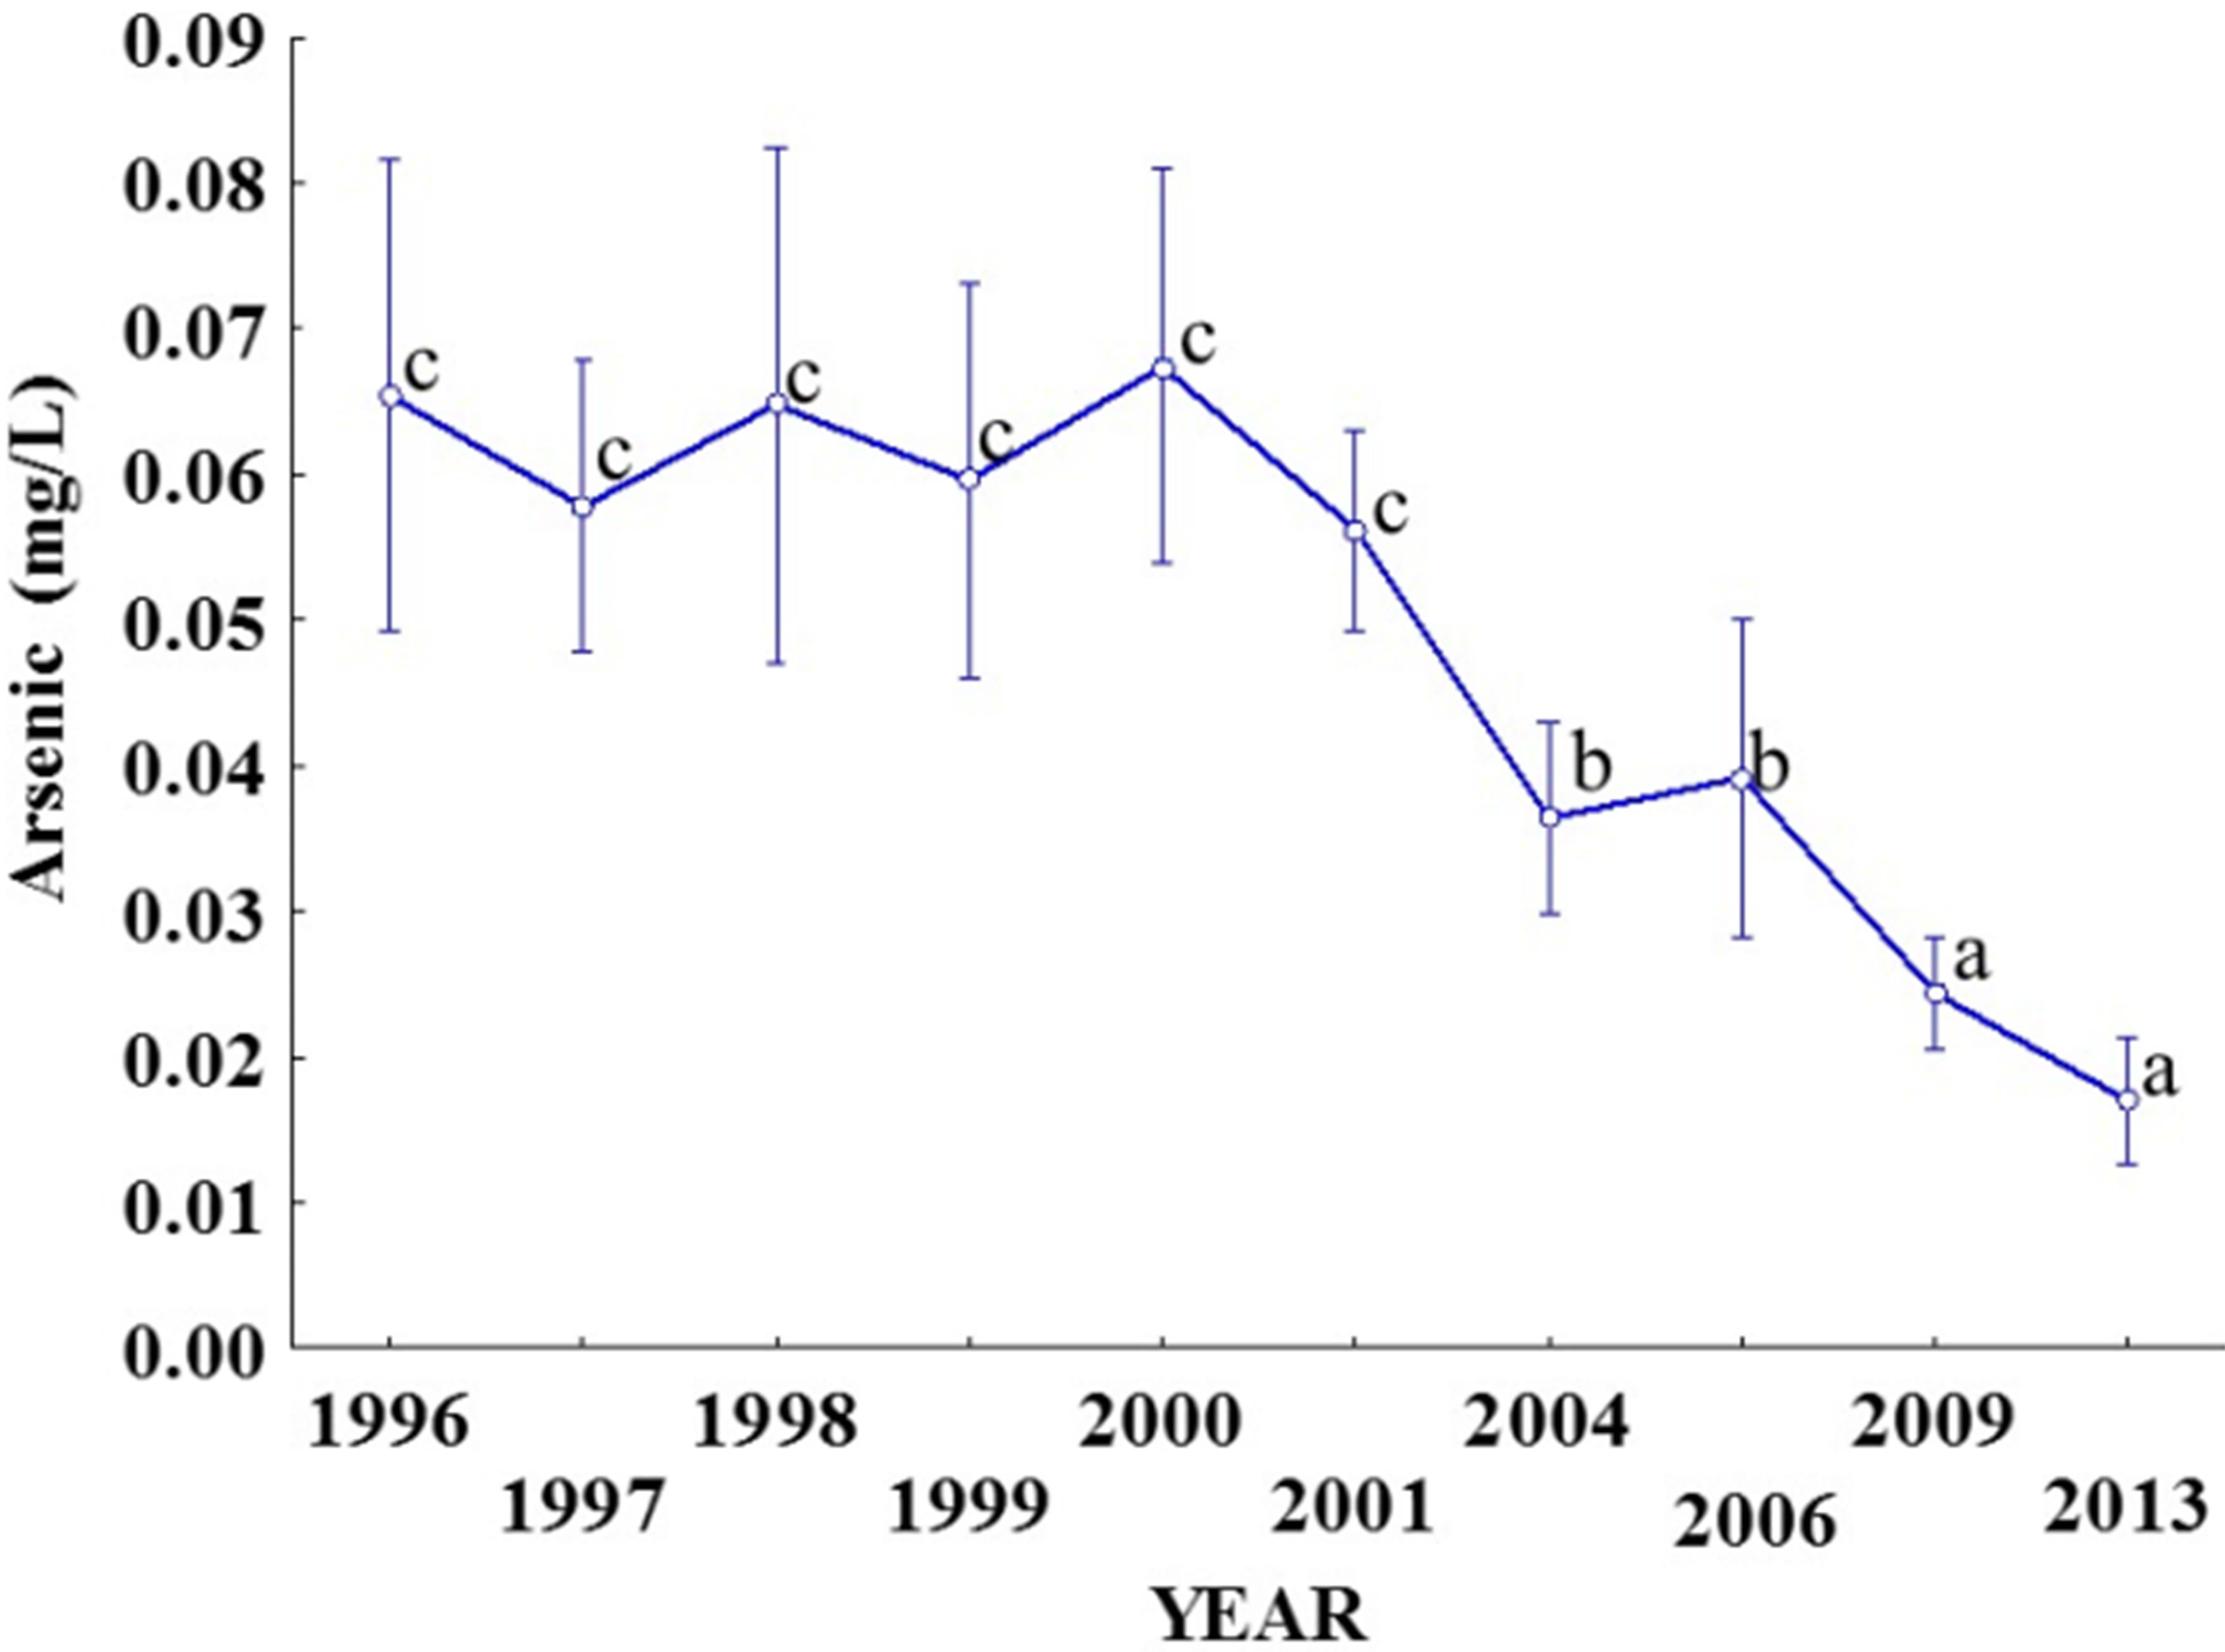
Figure 4. Statistical analysis for arsenic concentration in five groundwater wells of Durango City, Mexico, for historical data (1996-2013). Same letters meaning no differences between groups (α = 0.05).
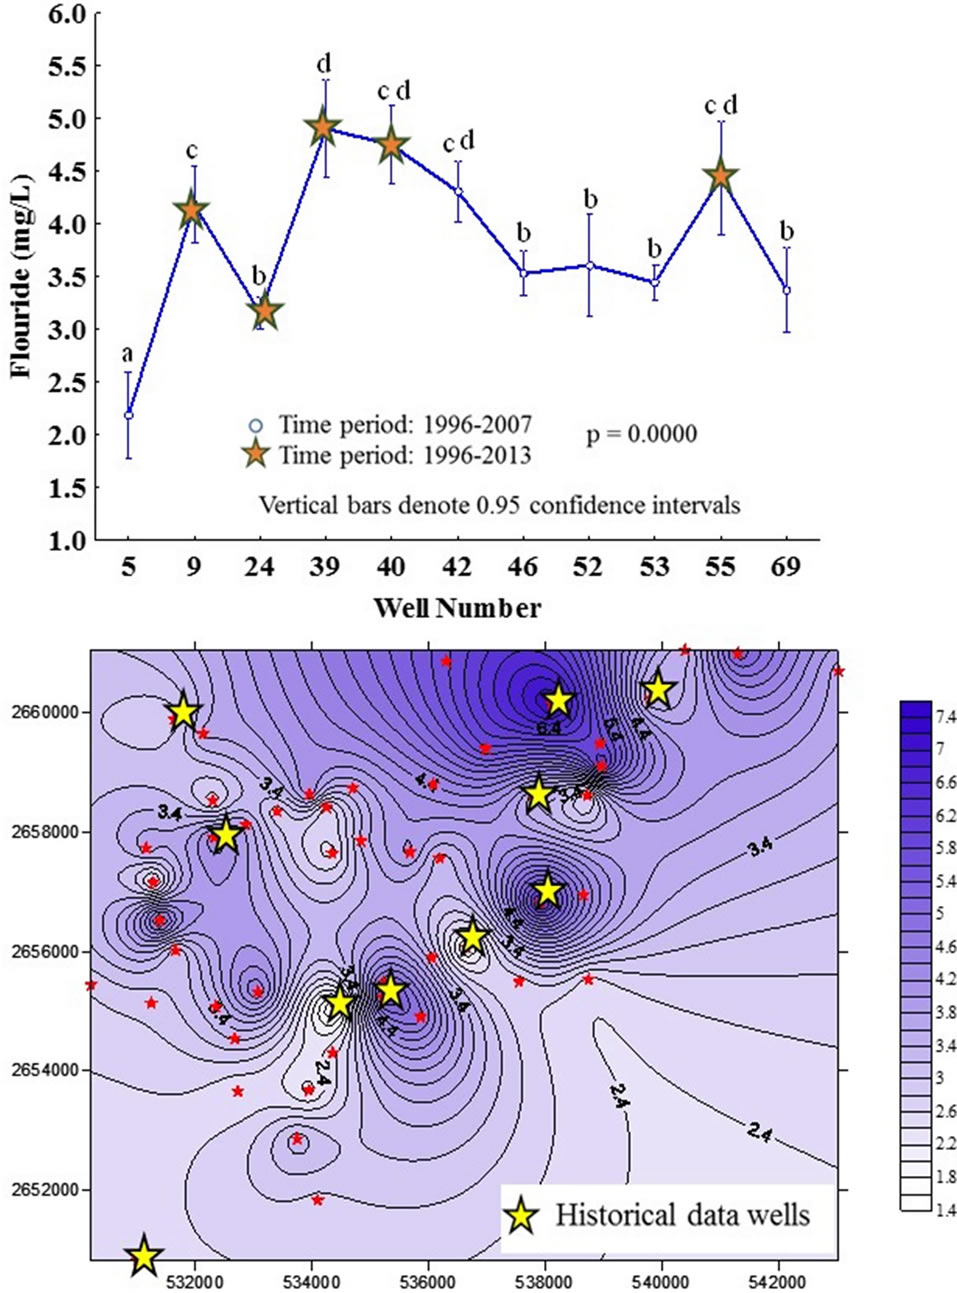
Figure 5. Top: Statistical analysis for fluoride concentration in groundwater wells of Durango City; Newman Keuls test, same letters meaning no differences between groups (α = 0.05). Bottom: Isoconcentration map, values given in mg/L.
yellow stars are the wells with historical data from 1996- 2013 subjected to statistical analysis.
As already mentioned there were sectors with high and low concentrations for fluoride as shown on the isoconcentration map in Figure 5 (bottom); whereas the top graph of the same figure shows that difference in concentration among wells are statistically significant.
For arsenic, there were significant differences between 2006 and 2013 concentration as shown in Figure 4. However, trend keeps the same, wells with high concentration are always high with time (year of evaluation) as observed in isoline concentration map in Figure 6; whereas graph in the same figure shows that difference in concentration among wells are statistically significant.
4. Conclusions
Concentration of fluoride and arsenic in 73 drinking water wells of Durango City and 5 Guadiana Valley wells (rural) were quantified over a period of one year, all wells were classified by sector for easier handling of information. The five wells in the rural area were selected based on the fact that those historically had shown the highest values.
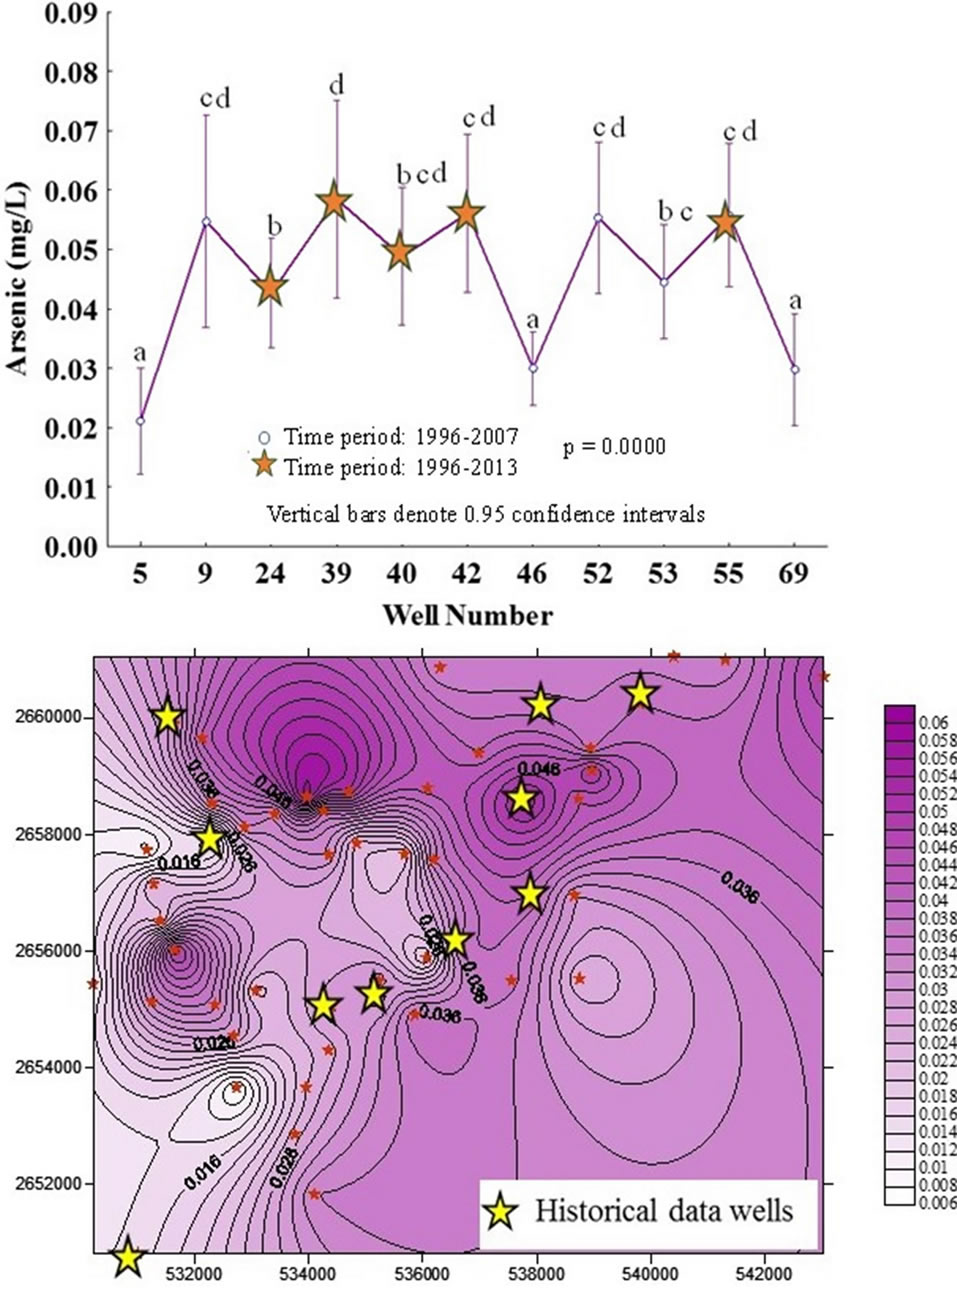
Figure 6. Top: Statistical analysis for arsenic concentration in groundwater wells of Durango City; Newman Keuls test, same letters meaning no differences between groups (α = 0.05). Bottom: Isoconcentration map, values given in mg/L.
The highest concentration for fluoride was detected in the Colonia Hidalgo well located in the rural area (17.8 mg/L), twelve-fold the MP; whereas in the city, it was well 16 in the eastern sector with 7.6 ppm (five-fold the MPL ); 100% of the Guadiana Valley wells and 97% of the city wells sampled exceeded the MPL (1.5 ppm).
For arsenic, the highest concentration value was also at the Colonia Hidalgo well (0.149 ppm, 6 times the MPL) and within the city it was well 54 located at the western region (0.076 ppm, 3 times the MPL); 67% of the city wells and 60% of the Guadiana Valley exceeded the MPL (0.025 ppm).
For fluoride, a wide concentration range was observed in the groundwater strata, mainly due to the geology of the aquifer (mineral composition) and physical properties (height above sea level and textures). However, there were no significant differences in fluoride concentration based on 1996-2007 data for 11 wells; neither for the 5 wells in the period of 1996-2013. Considering the subsurface geology and that the Guadiana Valley aquifer is over-exploited, that certainly increases the likelihood that the concentration will increase in the future.
On the other hand, statistical analysis showed significant differences for arsenic with respect to time for 19962013. The trend for arsenic showed decrease in concentration with time; probably due to the degree of precision required because concentration was on the range of parts per billion (ppb) and because the analysts that ran the samples were different. It has been noted that the presence of arsenic in groundwater is not well understood; however it has been associated with the dissolution and desorption of the minerals that constitute the aquifer, especially metal oxides [27].
What is also important to mention is that groundwater is the source for water bottling companies sold in the city [28]. Results showed that even concentrations decreased substantially for fluoride, and none of the companies met the MPL. In the case of arsenic, only 62.5% of the removal treatments used achieved the MPL. That implies that not all removal treatments used by water bottling companies were effective, probably because of such high concentration of both elements in underground strata. It is a fact that a high percentage of Durango City wells did not meet the standards established; regulatory agency has made several attempts to solve this problem, and should be continued because it represents a health risk from the effects of fluoride and arsenic, well documented in several studies.
5. Acknowledgements
This research was funded by the municipal government, Water Municipal Agency (AMD, Spanish acronym) Technological Institute of Durango (ITD, Spanish acronym), and National Polytechnic Institute—Interdisciplinary Research Center for the Local Integral Research, at Durango (IPN-CIIDIR-DGO, Spanish acronym). Masters Scholarship awarded by the National Council of Science and Technology (CONACyT, Spanish Acronym).
REFERENCES
- Secretariat of Natural Resources and Environment, Government of the State of Durango, “Environmental and Ecological Management of Durango State and Annex of Ecological Management Model,” 2009. SRNyMA, Secretaría de Recursos Naturales y Medio Ambiente, Gobierno del Estado de Durango, “Ordenamiento Ecológico del Estado de Durango y Anexo Modelo de Ordenamiento Ecológico,” 2009. http://www.semarnat.gob.mx/temas/ordenamientoecologico/Paginas/ODecretados.aspx
- Official Journal Federation, “Agreement for Technical Studies of Aquifer 1003 Guadiana Valley, in the State of Durango,” 2010. Diario Oficial de la Federación. “Acuerdo por el que se Dan a Conocer los Estudios Técnicos del Acuífero 1003 Valle del Guadiana, en el Estado de Durango,” 7 de Julio del 2010. http://dof.gob.mx/nota_detalle.php?codigo=5150942&fecha=07/07/2010
- Secretariat of Environment and Natural Resources, “Modification to the NOM-127-SSA1-1994. Environmental Health. Water for Use and Human Consumption. Quality Permissible Limits and Treatments for Water Potabilization,” Official Journal Federation, 2000. SEMARNAT, Secretaría de Medio Ambiente y Recursos Naturales, “Modificación a la Norma Oficial Mexicana NOM-127- SSA1-1994. Salud Ambiental. Agua para Uso y Consumo Humano. Límites Permisibles de Calidad y Tratamientos a que Debe Someterse el Agua para su Potabilización,” Diario Oficial de la Federación, 22 de Noviembre del 2000. http://www.salud.gob.mx/unidades/cdi/nom/m127ssa14.html
- I. Flores-Montenegro, “Evaluation of Fluoride and Arsenic Concentrations in Guadiana Valley Drinking Water and Removal Alternatives,” M.Sc. Thesis, Technological Institute of Durango, Durango, 1998. “Evaluación de las Concentraciones de Flúor y Arsénico en el Agua Potable del Valle del Guadiana y Alternativas de Remoción,” Tesis de Maestría, Instituto Tecnológico de Durango, México, 1998.
- National Water Commission, General Technical Groundwater Management, “Determination of Water Availability in the Guadiana Valley Aquifer, State of Durango,” 2002. CNA, Comisión Nacional del Agua. Subdirección General Técnica Gerencia de Aguas Subterráneas, “Determinación de la Disponibilidad de Agua en el Acuífero Valle del Guadiana, Estado de Durango,” 30 de Abril del 2002. ftp://ftp.conagua.gob.mx/SISI1610100117809/DR_1003-guadiana.pdf
- C. C. González-Nevarez, “Concentration Change of Arsenic and Fluoride in the Guadiana Valley Aquifer and Its Relationship to Static Level,” M.Sc. Thesis, Technological Institute of Durango, Durango, 2007. “Cambio de la Concentración de Arsénico y Flúor, en el Acuífero Valle del Guadiana, y su Relación con el Nivel Estático,” Tesis de Maestría, Instituto Tecnológico de Durango, México, 2007.
- Non-Governmental Organization (NGO), Gonzalo Río Arronte, I.A.P., “Water Pollution, Present in 17 States” Virtual Center Information on Water, Mexico City. Fundación Gonzalo Río Arronte, I.A.P., “Contaminación del Agua, Presente en 17 Estados,” Centro Virtual de Información Sobre el Agua, Ciudad de México. http://www.agua.org.mx/h2o/index.php?option=com_content&id=1540:-contaminacion-del-agua-presente-en-17-estados&Itemid=146
- L. M. Del Razo, M. A. Arellano and M. E. Cebrián, “The oxidation Status of Arsenic in Well Water from a Chronic Arsenicism Area of Northern Mexico,” Environmental Pollution, Vol. 64, No. 2, 1990, pp. 143-153. http://dx.doi.org/10.1016/0269-7491(90)90111-O
- G. A. Wasserman, et al., “Water Arsenic Exposure and Children’s Intellectual Function in Araihazar, Bangladesh,” Environmental Health Perspective, Vol. 112, No. 13, 2004, pp. 1329-1333. http://dx.doi.org/10.1289/ehp.6964
- A. Albores, M. E. Cebrian, I. Tellez and B. Valdez, “Comparative Study of Chronic Hydroarsenicism in Two Rural Communities in the Region Lagunera of Mexico,” Boletín de la Oficina Sanitaria Panamericana, Vol. 86, No. 3, 1979, pp. 196-205.
- ATSDR, Agency for Toxic Substances and Disease Registry, “Toxicological Profile for Arsenic (Update),” US Department of Health and Human Services, Washington DC, 2007. http://www.atsdr.cdc.gov/toxprofiles/tp2.pdf
- E. Astolfi, A. Maccagno, J. C. García, R. Vaccaro and R. Stímola, “Relation between Arsenic in Drinking Water and Skin Cancer,” Biological Trace Element Research Vol. 3, No. 2, 1981, pp. 133-143. http://dx.doi.org/10.1007/BF02990453
- M. E. Cebrian, A. Albores, M. Aguilar and E. Blakely, “Chronic Arsenic Poisoning in the North of Mexico,” Human Toxicology, Vol. 2, No. 1, 1983, pp. 121-133. http://dx.doi.org/10.1177/096032718300200110
- M. E. Cebrián, M. A. Albores, G. García-Vargas, L. M. Del Razo and P. Ostrosky-Wegman, “Chronic Arsenic Poisoning in Humans,” In: J. O. Nriagu, Ed., Arsenic in the Environment, Part II: Human Health and Ecosystem Effects, John Wiley, New York, 1994, pp. 93-107.
- A. H. Smith, E. O. Lingas and M. Rahman, “Contamination of Drinking-Water by Arsenic in Bangladesh: A Public Health Emergency,” The Bulletin of the World Health Organization, Vol. 78, No. 9, 2000, pp. 1093-1103.
- M. J. Chávez-Soto, “Risk Assessment of Contaminants Present in Water for Use and Human Consumption of Guadiana Valley Aquifer,” M.Sc. Thesis, CIIDIR-IPNDURANGO, Mexico, 2010. “Evaluación del Riesgo por la Presencia de Contaminantes en Agua Destinada al Uso y Consumo Humano del Acuífero del Valle del Guadiana,” Tesis de Maestría, CIIDIR-IPN-DURANGO, Mexico, 2010.
- M. Bocanegra-Salazar, “Health Risk Assessment for Exposure to Fluoride and Arsenic in Well Water for Consumption in High, Media, and Center Plateau Areas in the State of San Luis Potosi,” M.Sc. Thesis, San Luis Potosi University, Mexico, 2006. “Evaluación de Riesgo en Salud por la Exposición a Fluoruro y Arsénico en Agua de Pozo para Consumo de las Zonas Altiplano, Centro y Media del Estado de San Luis Potosí,” Tesis de Maestría, Universidad de San Luis Potosí, México, 2006.
- M. T. Alarcón-Herrera, A. Martín-Domínguez and I. R. Martín-Domínguez, “Fluoride Concentration in Drinking Water: Its Relationship to Dental Fluorosis,” Proceedings of the 28th Inter-American Conference of Sanitary and Environmental Engineering, Cancun, 27-31 October 2002, pp. 1-5. “Concentración de Flúor en el Agua Potable: Su Relación con la Fluorosis Dental,” Memorias del XXVIII Congreso Interamericano de Ingeniería Sanitaria y Ambiental, Cancún, México, 27-31 Octubre 2002, pp. 1-5.
- S. Rivera, S. Godorecci, L. Orgel, E. Diaz, T. Fichs and M. I. Martin, “Fluorine: Potential Adverse Effects,” Revista Chilena de Pediatría, Vol. 64, No. 4, 1993, pp. 279- 283. “Flúor: Potenciales Efectos Adversos”. http://dx.doi.org/10.4067/S0370-41061993000400007
- ATSDR, Agency for Toxic Substances & Disease Registry, “Toxicological Profile for Fluorides, Hydrogen Fluoride, and Fluorine,” US Department of Health and Human Services, Washington DC, 2003. http://www.atsdr.cdc.gov/toxprofiles/tp11.pdf
- L. E. Landin-Rodriguez, “Physicochemical Parameters and Concentration of Fluoride and Arsenic in Water from Wells in the City of San Luis Potosi and Conurbated Area. Alternative Treatment: Fluoride and Arsenic Adsorption on Al2O3 Activated Interphase/Aqueous Solution,” M.Sc. Thesis, San Luis Potosi University, San Luis Potosi, 2006. “Parámetros Fisicoquímicos y Concentración de Flúor y Arsénico en el agua de los Pozos de la ciudad de San Luis Potosí y Zona Conurbada. Alternativa de Tratamiento: Adsorción de Flúor y Arsénico en la Interfase Al2O3 Activada/Solución Acuosa,” Tesis de Maestría, Universidad de San Luis Potosí, México, 2006.
- S. C. Freni, “Exposure to High Fluoride Concentrations in Drinking Water is Associated with Decreased Birth Rates,” Journal of Toxicology and Environmental Health, Vol. 42, No. 1, 1994, pp. 109-121. http://dx.doi.org/10.1080/15287399409531866
- APHA, “Standard Methods for the Examination of Water and Wastewater,” 21st Edition, American Public Health Association, Washington DC, EUA, 2005.
- Secretariat of Economy, “NOM-AA-077-SCFI-2001. Water Analysis—Determination of Fluoride in Natural, Sewage and Treated Waste (Cancels: NMX-AA-077-1982),” 2001. SE, Secretaría de Economía, “NOM-AA-077-SCFI-2001. Análisis de Aguas—Determinación de Fluoruros en Aguas Naturales, Residuales y Residuales Tratadas (Cancela NMXAA-077-1982),” 2001. http://www.imta.gob.mx/cotennser/index.php?option=com_content&view=article&id=94&Itemid=84
- National Water Commission, “Study of Geohydrological Prospection and Hydrogeochemical Characterization in the Guadiana Valley Aquifer, Durango,” Final Report, Groundwater Management, Durango State Management, Engineering and Support, Department of Groundwater, 2005, pp. 3-5, 38-44. CNA, Comisión Nacional del Agua, “Estudio de Prospección Geohidrológica y Caracterización Hidrogeoquímica en el Acuífero del Valle del Guadiana, Durango,” Informe final. Gerencia de Aguas Subterráneas. Gerencia Estatal Durango. Subgerencia de Ingeniería y apoyo. Departamento de Aguas Subterráneas, 2005, pp. 3-5, 38-44. http://dof.gob.mx/nota_detalle.php?codigo=5150942&fecha=07/07/2010
- Statistica, “Data Analysis Software System,” Version 7®, StatSoft, Inc., Tulsa, 2004.
- P. L. Smedley, “Arsenic Occurrence in Mexican Groundwater: Towards a Better Understanding and Mitigation,” Report OMM/PROMA No. 17 for the World Meteorological Organization & CONAGUA, 2003.
- M. A. Martínez-Prado, M. E. Pérez-López, M. G. Vicenciode la Rosa and C. C. González-Nevarez, “Concentration of Fluoride and Arsenic in Bottled Drinking Water in Durango City, Mexico,” Journal of Environmental Protection Vol. 4, No. 12, 2013. Special Issue on Groundwater Pollution, in Press.
NOTES
*Corresponding author.