Journal of Environmental Protection
Vol.4 No.12(2013), Article ID:40552,11 pages DOI:10.4236/jep.2013.412156
A Study of Hygiene in Swedish Schools and Pre-Schools-Sources of Air Pollution
![]()
Library Research, Olten, Switzerland.
Email: administrator@libraryresearch.eu
Copyright © 2013 Thomas Alsmo, Catharina Alsmo. This is an open access article distributed under the Creative Commons Attribution License, which permits unrestricted use, distribution, and reproduction in any medium, provided the original work is properly cited. In accordance of the Creative Commons Attribution License all Copyrights © 2013 are reserved for SCIRP and the owner of the intellectual property Thomas Alsmo, Catharina Alsmo. All Copyright © 2013 are guarded by law and by SCIRP as a guardian.
Received October 9th, 2013; revised November 7th, 2013; accepted November 30th, 2013
Keywords: Hygiene; Hygiene and Health; Air Quality; Sick Building Syndrome (SBS); Particle Implication; Particle Measurements; Indoor Environment; Indoor Humidity; Indoor Temperature; Particle Size; Particle Amount; Physical Environment
ABSTRACT
Poor indoor air quality is a large problem in Swedish schools, since the health of occupants may be affected. The building itself is often in focus and other building-related problems may be neglected. The hypothesis of this study is that factors other than the building itself have decisive influence on indoor environment. An assessment of these nonspecific building-related reasons for bad indoor environment has been made in the present work using surveys combined with particle measurements and comfort measurements (air humidity and air temperature). People are experiencing poor indoor air quality, the air is too dry and the temperature is uneven and uncomfortable indoors in the winter. It is important to highlight the problem of indoor environments with high particulate emissions especially in the range from 5.0 microns and larger since they are conveyers of allergens and bacteria, combined with dry air. An interesting observation regarding the ventilation system is that mechanical systems are tending to generate drier indoor air than the natural ventilation system. Results show that it is possible to decrease emissions through eliminating activity-related sources of airborne contaminants and better the comfort indoors with relatively simple measures.
1. Introduction
Poor indoor air quality is a widespread problem in Swedish schools since the health of regular occupants maybe affected. Resultant costs can be considerable at both local and national government levels, including absenteeism and rehabilitation as well as building alterations, and even demolition and rebuilding. Symptoms are irritation of eyes, nose and neck, dry mucous membranes, skin rashes, tiredness, headache and nausea. These symptoms have become called Sick Building Syndrome (SBS). However, the terminology SBS is misleading since it is not a question of the construction materials themselves being sick, but more a specific building is the focus of the problem. An appropriate division is:
A. Nonspecific building-related health effects: meaning that people suffer from the above-mentioned symptoms, while staying in a building or in a certain part of it. The symptoms disappear once they have left the premises.
B. Specific building-related health effects: meaning known building-related factors that imply health problems. Two examples are too high levels of radon which increase the risk of cancer, and bacterial contamination of water supply [1].
In a Swedish national environmental health survey, 18% of the adult population, corresponding to a million people, was found to suffer from such symptoms related to indoor air quality, e.g., in schools [2]. As to the first item above, nonspecific building-related health problems, which are the subject of this study, it is usually a specific building that is brought into focus. When health-related problems in schools are discussed it is necessary to take a holistic view encompassing all factors that could affect the indoor environment. Ordinary indoor activities, including walking and housekeeping, can cause re-suspension of settled particles [3]. Such activities may also generate new particles through abrasive wear of surfaces [4]. IAQ is strongly related to airborne particle concentration, size and chemical or biological composition. Airborne particulate pollutants have not yet been sufficiently examined, however, it is well known that these are often conveyors of allergens. Particle pollutants often consist of substances from natural cycles, for example dust, pollen, fungi and bacteria. Bad hygiene in school buildings may give rise to such high levels of airborne contaminants that health problems arise. The hypothesis of this study is that other factors than the building itself have a decisive influence on such health problems. Many participants as well as authorities issued statements in this field through reports [2,5] and on web pages [6]. They all have in common a strong focus on buildings as static units. Thus there is a risk that other factors of importance for air quality and hygiene are misinterpreted or totally neglected [7-9]. Many people are, for example, afflicted by problems from environments they cannot tolerate, both via indirect and direct contacts. A number of studies have shown significant incidence of allergy also in environments where the allergen is not supposed to be found. What happens is that people bring the allergen from the allergenic environment to schools causing the level of allergens to be high enough to keep a bronchial reaction going; whether the level is also high enough for sensitization is a matter of discussion [10]. Sensitization is the process by which the body develops an allergy. Antibodies are formed in some people when their bodies come into contact with some “common” substance. The substance then becomes an allergen for that person; the next time the person comes into contact with the substance mast cells in nose, throat, lungs, and eyes release histamine and the allergy is established. The body then becomes sensitized [11]. A sound indoor environment is of course important and the manner of attaining this may vary. The cost of eradicating problems and shortcomings in indoor environments may often be largely due to interruption of activities, sick leave, rehabilitation, and technical measures such as alterations and rebuilding. There is a risk that these factors are not considered sufficiently when the problems are to be dealt with. An important aim of this project is to investigate the sources of airborne contaminants and inadequate hygiene indoors. Concerning air quality, particles in the size interval 5.0 - 10.0 microns transport agents that impact adversely on health, such as bacteria and cat allergens; this means that increased amounts of particles correlate with people’s health problems [12,13]. Studies show that the dynamic behavior of particles makes it difficult to find both the source where they have been formed and the locations where they are finally deposited. Indoors, particles are affected by air currents that regularly arise and results indicate that particles up to 10 microns are infiltrated from lower levels up to the human breathing zone. The particles >5.0 microns exhibit strongly sedimentary behavior and come to rest, while the smaller particles tend to follow air currents [14]. Other than consideration of particle size no further study of particle behavior has been made in this study though concentration and type probably vary with time both in density and due to climatic conditions. There are no threshold limit values for air quality inside schools. Previous studies have shown that outdoor air that surrounding a building constitutes a practical basis for comparison Figure 1 [15].
2. Methods
In this project, 34 schools and preschools are studied in order to obtain a picture of the ambient air environment and how the school environment is experienced by users in the Swedish school and preschool buildings. From the 34 school environments five representative objects are selected with the goal to develop the quality of the indoor environment. The measurement methods included in the study are as follows.
SURVEYS: Surveys among the relevant school staff. It should be noted that the survey method is a subjective measurement, and it is not in this context, a validated or coated measuring method and should be handled in an appropriate restrictive manner [16,17]. For this project, a customized questionnaire’s been developed to better link the issues to the physical indoor environment through technical measurements. The questionnaire is divided
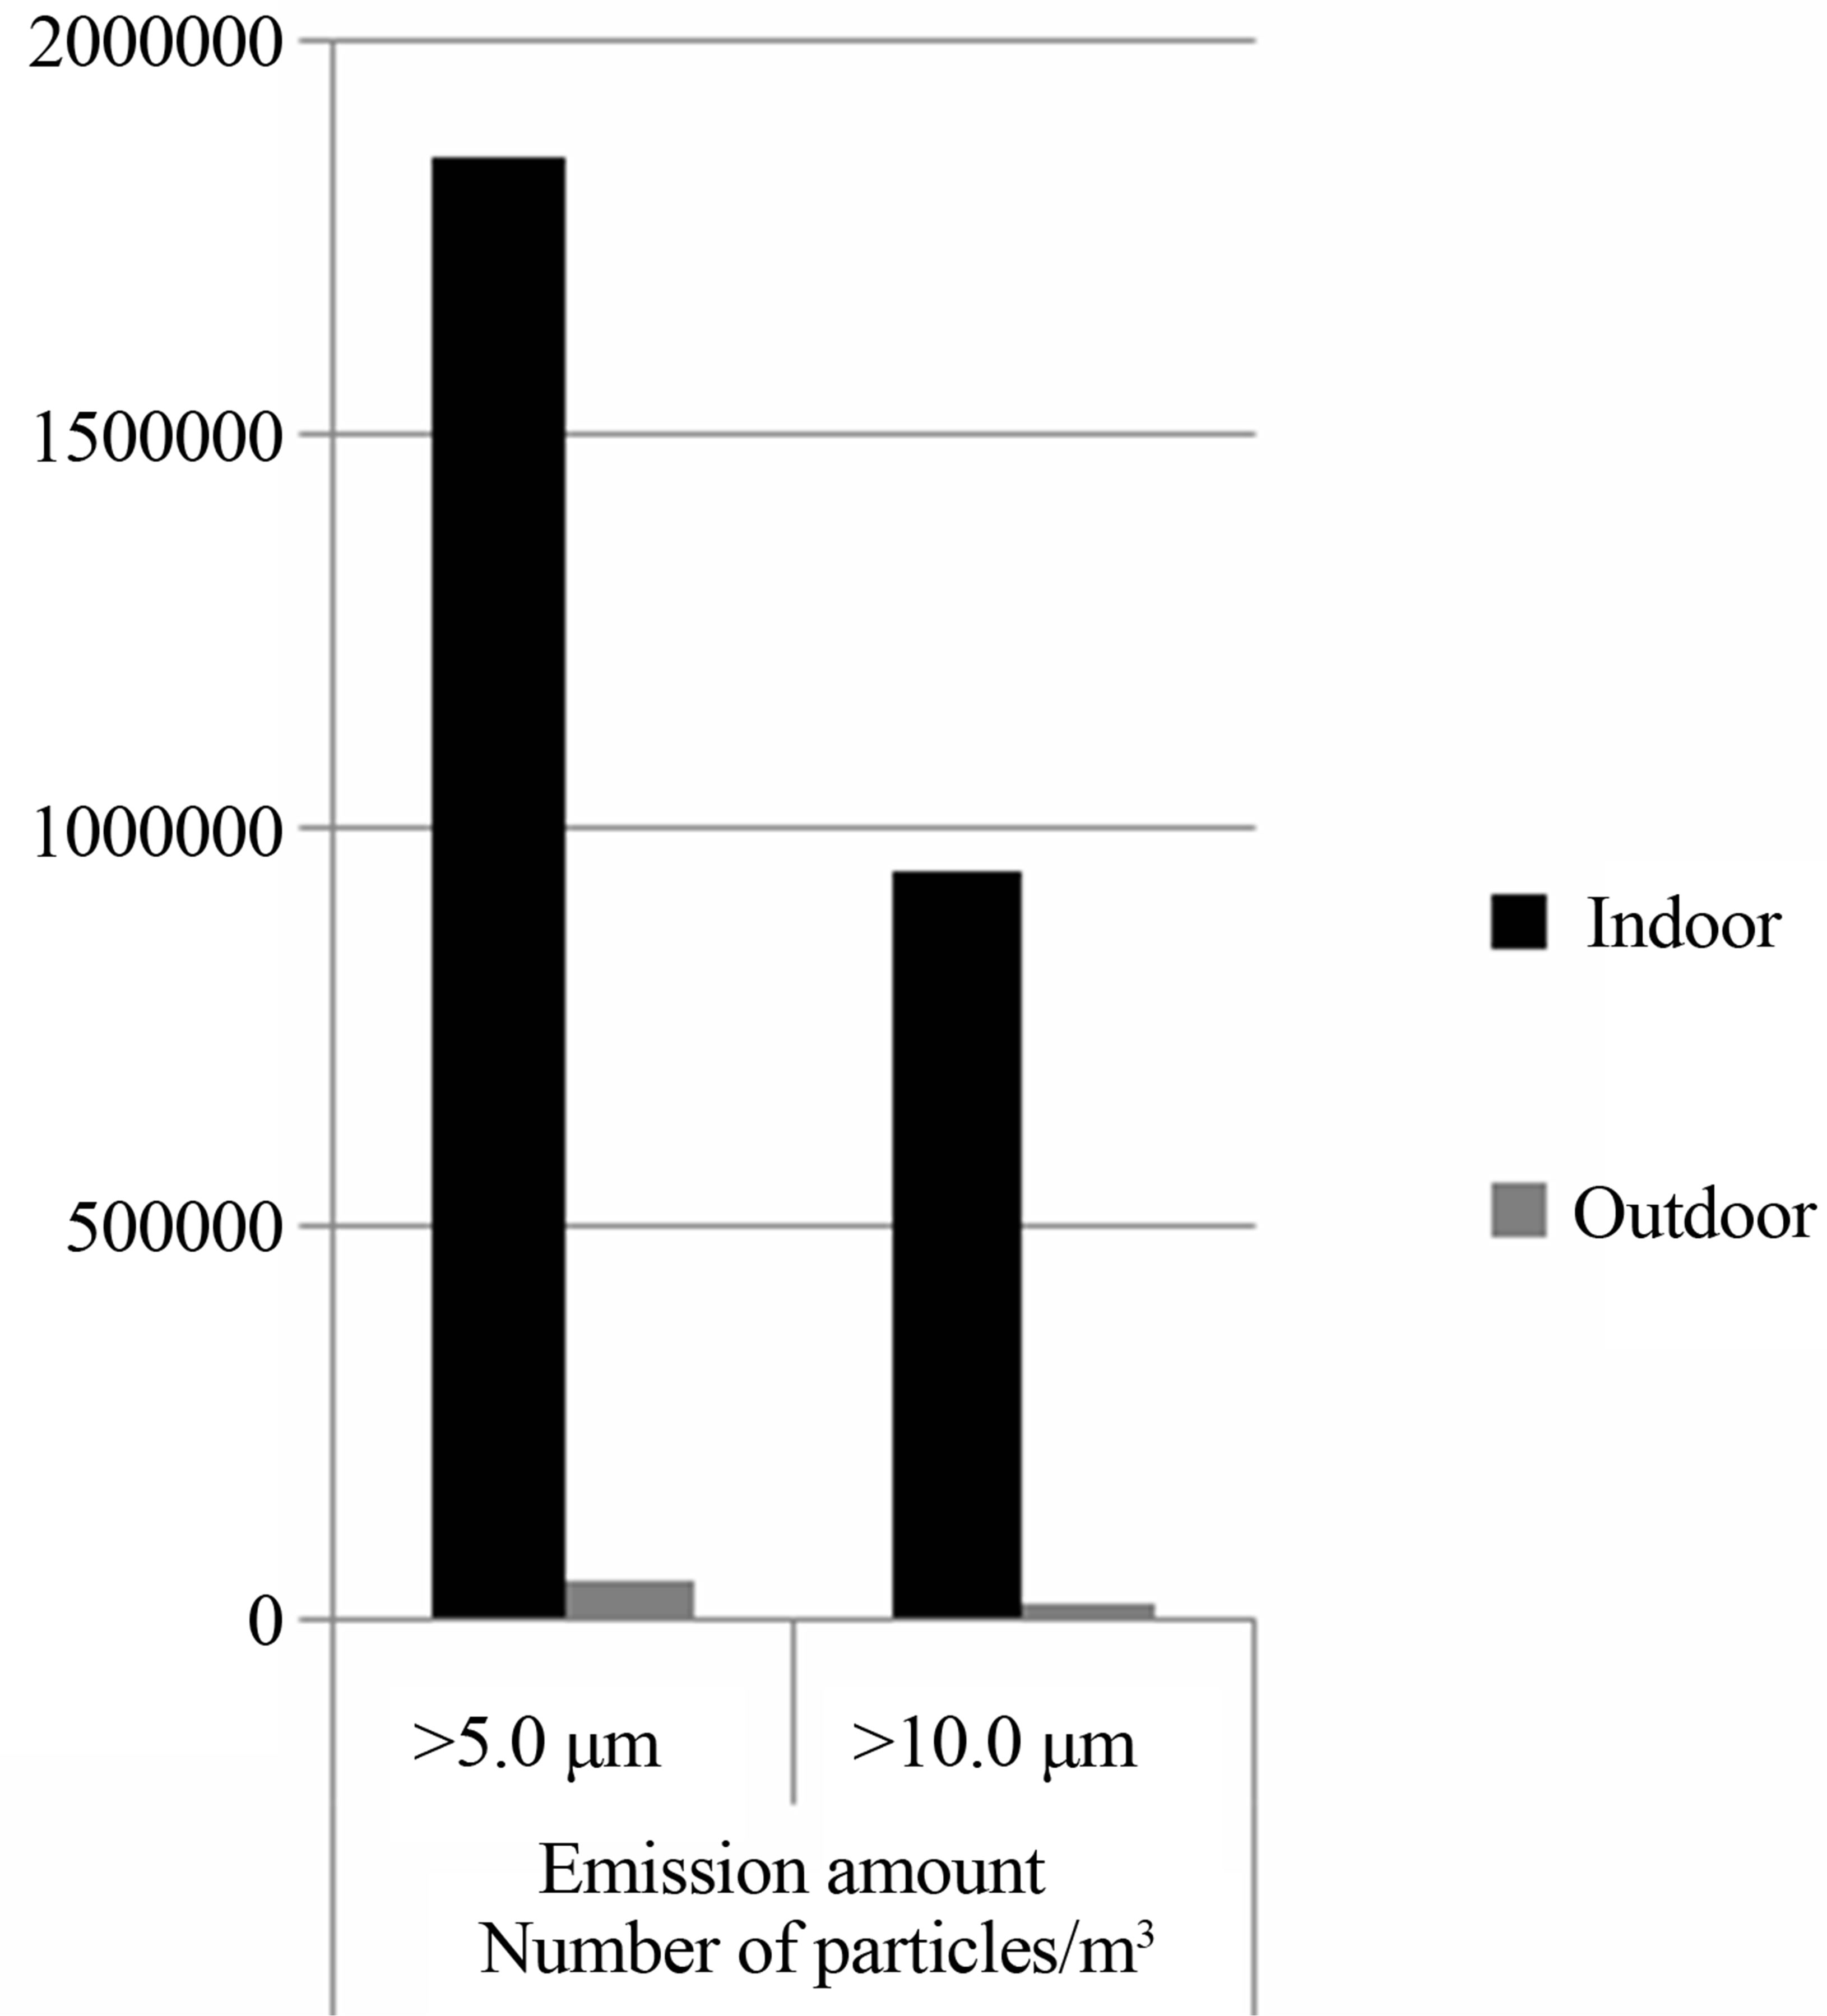
Figure 1. The chart shows the emission amount inside a school and in the air outside the school building, the number of particles/m3 > 5.0 and > 10.0 microns [15].
into four categories, A-D, with a total of nine questions.
A. Health, which can be linked to the physical interior environment by measuring the emission amount of the premises. This category includes one question in the survey. Question 1: Do You feel any health problems today when you are staying in the building?
B. Worry/Unease, cannot really be connected to the environment through physical measurements, but is a purely subjective category. However, it is important to have knowledge of the people staying in buildings experiencing the environment and therefore it is a valuable question to gain insight into. This category also includes one question in the survey. Question 2: Are you worried for future health problems due to stay in this building?
C. Air quality, which can be linked to the physical indoor environment by measuring the emission amount of the premises. This category includes three questions. Question 3: Do you experience that the air quality in your workplace is bad? Question 4: Do you experience that the air in your workplace is dusty? Question 5: Do you experience unpleasant smells in your workplace?
D. Comfort, which can be linked to the physical environment through the measurement of humidity and air temperature. This category includes four questions. Question 6: Do you experience that the air is too dry at your workplace, during the winter? Question 7: Do you experience that the air is too dry at your workplace, during the summer? Question 8: Do you experience uneven and unpleasant temperature at your workplace, during the winter? Question 9: Do you experience uneven and unpleasant temperature at your workplace, during the summer? The reason for the breakdown of the issue in winter and summer is the Swedish climate. In winter it is cold and the heating season where the heating of buildings is done with the help of technical installations, resulting in completely different conditions for the environment than during the summer when the heating of buildings is largely done from the outside air temperature. The survey has nine questions of each respondent answered with yes or no in written form and was conducted during the period January 2009-March 2013.
EMISSION MEASUREMENTS: particulate emissions can be divided into different size classes. Large particles have a diameter of 10.0 microns. Particles less than 10.0 microns in diameter are called respirable particles. The larger respirable particles are defined as rough with a size of 2.5 to 10.0 microns, while particles smaller than these are called fine particles, with a diameter less than 2.5 microns. Fine particles are very light and can be spread by air currents thousands of kilometers. For the case of Sweden, this means that occasionally flows plenty of airborne fine particles in from other countries. The most significant local source of fine particles outdoors in urban areas is traffic exhaust emissions. Also power generation, industry and heating plants emit particles into the air. The particles released by burning wood on a small scale may be important for local air quality, especially in urban single-family areas. Particles with a diameter of 0.1 micron are called ultrafine particles [18]. The base of the air environment in a building is the quality of the air surrounding the building in question. This is because the outside air is transferred to buildings via the interaction that occurs regularly between the indoor and outdoor environment. Within the framework of this project, the air environment outdoors has been studied at the 34 sites where schools and pre-schools included in the project are located. In this project the instrument TSI 8220 (TSI Incorporated, Shoreview, MN, USA) is used, which records the following size ranges: 0.3 - 0.5, 0.5 - 1.0, 1.0 - 3.0, 3.0 - 5.0, 5.0 - 10.0 and >10.0 microns. The measuring instrument treats 2.83 liters of air in one minute and the results are converted to cubic meters [19]. The project comprises a series of measurements of five individual tests that are carried out continuously with a delay of twenty seconds between each sampling. This means that each set of measurements takes 6 minutes and twenty seconds to complete. The mean value of the measurement series are calculated, reducing the risk of extreme values become too dominant and it is considered that a better standard image is obtained and the results reported from different locations. From a practical standpoint, it is difficult to make measurements when business is conducted and therefore performed in measurement when the activity is not going on. To obtain a better picture of emission sources in the room the sampler at the beginning of the measurement series activates deposited emissions. This is done by swirling up particles where emission sources are expected. After the sampler finished this part of the measurement process particles sediment back to the deposit surface during the remaining measurement time. It should be added that every human being in itself emits an amount of particles, but these emission sources are not included in the measurement results. Regarding air pollution containing particles larger than 5.0 microns, there is evidence that they are conveyors of both bacteria and allergens [12,13,20]. This means that emissions of air consisting of particles larger than 5.0 microns, correlates with human health. The Public Health Institute points out that the number of particles in the larger fractions shall be limited and reports that 99.9% of all particles should be smaller than 1.0 micron [10]. In the case of particulate emissions is missing today both limit and level value for Swedish school environments, which complicates the presentation of the results produced by it. An important aim of the emission study is to evaluate the potential for a reference level which can form the basis for the indoor environment and acceptable benchmark for the emission level in schools and preschools. Therefore, it is planned that the environment in five of the 34 school environments must be developed in order to reduce the emission load. For indoor air the air outside the building is a quality bass, but given the variation that exists regarding emissions to air outdoors, both locally and over time, it can be difficult to find a baseline for the indoor environment. To rely solely on an individual value, such as the value measured outside the building concerned, may provide an uncertain picture of the levels recorded outdoors, especially in the smaller ranges. Instead, it is better to use multiple values from the outdoor environment as a basis on which this procedure reduces the influence of the instantaneous change that occurs in outdoor air and a more neutral basis is created. The more measurements that are included in base value, the wider and more neutral from instantaneous changes the material. In this study, the average value outside of the 34 measurement sites included in the project. This is an indicative value and constitutes the basis for the assessment of air quality of the indoor environment. The measurements were conducted during the period November 2009 to March 2013.
COMFORT MEASURE: All 34 school buildings have mechanical ventilation with an approved OVK management [21]. Measurements of air humidity and air temperature were made in the five selected entities where measures are intended to reduce the emission load. These measurements were carried out during the period November 2009-February 2010 for one unit, January 2012-May 2012 for two of the units and in December 2012-February 2013 for the other two units. To evaluate the effects of air temperature and humidity affected by the installations comparative measurements were carried out in one of the five selected school environments with a building that only has natural ventilation. The measurements in these two buildings took place during the same period, 12 January to 13 February 2013. The instrument, Testo 175, used for comfort measurement is a temperature and humidity logger with two channels for external thermocouples. The instruments were programed and stored measurements were evaluated with software and the reading of the logger was done via a USB connection to a computer [22]. Regarding humidity should be noted that the air temperature influences how much moisture the air can hold. This means, despite the same humidity in percent, that low-temperature air, for example −15˚, contains less moisture than air with a temperature of 15˚C [23]. When it comes to humidity, there is a recommended level of over 30% [24]. The comfort survey also used outside air as an indicative value, where the measuring instrument had been placed outdoors at different locations.
3. Results
The survey has been directed to school staff in 34 schools and preschools, where 632 people from a total of 687 participated representing a response rate for the survey at 92 percent. The results show that problems exist in the indoor environment where users are affected by climate and health problems related to the physical indoor environment in the workplace. On questions where respondents answered unclearly or not answered at all, these are not considered in the survey summary. For each question in Table 1 below indicates, therefore, also the respective response rate.
It is clear that users are experiencing health problems related to deficiencies in the physical indoor environment and the problem is widespread in the Swedish school environment. The greatest problems are uneven and uncomfortable temperature in the winter, dry air in the winter and that the air quality is poor. Moreover, it should be noted that 43% are concerned about going to their workplace and 38% complain that they suffer direct health problems when they are staying at their workplace. Emission measurements of particles in the range of >0.3 microns were conducted in 34 schools and preschools. Measurements include a total of 645 values, in the whole
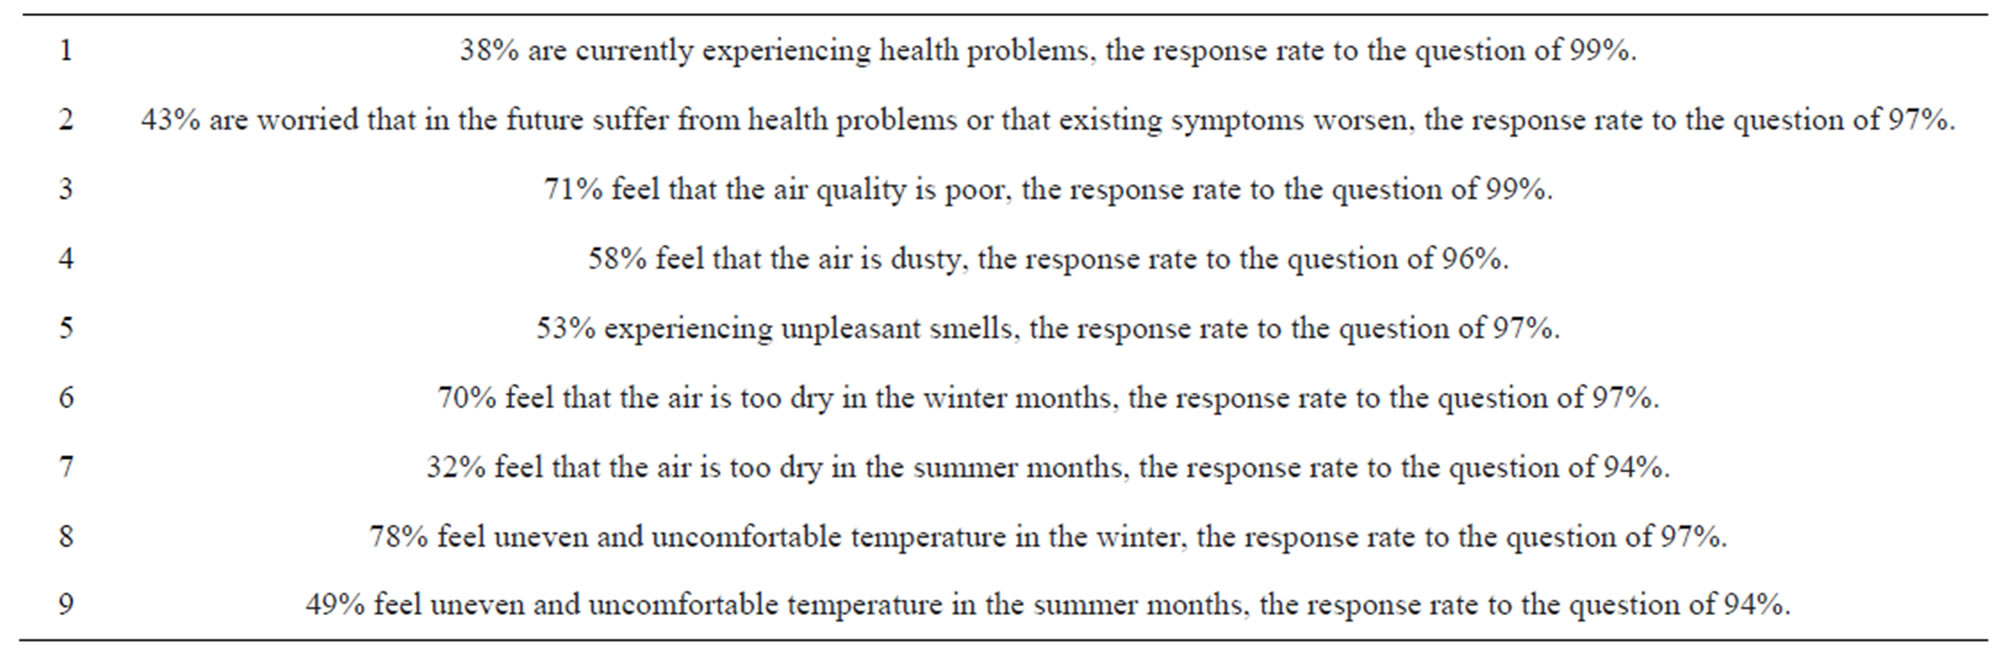
Table 1. The proportion of answers in percent and the response rates per question.
particle range from 0.3 up to >10.0 microns, at 130 different locations in 34 schools and preschools. Given the larger particles load on health, the range from 5.0 microns was studied initially. The levels in this range vary greatly between the 34 schools and preschools, from 500,000 and up to 33.2 million particles per cubic meter of air. The mean value of all measurements is 7.8 million particles per cubic meter of air. The corresponding ratio for the outdoor environment is from 0 up to 150,000 particles per cubic meter of air, with an average of 24,000 particles per cubic meter of air. This shows that large differences exist both between air environment indoors and outdoors to the disadvantage of the indoor environment and individually between schools and preschools. From the above 34 schools and preschools, 5 units were selected to investigate whether air environment can be improved. In three of these measures were taken in the entire building. In the other two buildings, measures were taken only in a part of the building, which includes areas that are separated from the rest of the building. To avoid extreme values schools and preschools with emission levels that vary from 3,200,000 and up to 11,700,000 particles per cubic meter of air with a joint average of 7,000,000 particles per cubic meter of air were selected. The target is that these will be a representative sample of the emission level in Swedish schools and preschools. The aim is to investigate whether air quality through operational changes can be improved. The change means that the management of the indoor environment can be better planned and cleaning ability can be raised. From a practical point of view dust caches should be avoided and surfaces that are not accessible for cleaning should be eliminated. The results of emission amounts in the 5 selected schools and preschools, the prevailing levels and levels after measures, are shown in the diagram Figure 2.
The measurements in the five selected units took place at two different times, before and after the measures in each school and preschool. The result shows that the emission load decreased significantly after the implemented measures. Since the survey will be anonymous, it is not possible to conduct a follow-up survey of the two units where measures do not cover the entire building. In the other three units, a follow-up questionnaire was conducted among the school staff. A summary of the number of respondents in these three units is, before measure 53 people representing 96% of staff and 46 persons after measure, which corresponds to 88% of the workforce. It is clear that the measures implemented have been well received by the respondents with the following results Table 2.
Taken together, the measurements, both the questionnaire and emission measurements, show that the implemented measures resulted in a significant positive trend
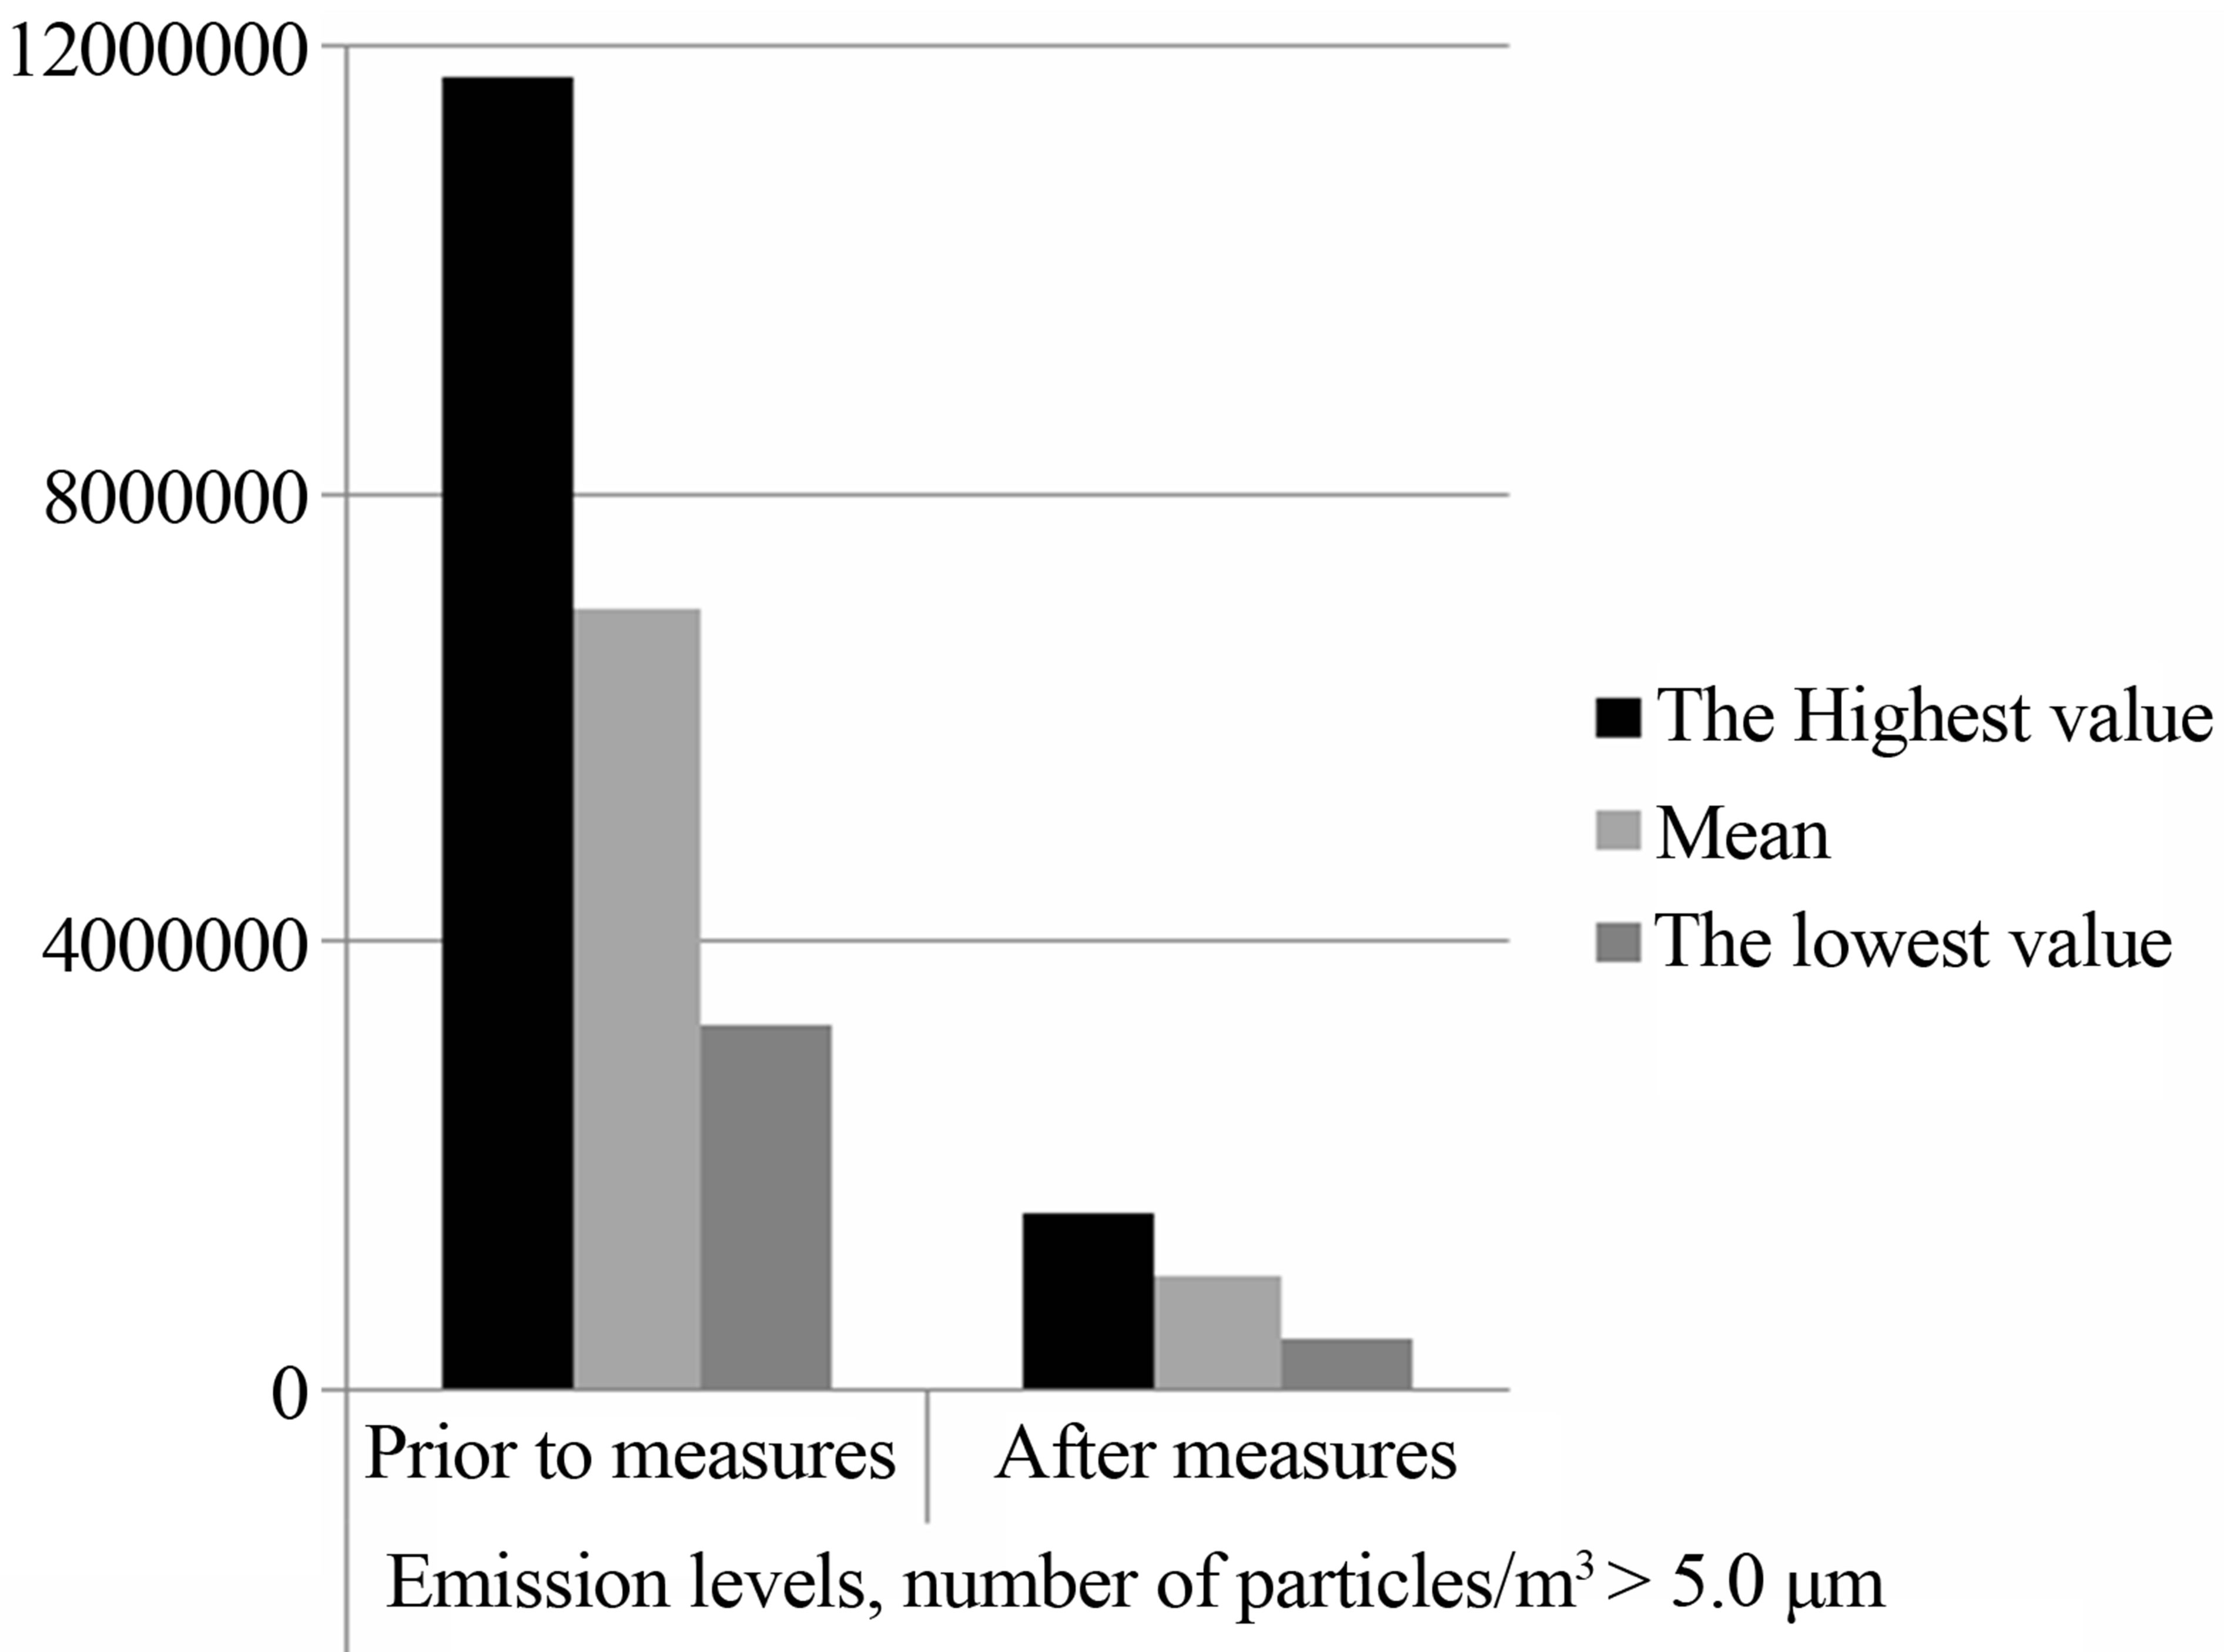
Figure 2. The chart shows the emission levels, the number of particles > 5.0 microns/m3, maximum, medium and minimum values in the 5 schools and preschools which have been selected to develop the environment with regard to air quality.
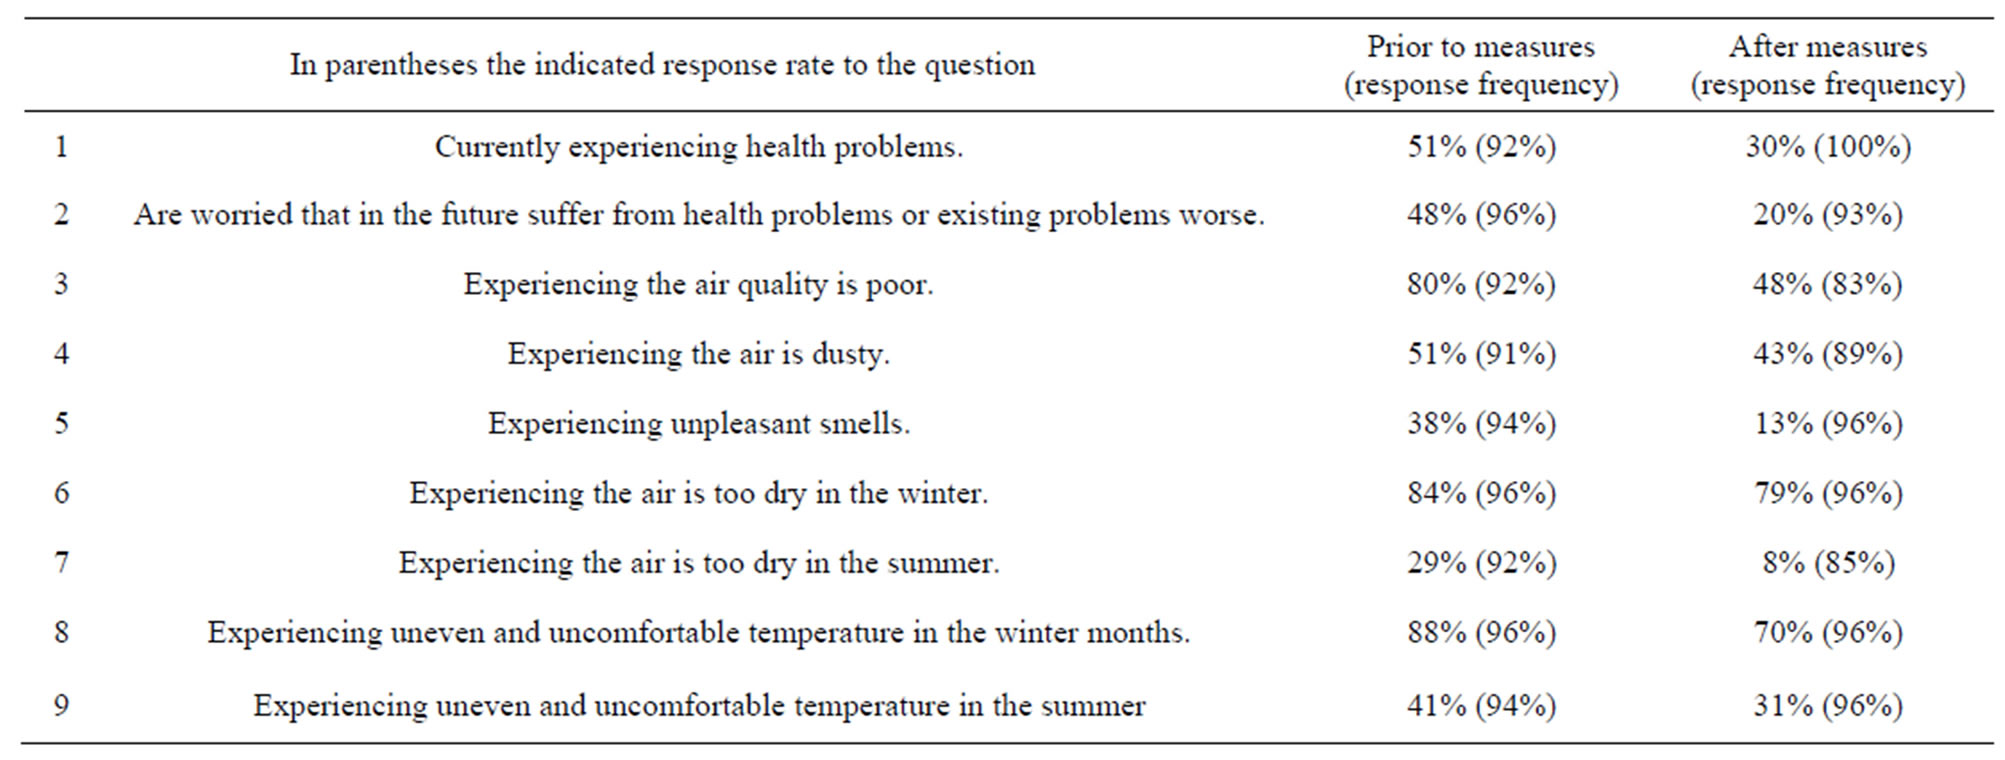
Table 2. The proportion of answers in percent and the response rates for each question prior to and after measures.
in the indoor environment. The emission levels outdoors vary greatly from place to place and between the different intervals. The variations are greatest in the smallest interval 0.3 to 0.5 microns, from a few hundred thousand particles per cubic meter of air up to hundreds of millions. An examination of the major ranges shows that even at the overlying interval 0.5 to 1.0 micron level falls sharply, and from the range of 1.0 micron to be at very modest levels in comparison with the range from 0.3 to 0.5 microns. The sources of air pollution outdoors are what nature gives rise to and, where appropriate, as people expose nature for. The measurement results show that large variations also exist in quality between the air inside and the air outside. In order to obtain better information for the 34 units it’s studied how the particle volume in each interval develops over the entire measurement spectrum, from the range 0.3 up to 10.0 microns, with division 0.3 - 0.5, 0.5 - 1.0, 1.0 - 3.0, 3.0 - 5.0 , 5.0 - 10.0 and >10.0 microns. The graphs in Figure 3 show the emission amount from 0.3 microns, in the open interval and the graphs of Figure 4 show the emission amount in each interval. Similarly the graphs from the range of 1.0 micron are shown in Figures 5 and 6. In Figure 6, it is apparent, because of the different scales, the emission load increases in the larger intervals than in Figure 4.
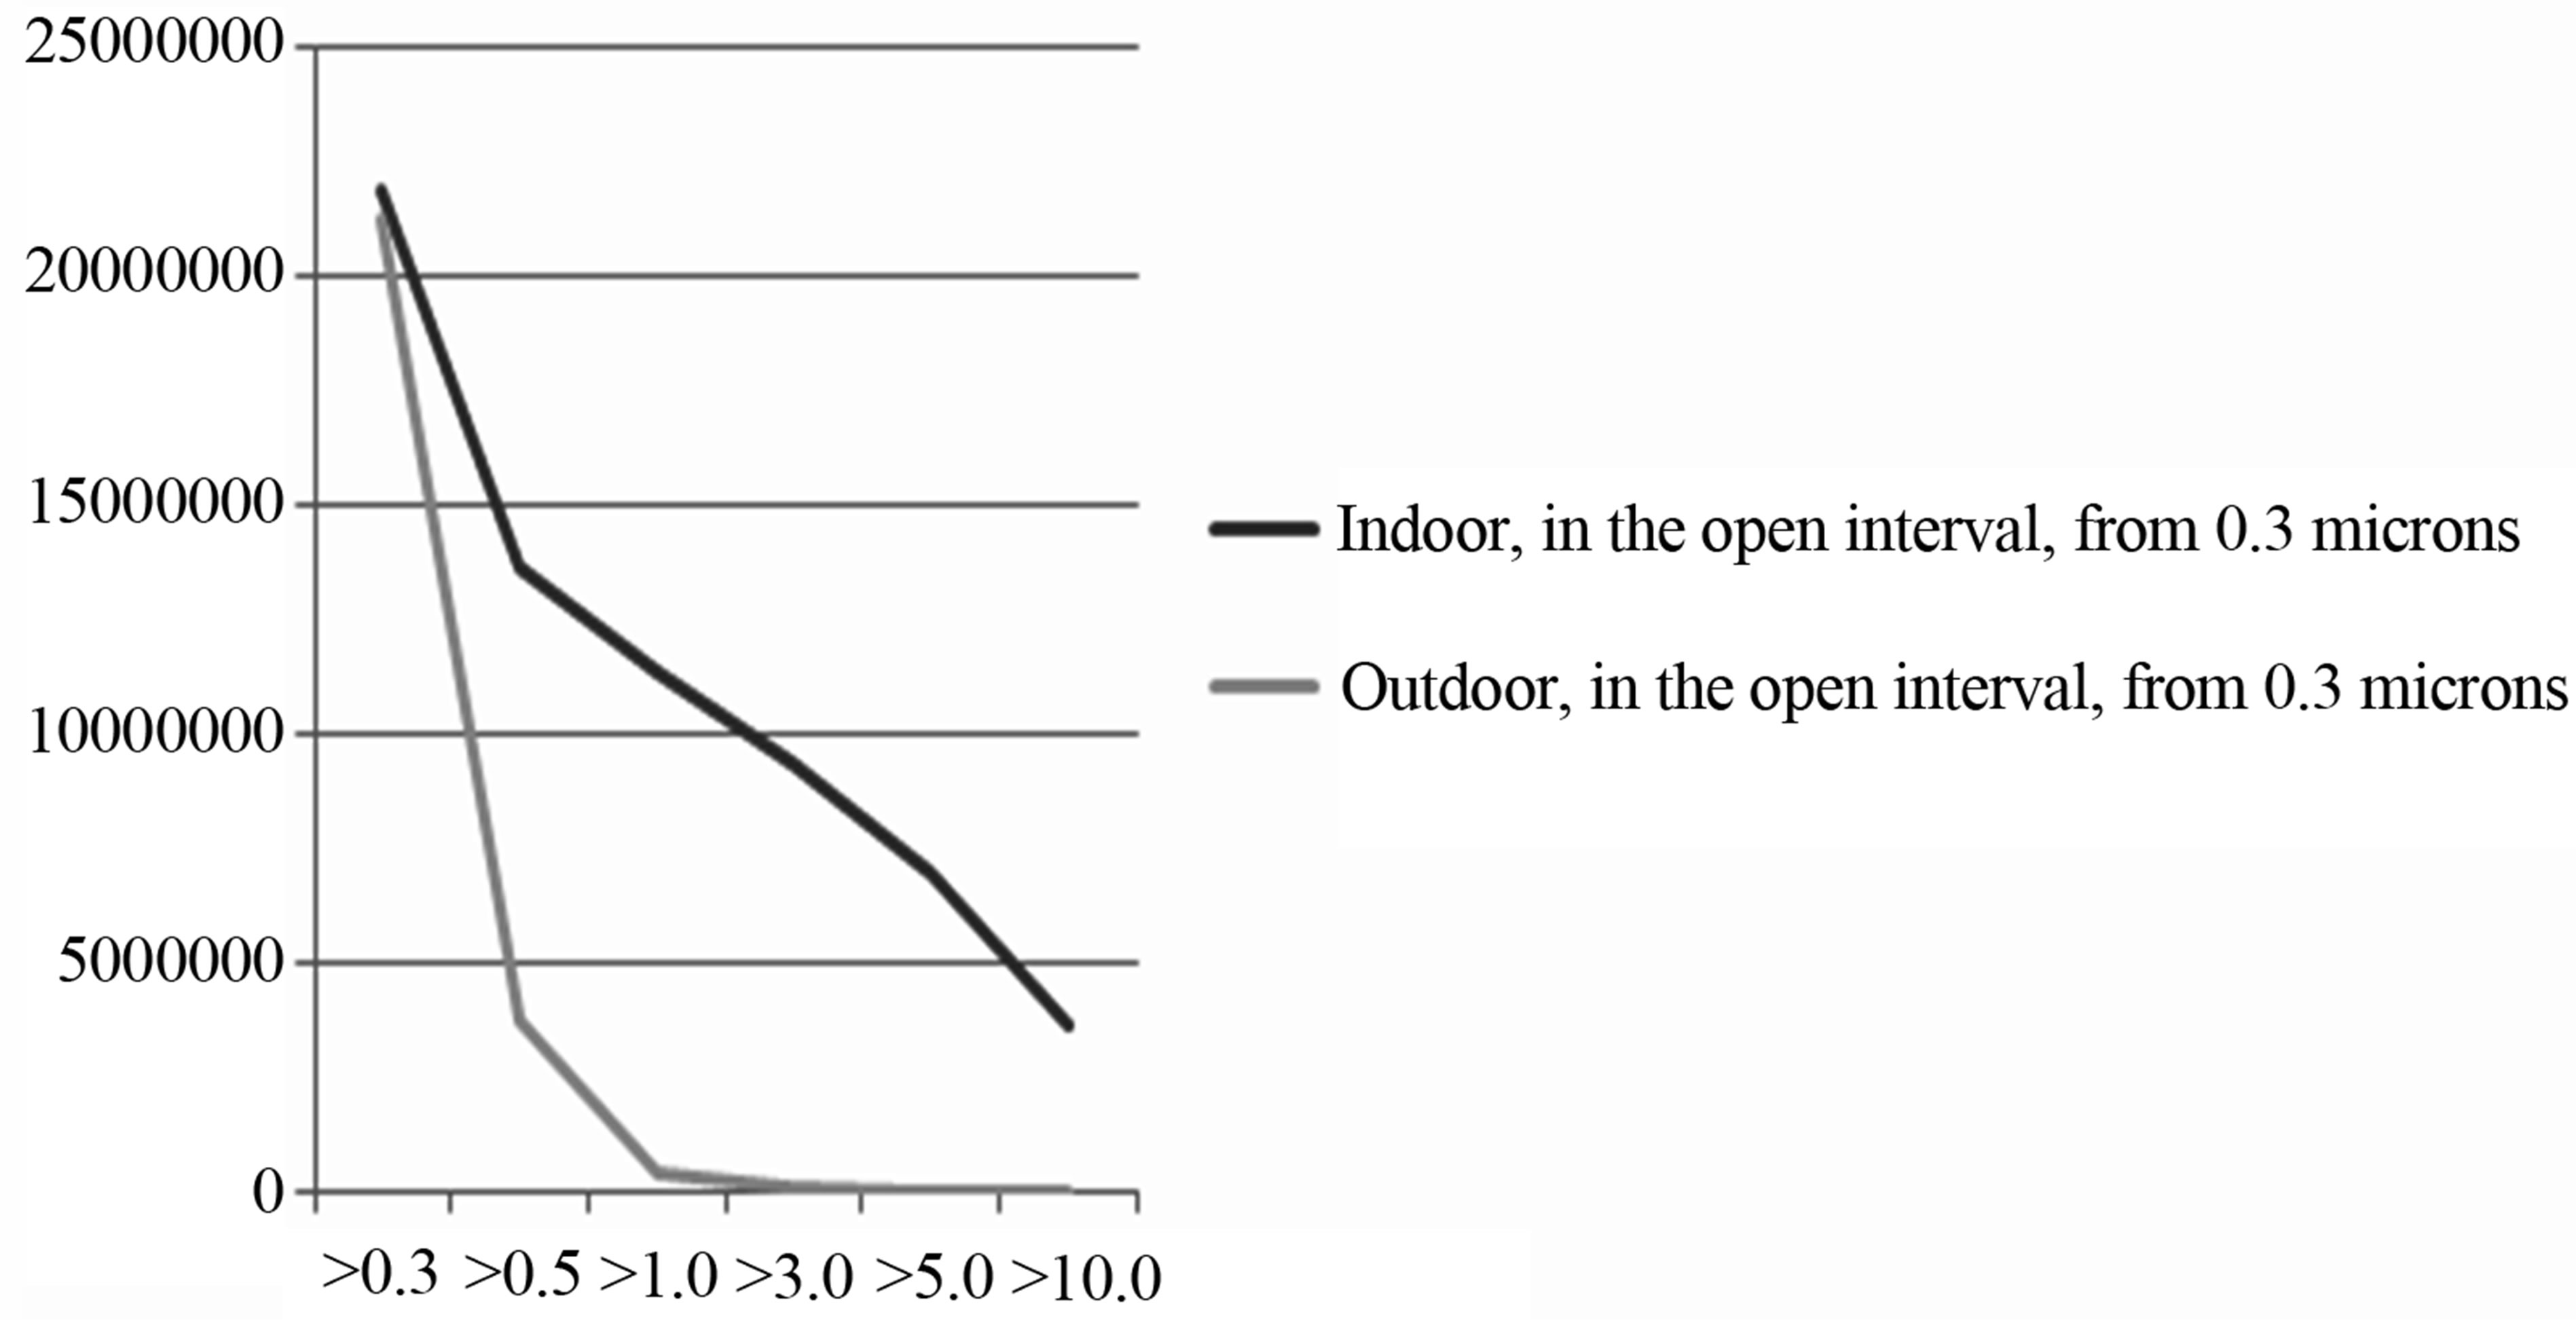
Figure 3. Mean emission levels in 34 schools and preschools. The chart shows the emission amount, the number of particles/m3, where the graphs show emission levels indoor and outdoor, in the open interval from 0.3 microns.
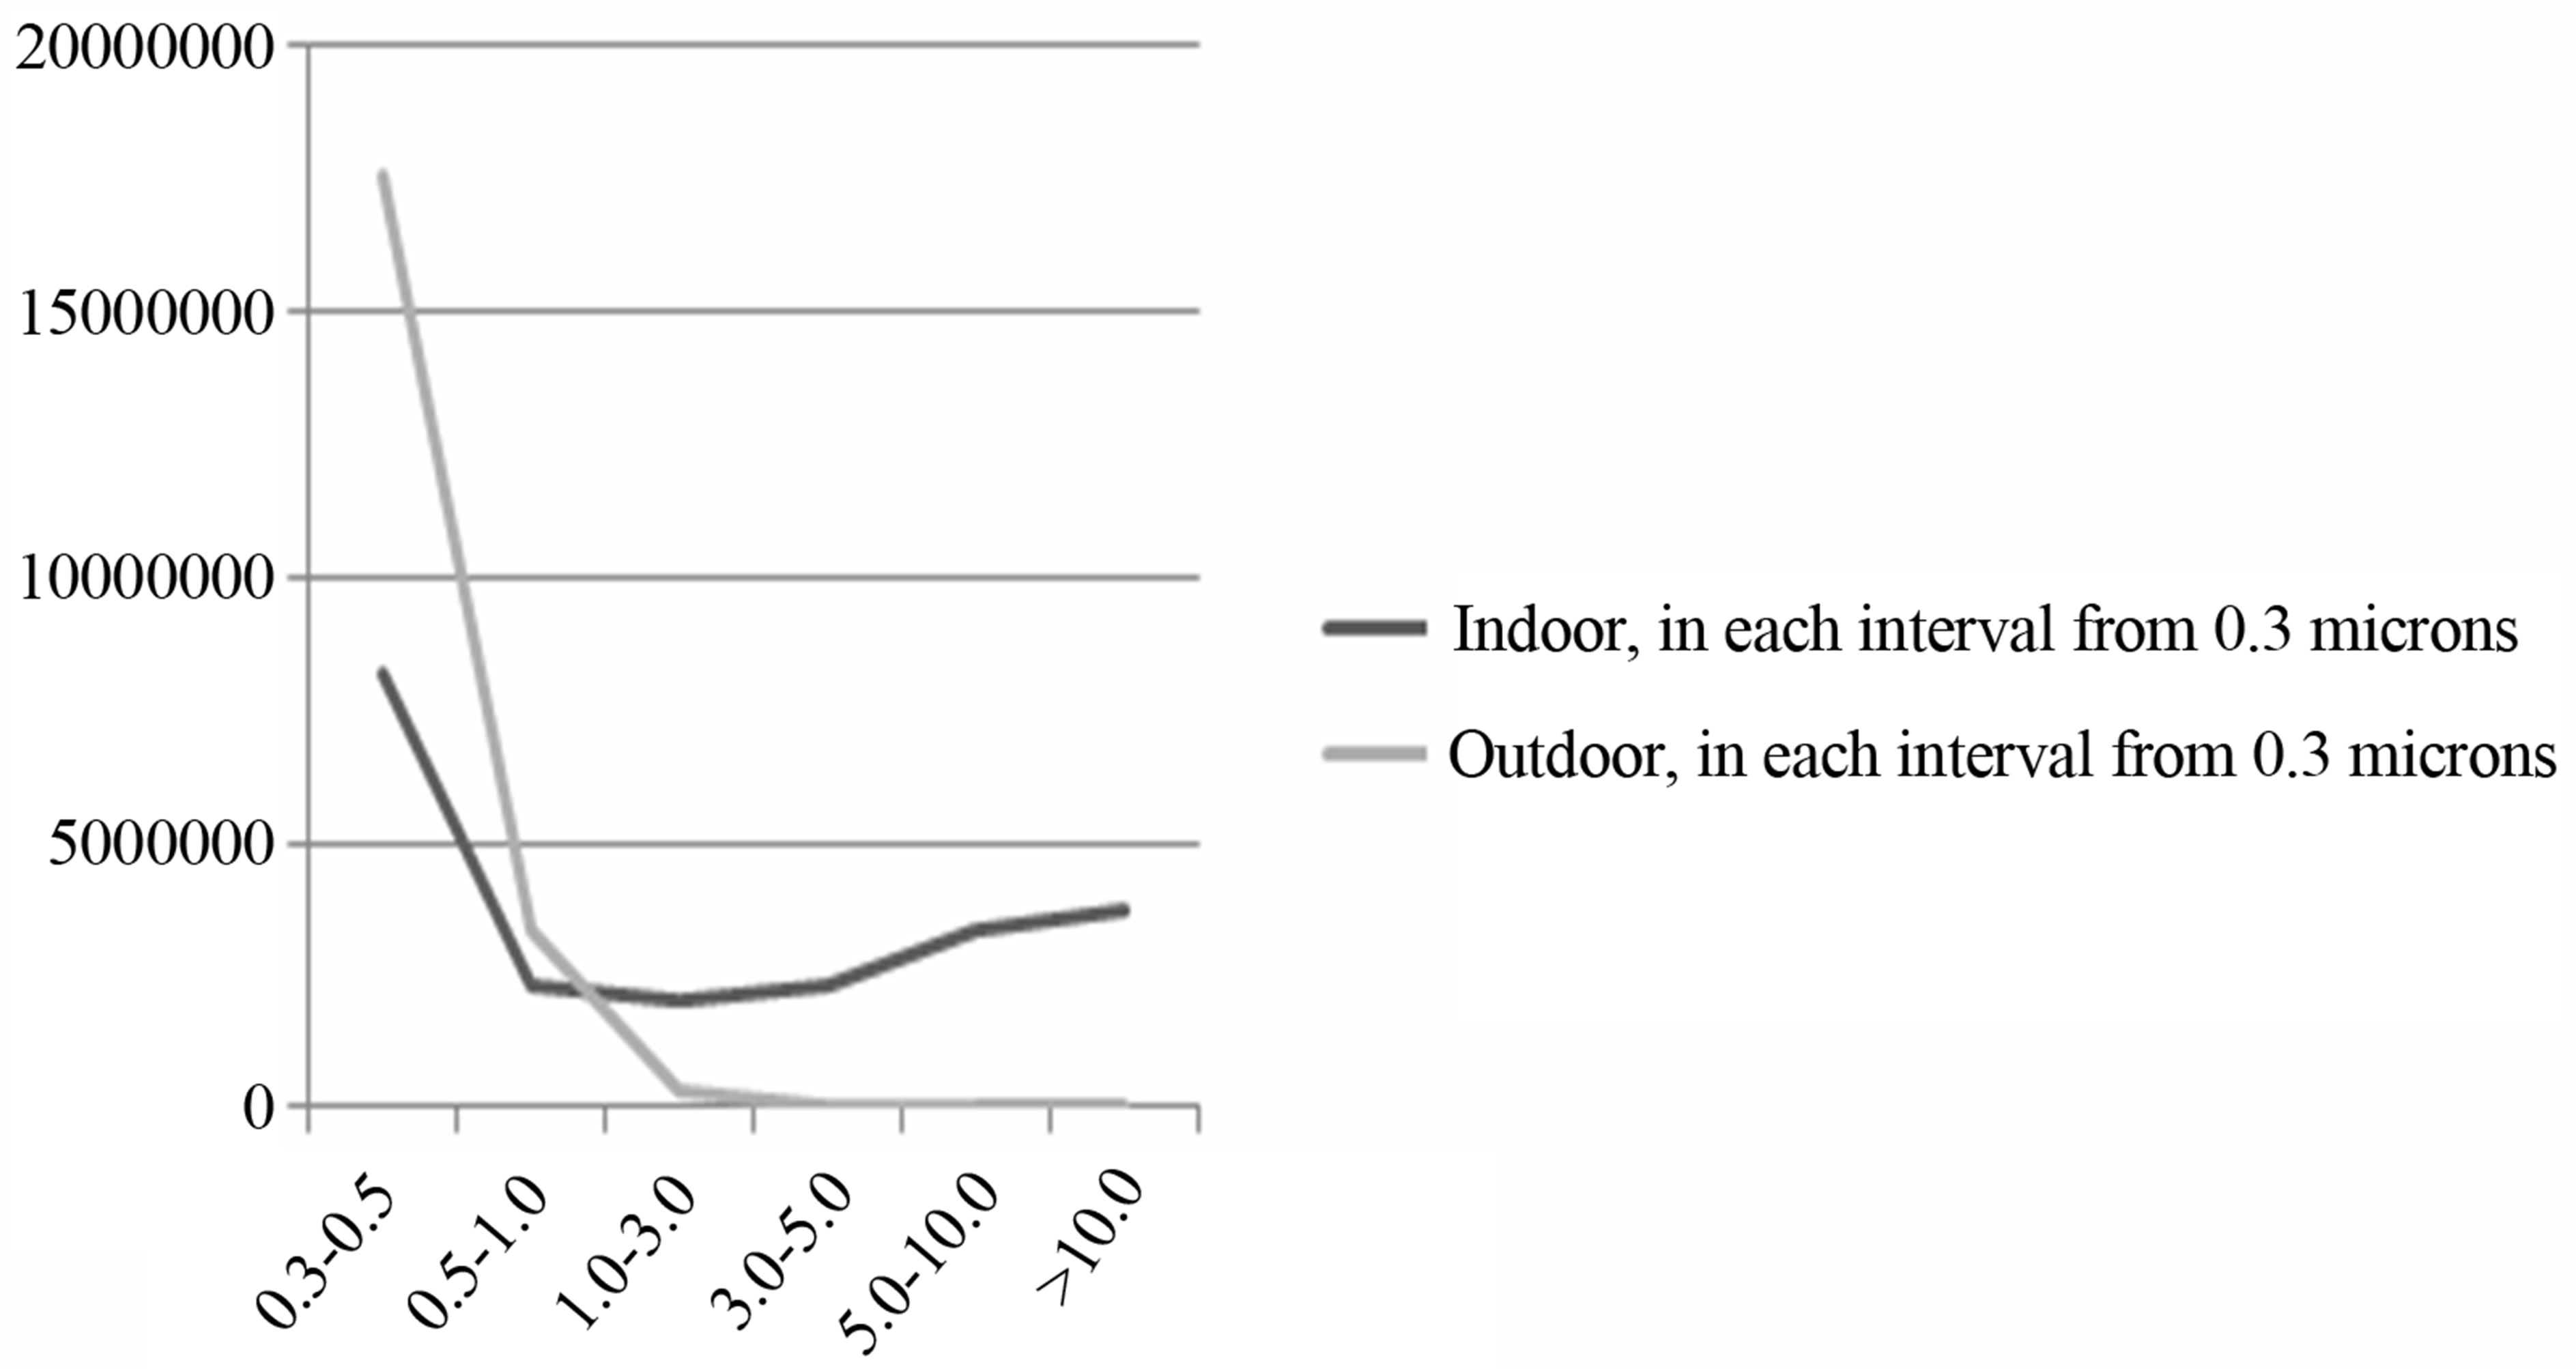
Figure 4. Mean emission levels in 34 schools and preschools. The chart shows the emission amount, the number of particles/m3, where the graphs show emission levels indoor and outdoor, in each interval from 0.3 microns.
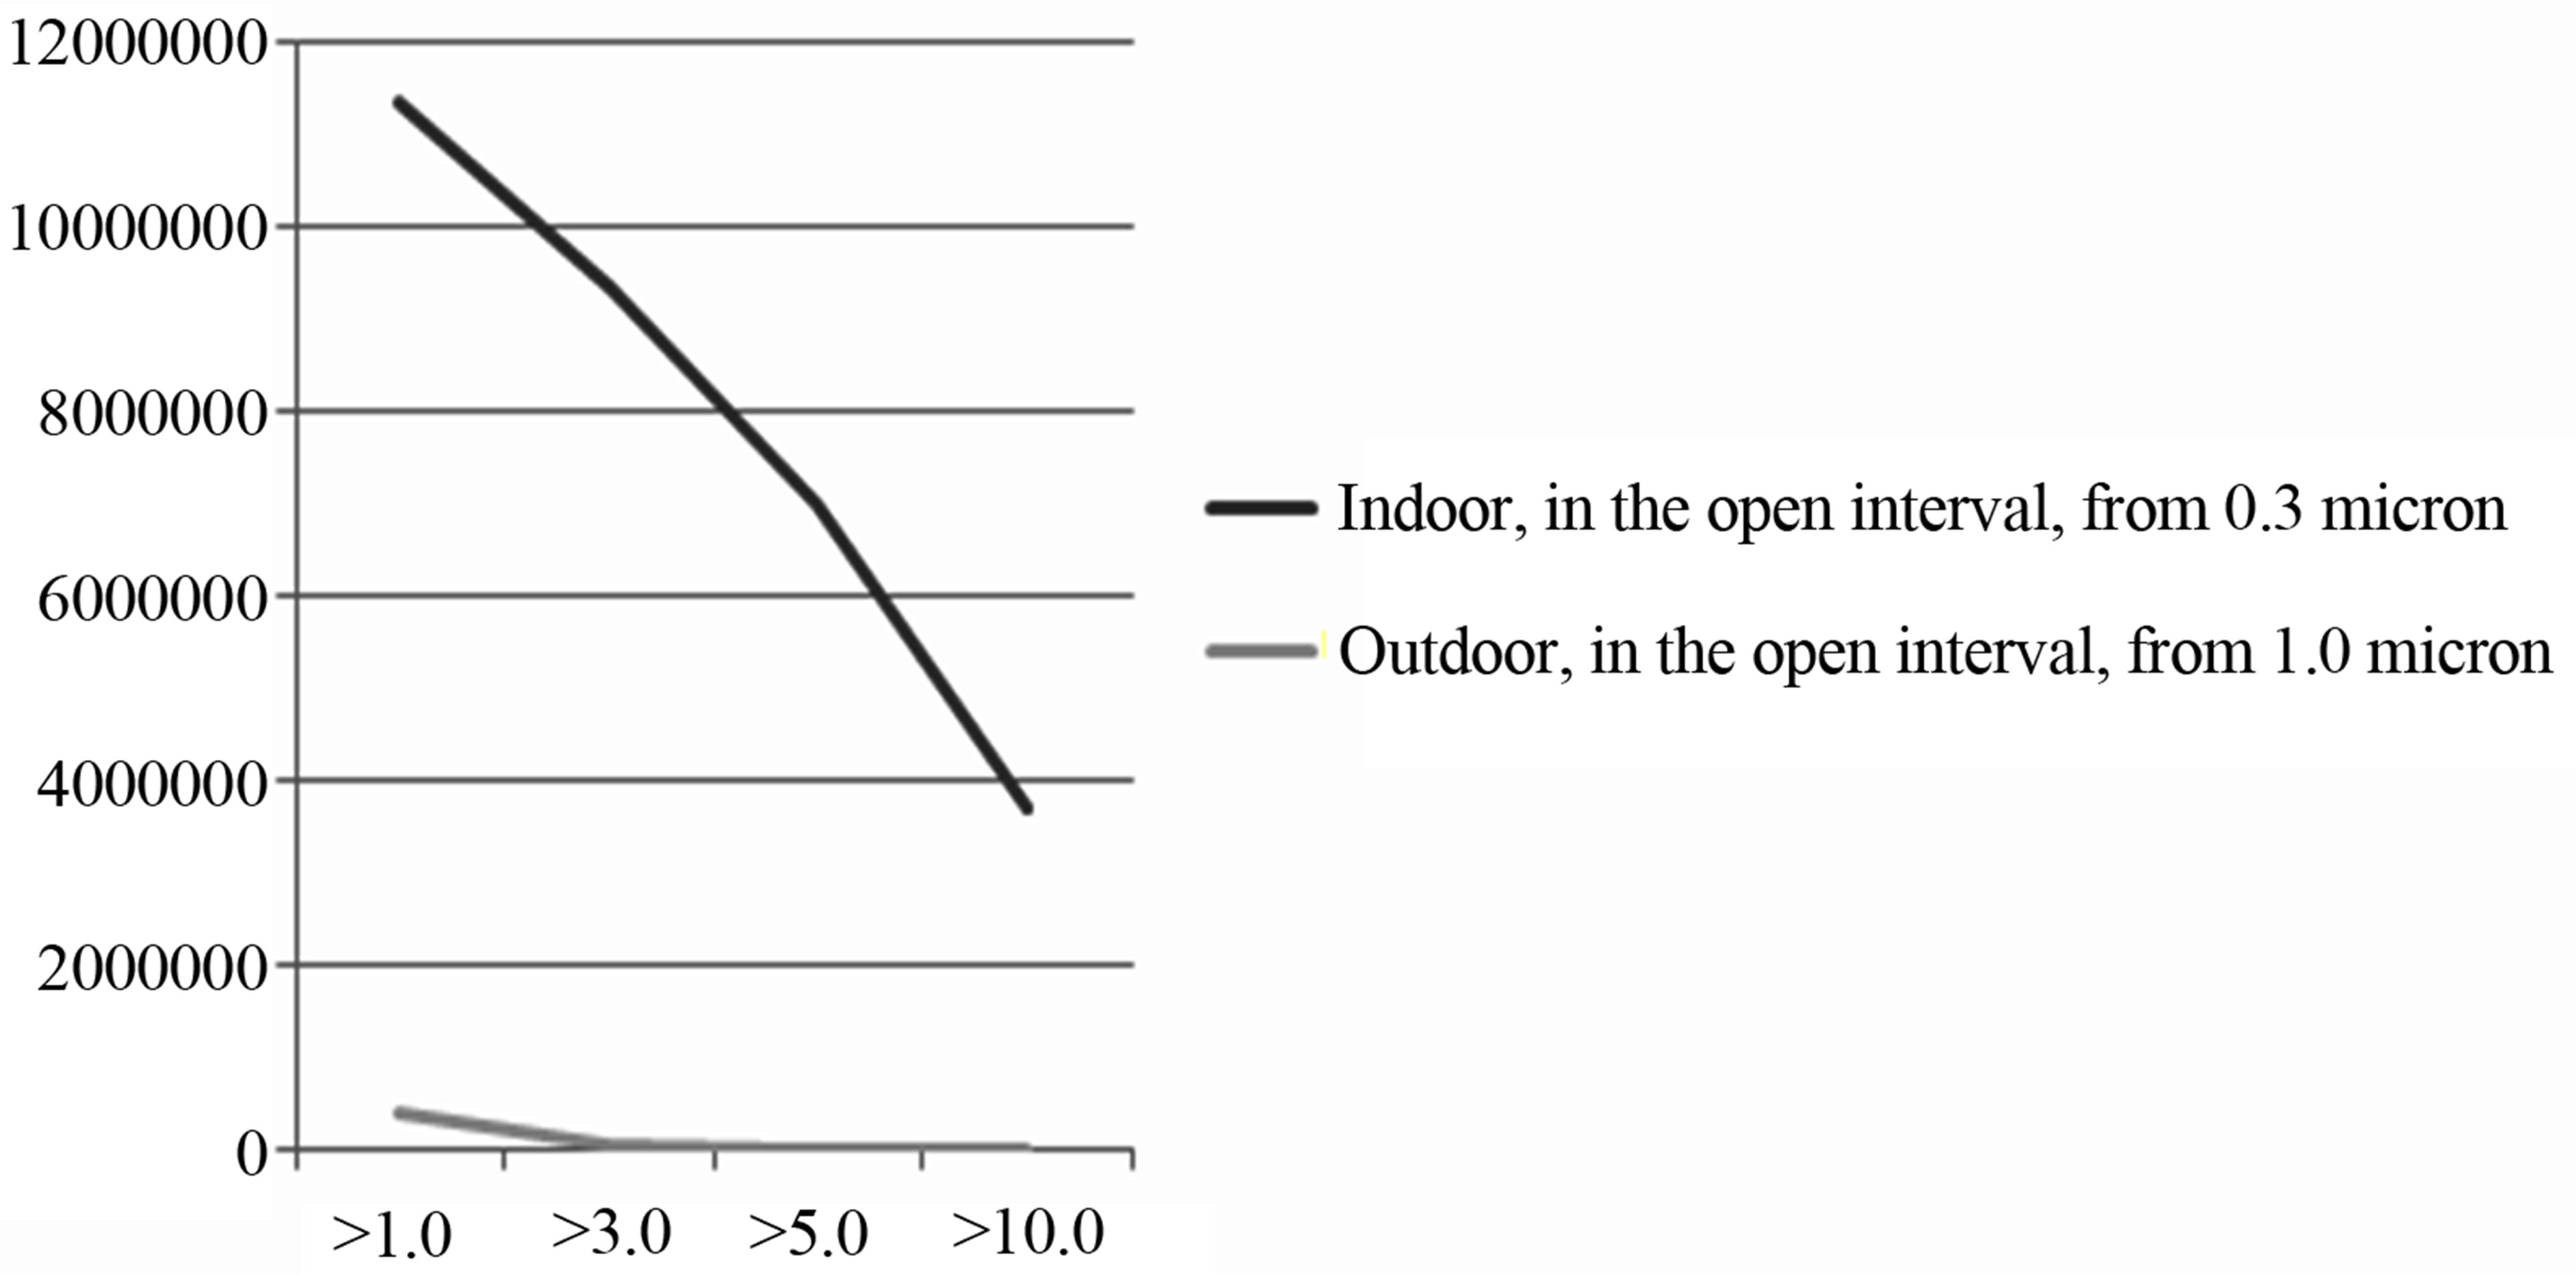
Figure 5. Mean emission levels in 34 schools and preschools. The chart shows the emission amount, the number of particles/m3, where the graphs show emission levels indoor and outdoor, in the open interval from 1.0 micron.
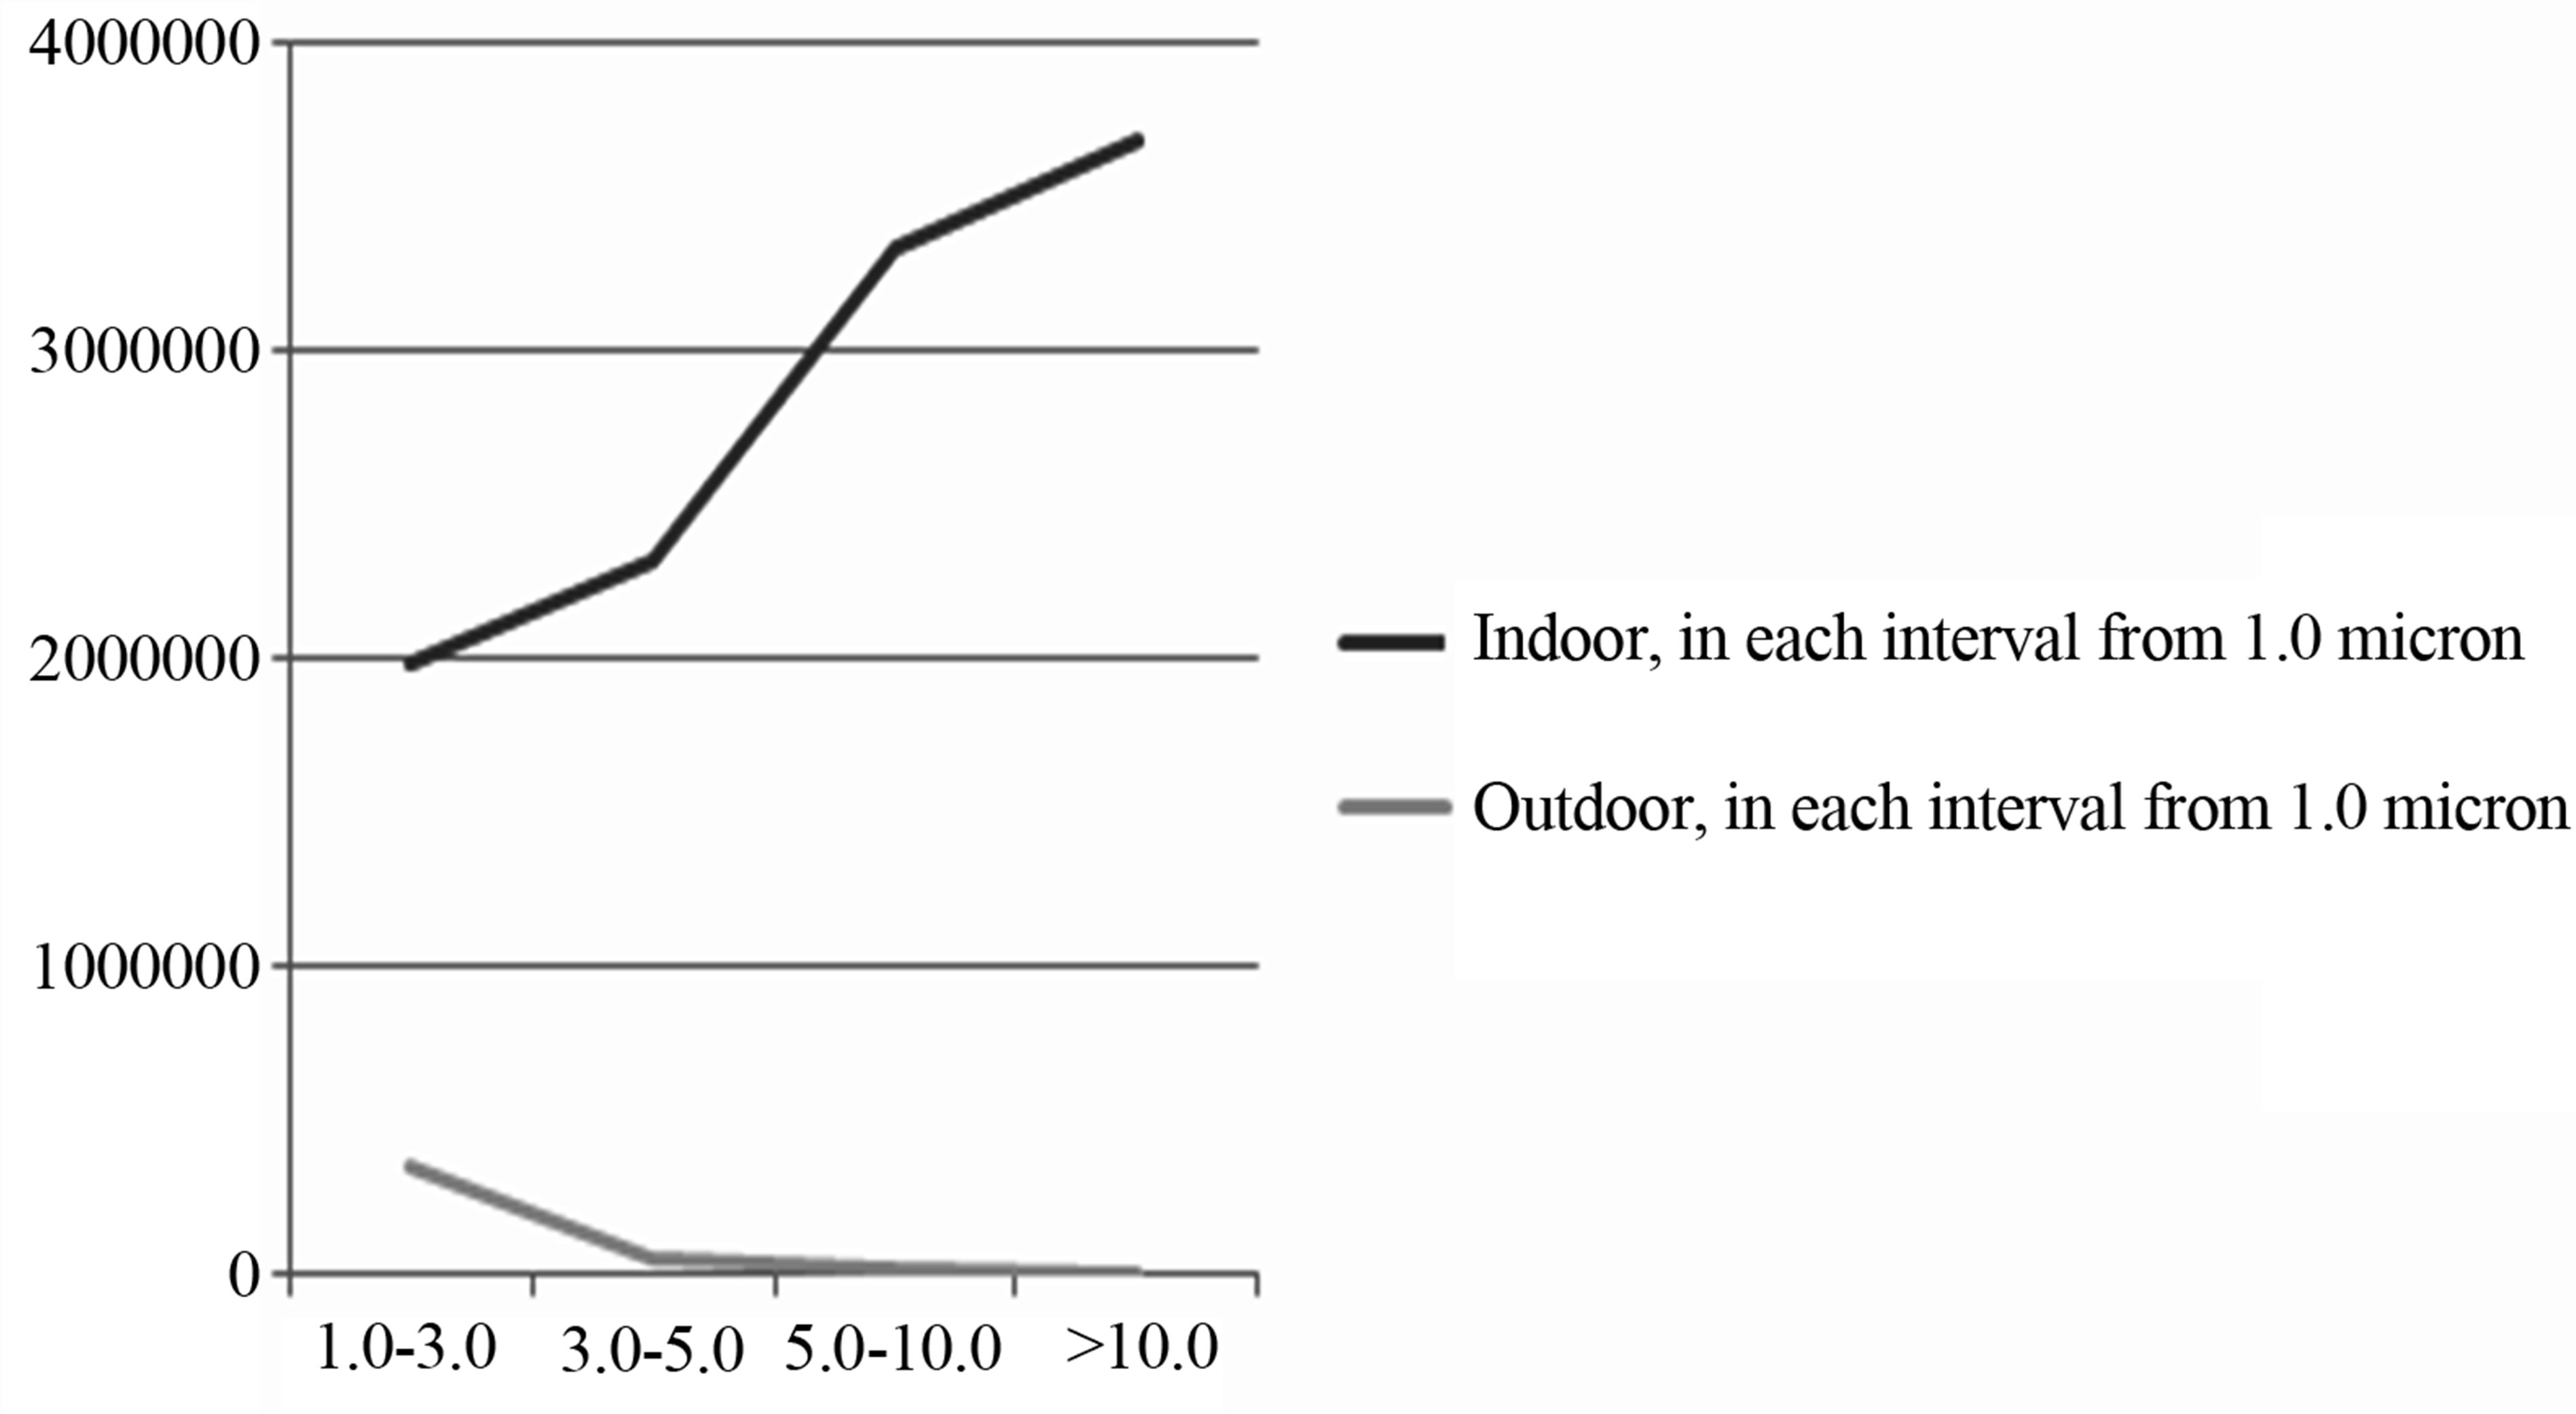
Figure 6. Mean emission levels in 34 schools and preschools. The chart shows the emission amount, the number of particles/m3, where the graphs show emission levels indoor and outdoor, in each interval from 1.0 micron.
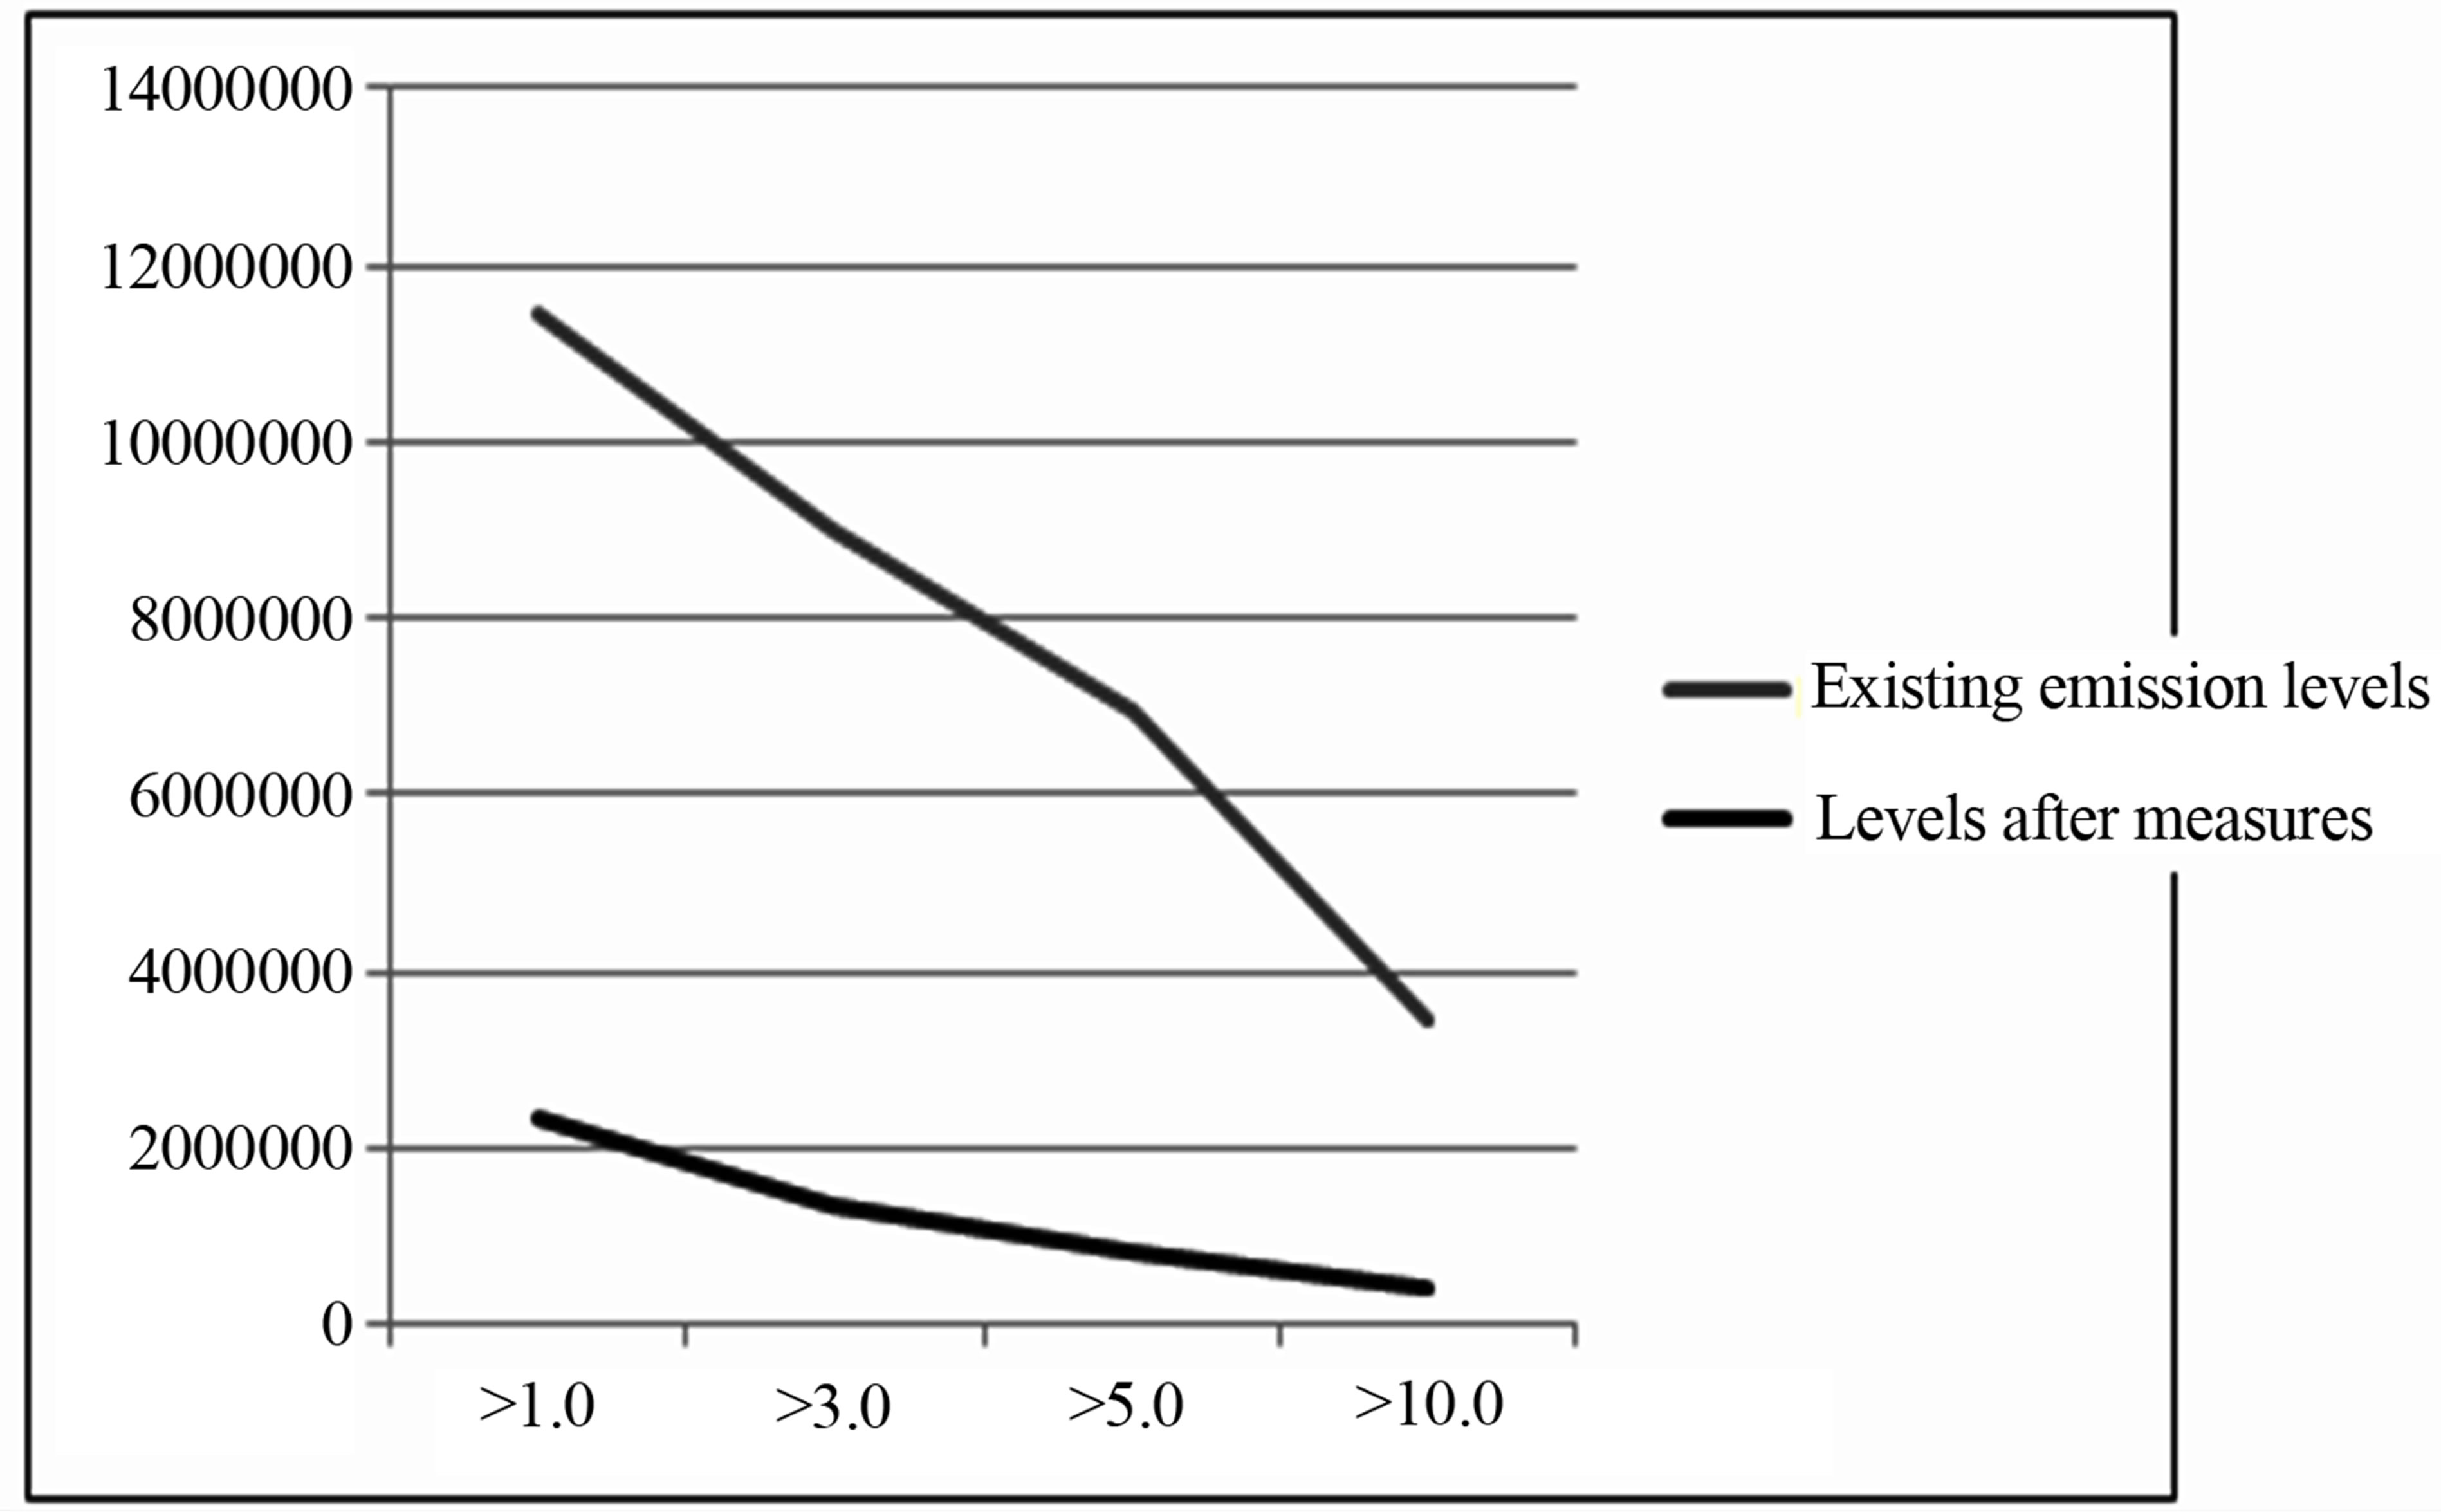
The diagrams in Figures 3-6 show that the difference between the emission amount of outside and inside sharply increases with particle size in the range from 1.0 micron to the disadvantage of the indoor environmental. Outdoor levels are in these ranges modest, while the level indoors has a negative development curve, with several million particles per cubic meter of air in each interval. This shows that the source of air pollution is to be found in the indoor environment. With the intention to reverse this negative trend, 5 of the 34 units have been selected with the aim of reducing the emission load. The graphs of Figures 7-10 show the emission levels for these five units in the same way as Figures 3-6 present the levels for all 34 units. As seen in Figures 7-10 the graphs for the five units follow the same pattern and levels as in Figures 3-6.
This indicates that these five entities constitute a representative sample of Swedish school and preschool environment. When the indoor environment has developed, significant improvements are reported for emission ranges >1.0 micron. The diagrams in Figures 11 and 12 show that all graphs from the indoor environment follow outdoor level graphs better, thus emphasizing the improvement of air quality achieved. It is also reported
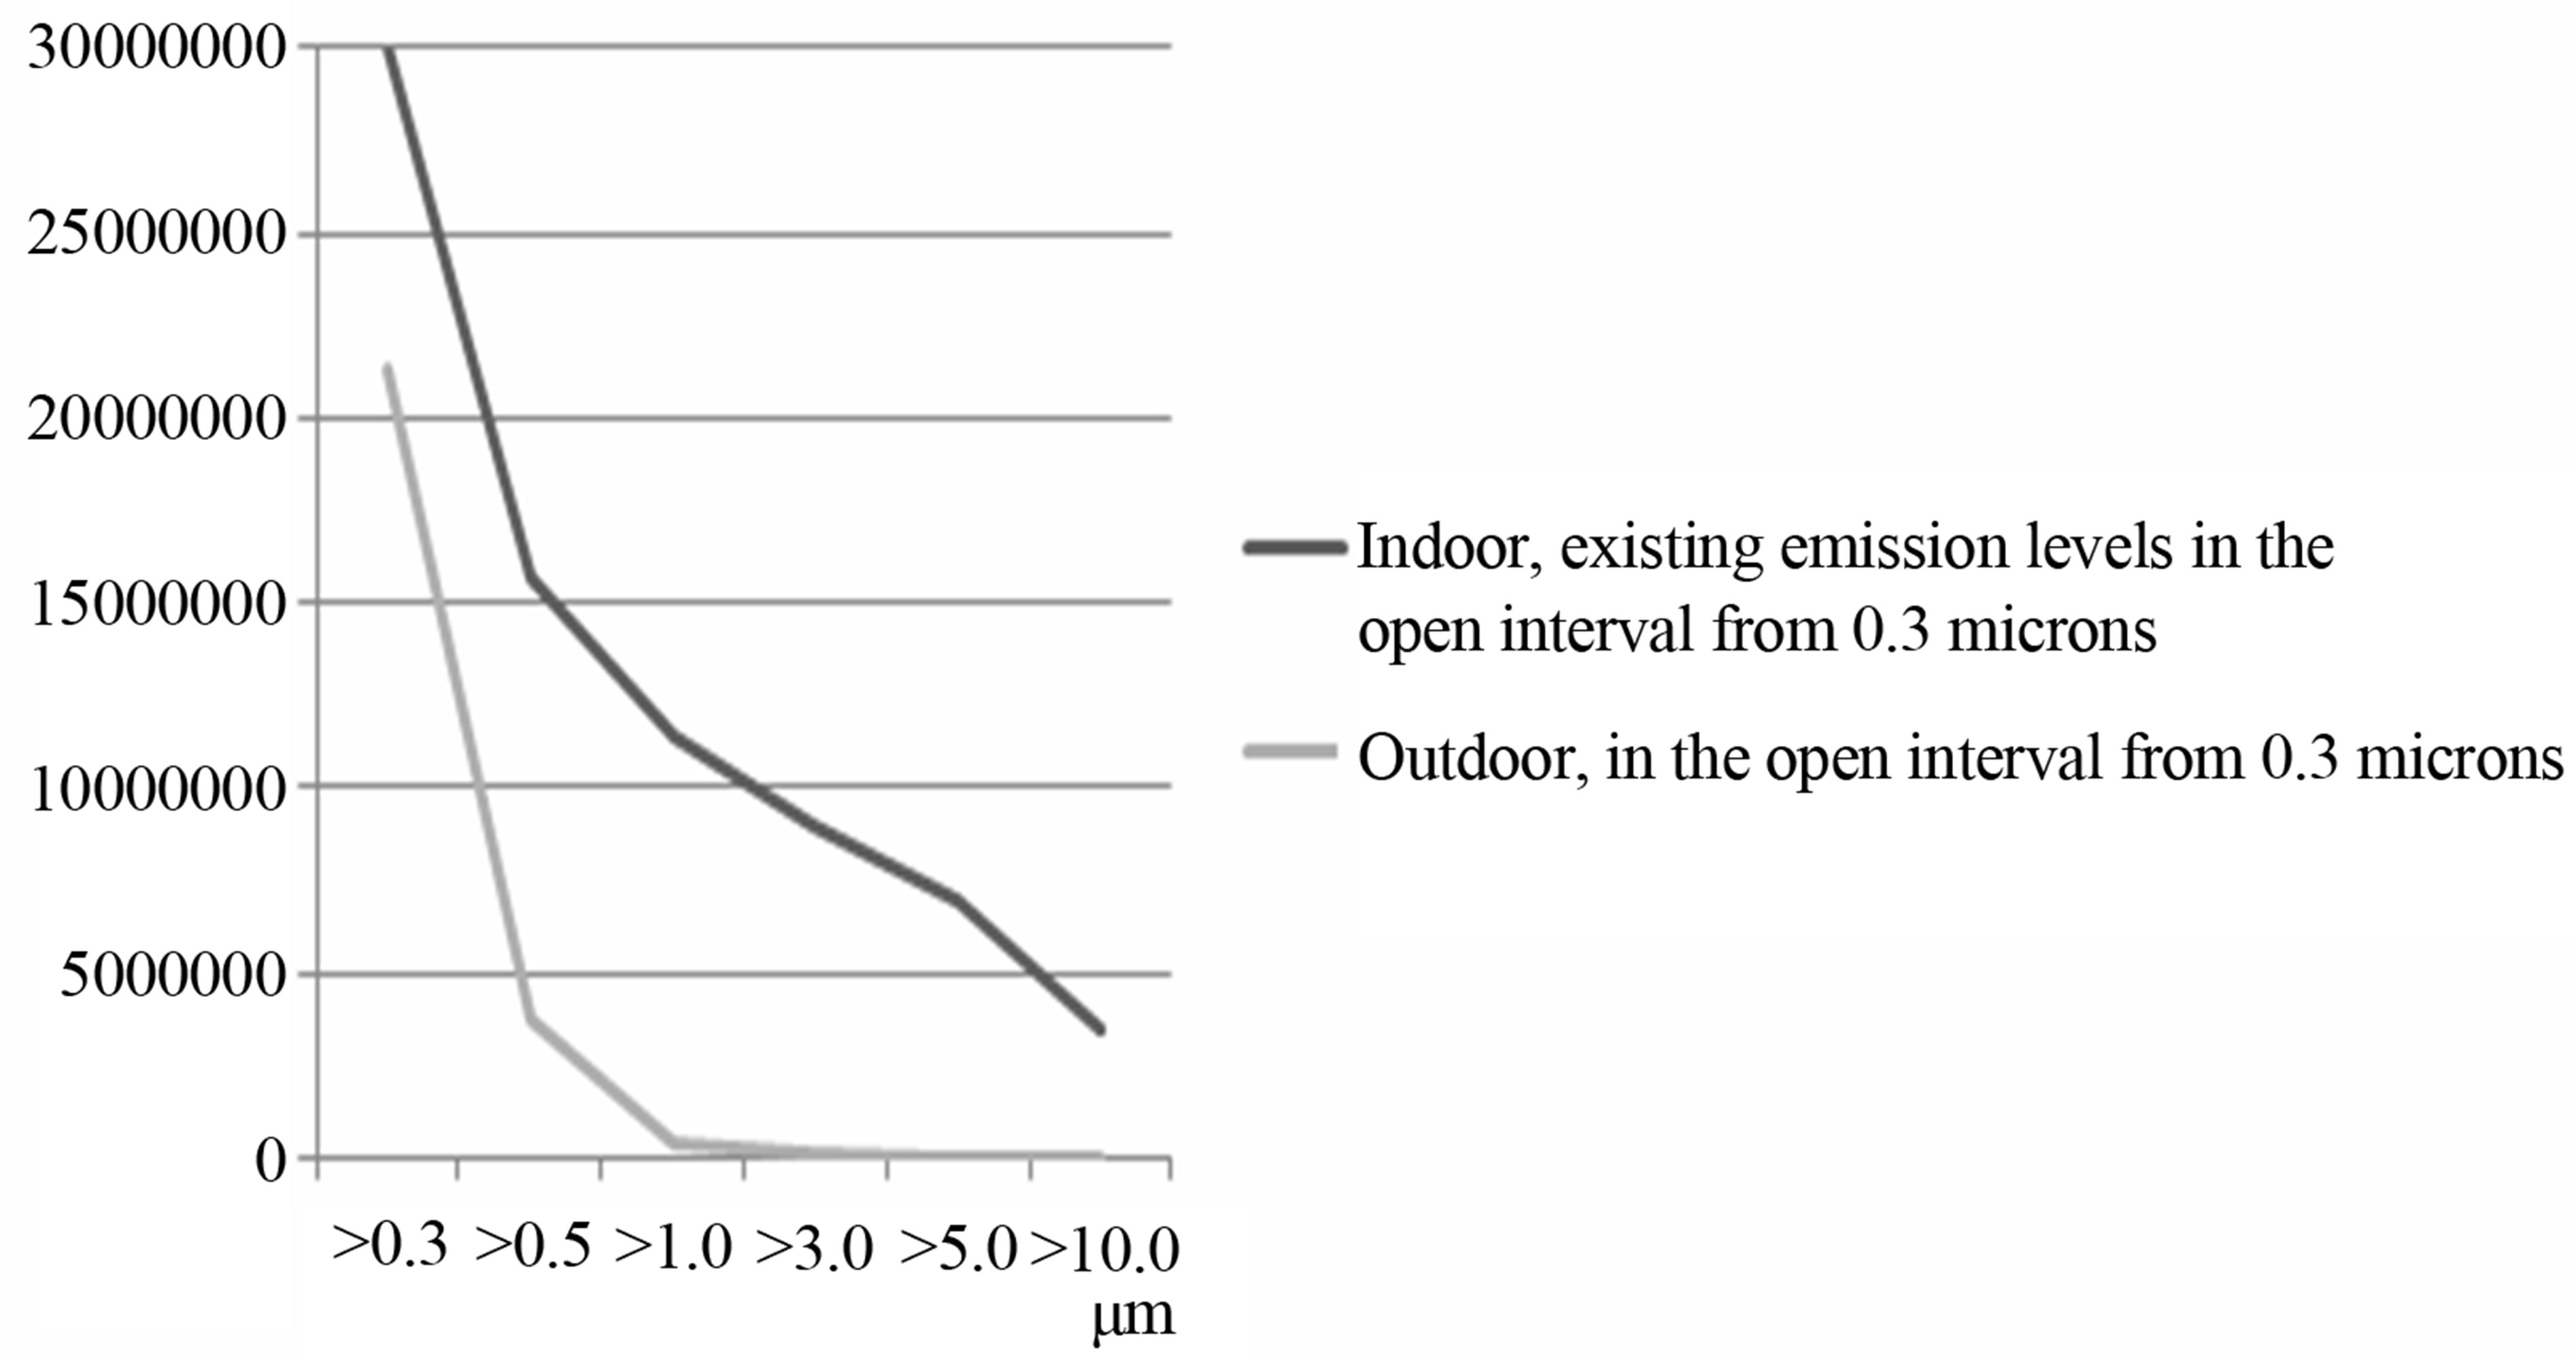
Figure 7. Selected school environments, 5 units, existing emission levels, number of particles/m3, averaged emission quantities where the graphs show emission levels indoor and outdoor, in the open interval from 0.3 microns.
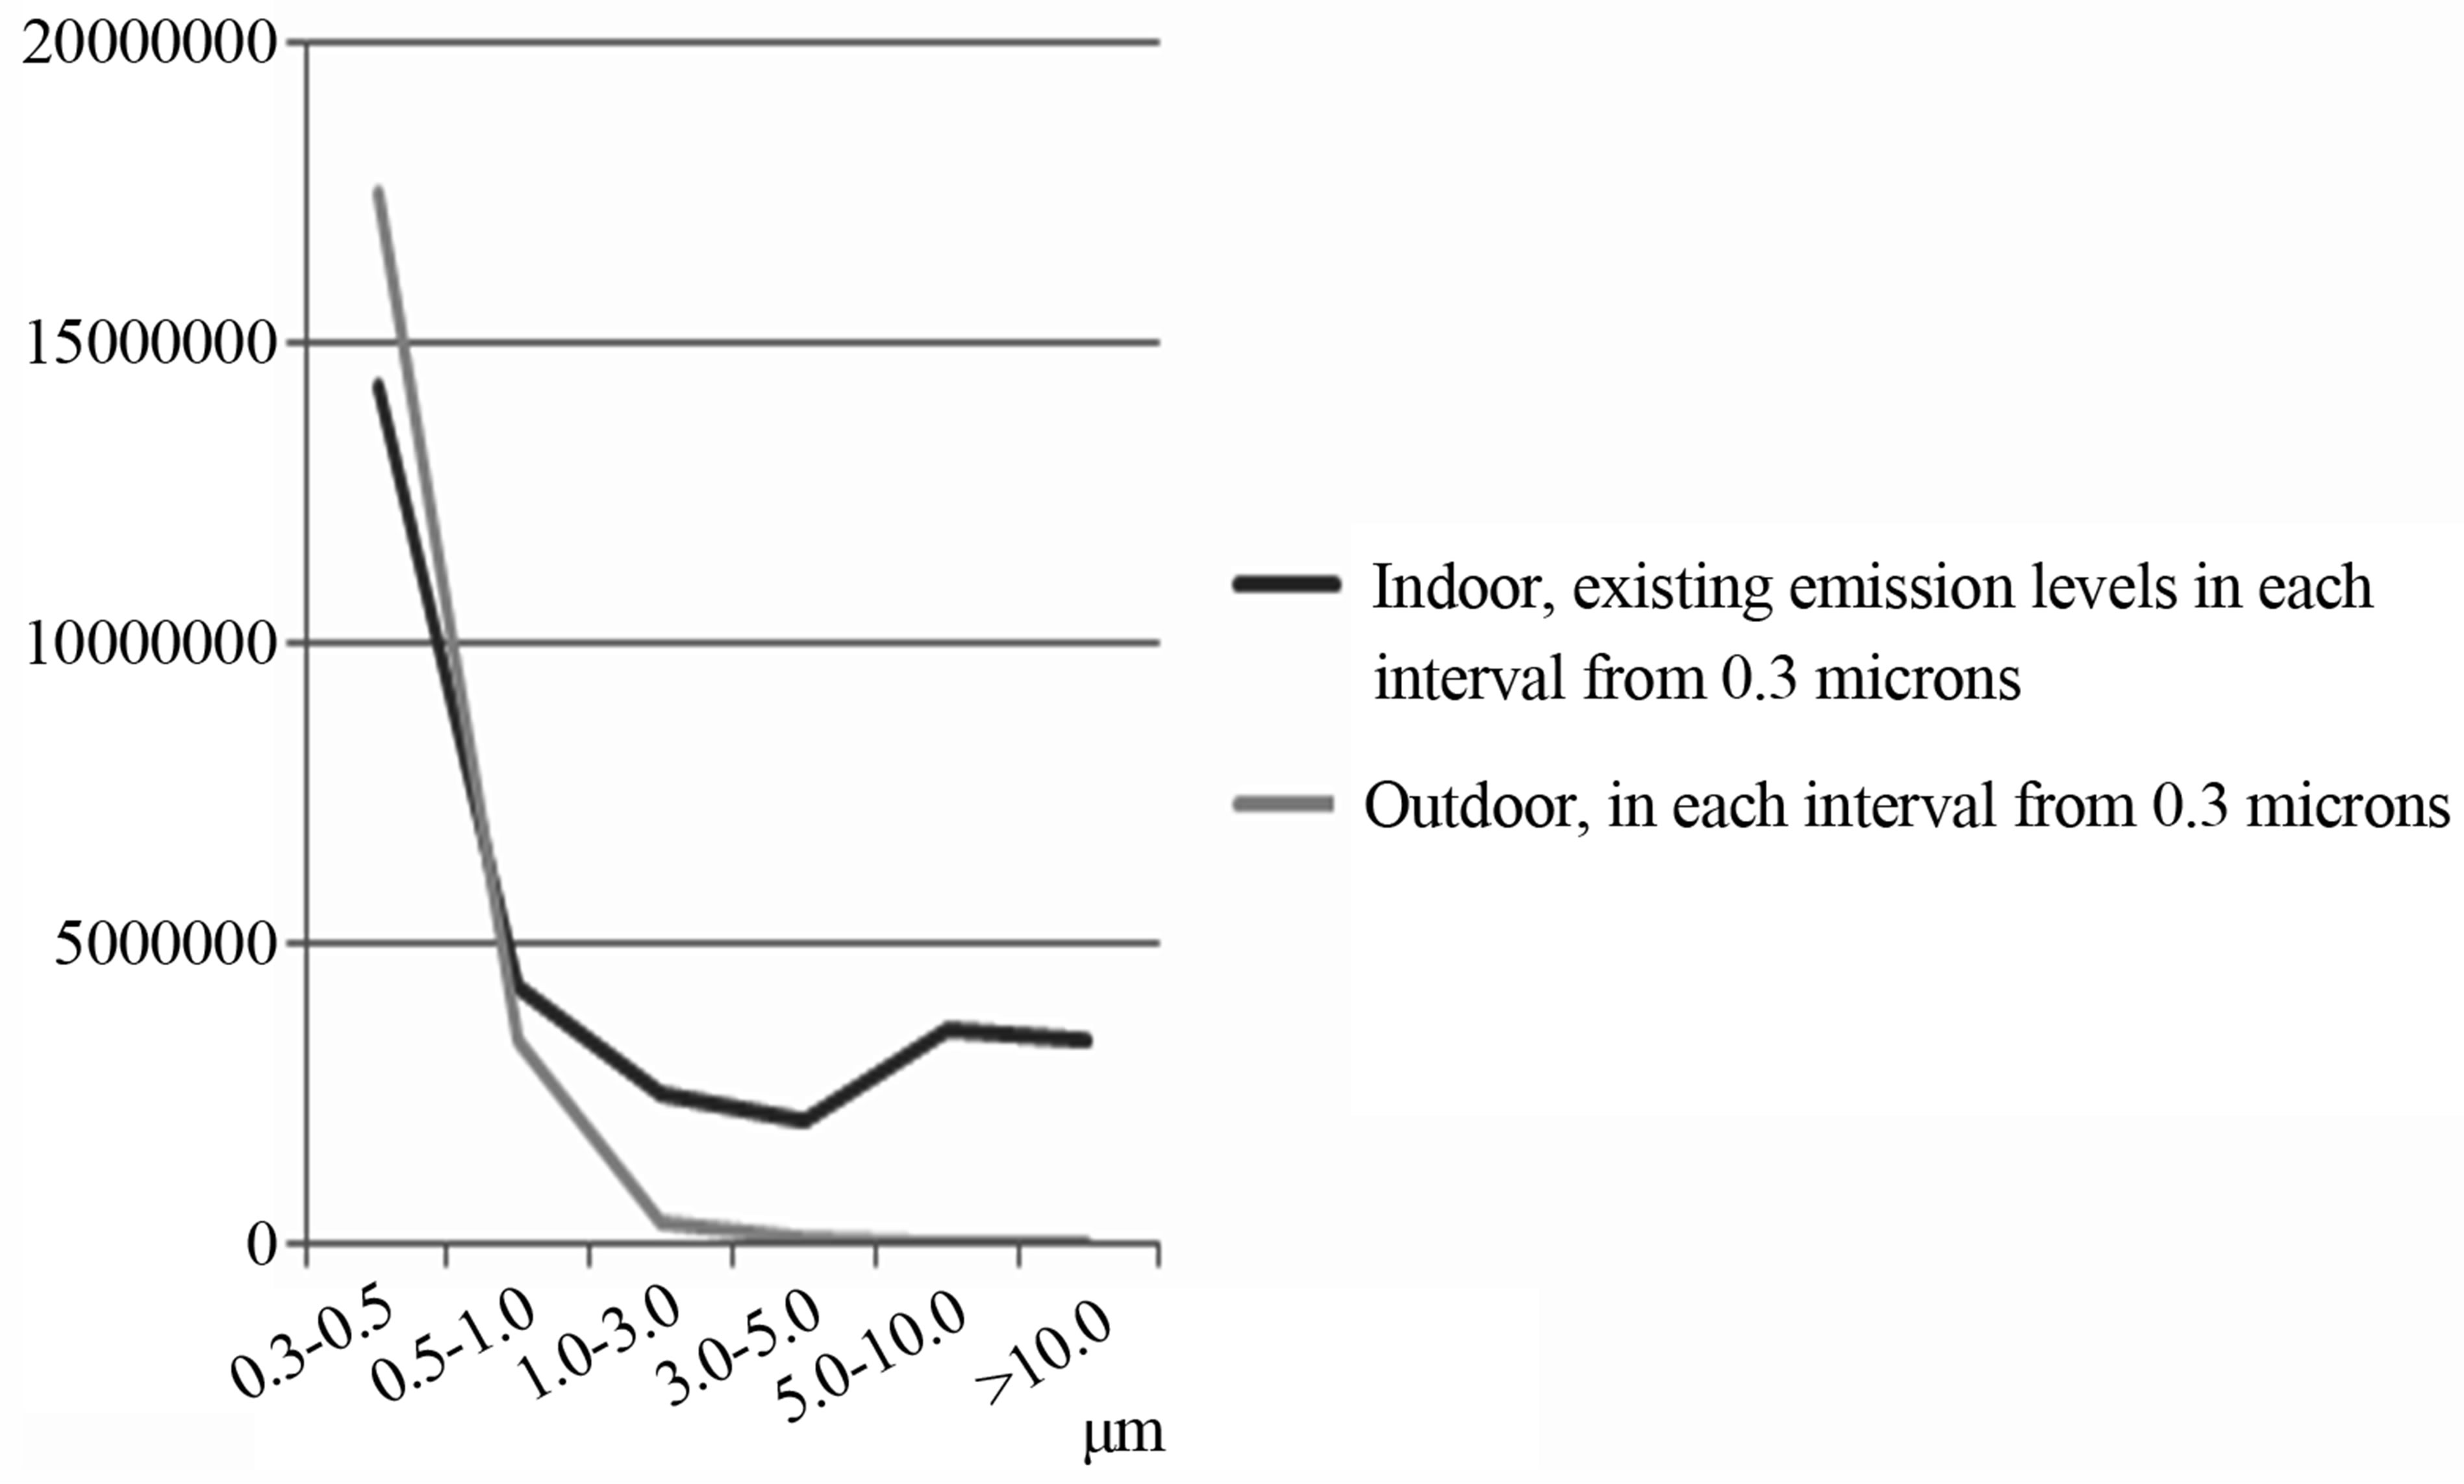
Figure 8. Selected school environments, 5 units, existing emission levels, number of particles/m3, averaged emission quantities where the graphs show emission levels indoor and outdoor, in each interval from 0.3 microns.
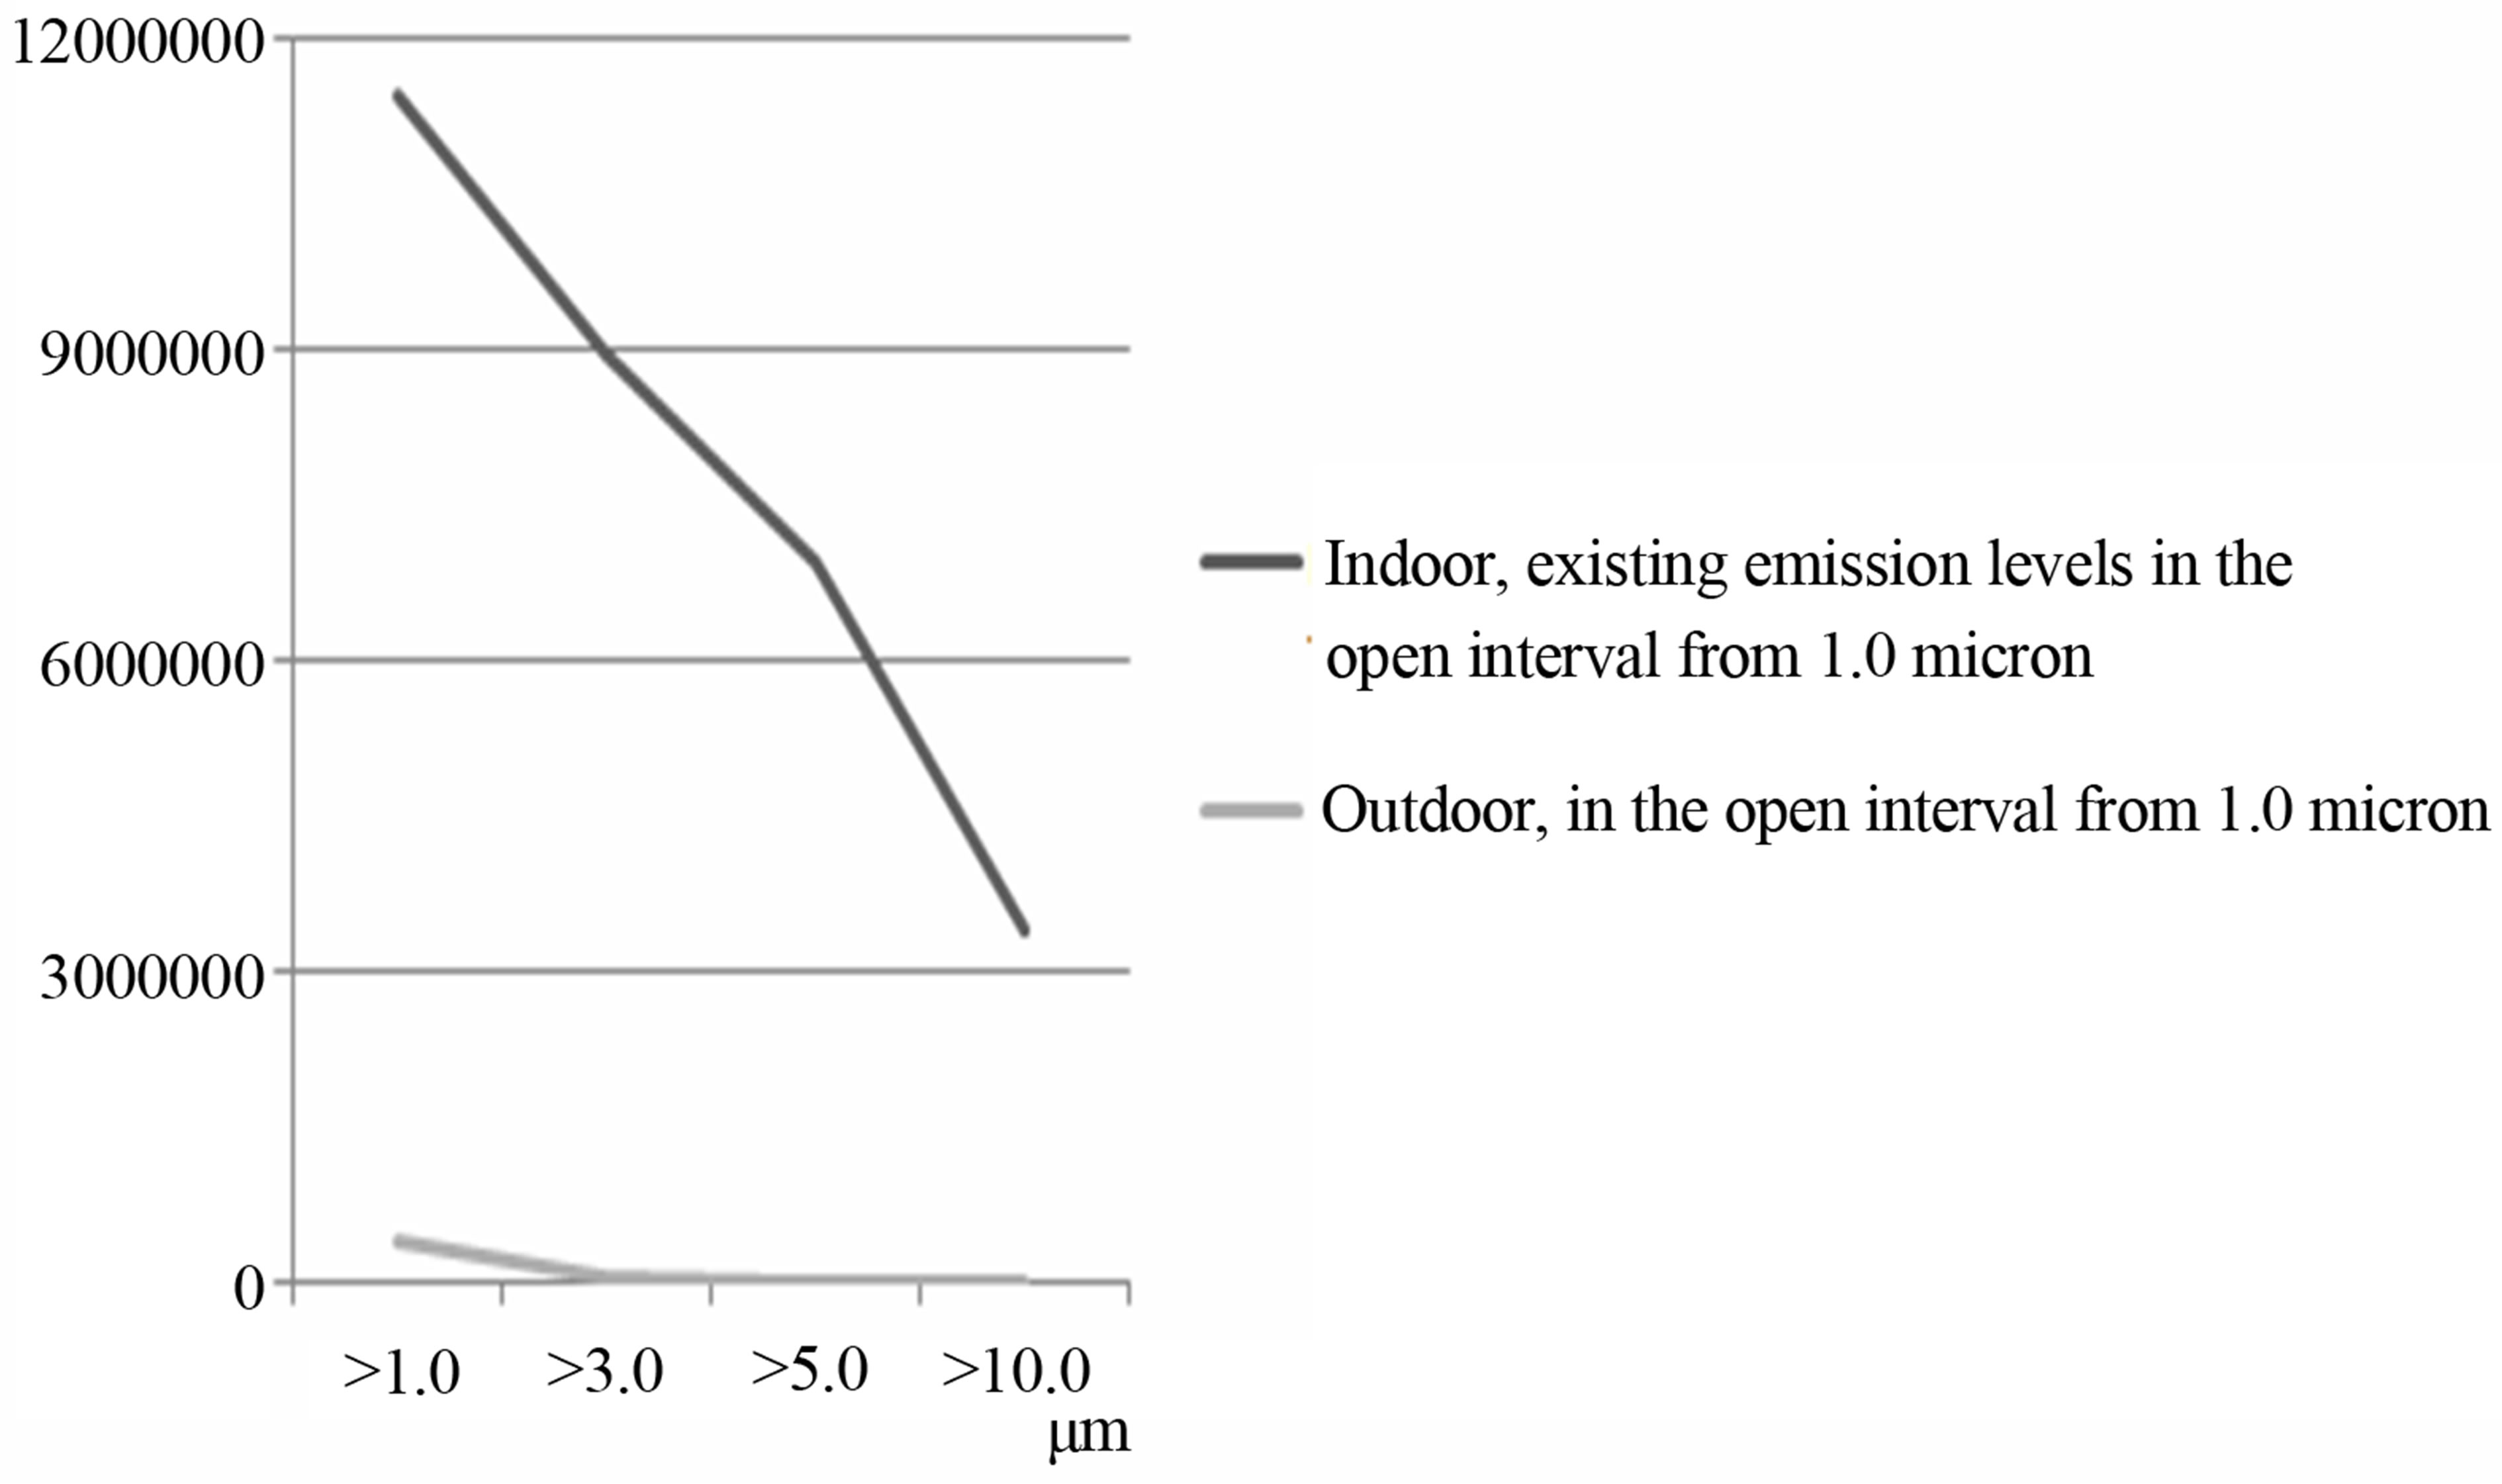
Figure 9. Selected school environments, 5 units, existing emission levels, number of particles/m3, averaged emission quantities where the graphs show emission levels indoor and outdoor, in the open interval from 1.0 micron.
graphically how much emission amount in percentage has decreased in each interval.
There are significant improvements that have been achieved and the negative trend in the emission load in the range from 1.0 micron has been corrected. It appears that the emission load in the Swedish school environments increases with the size of the particle from the
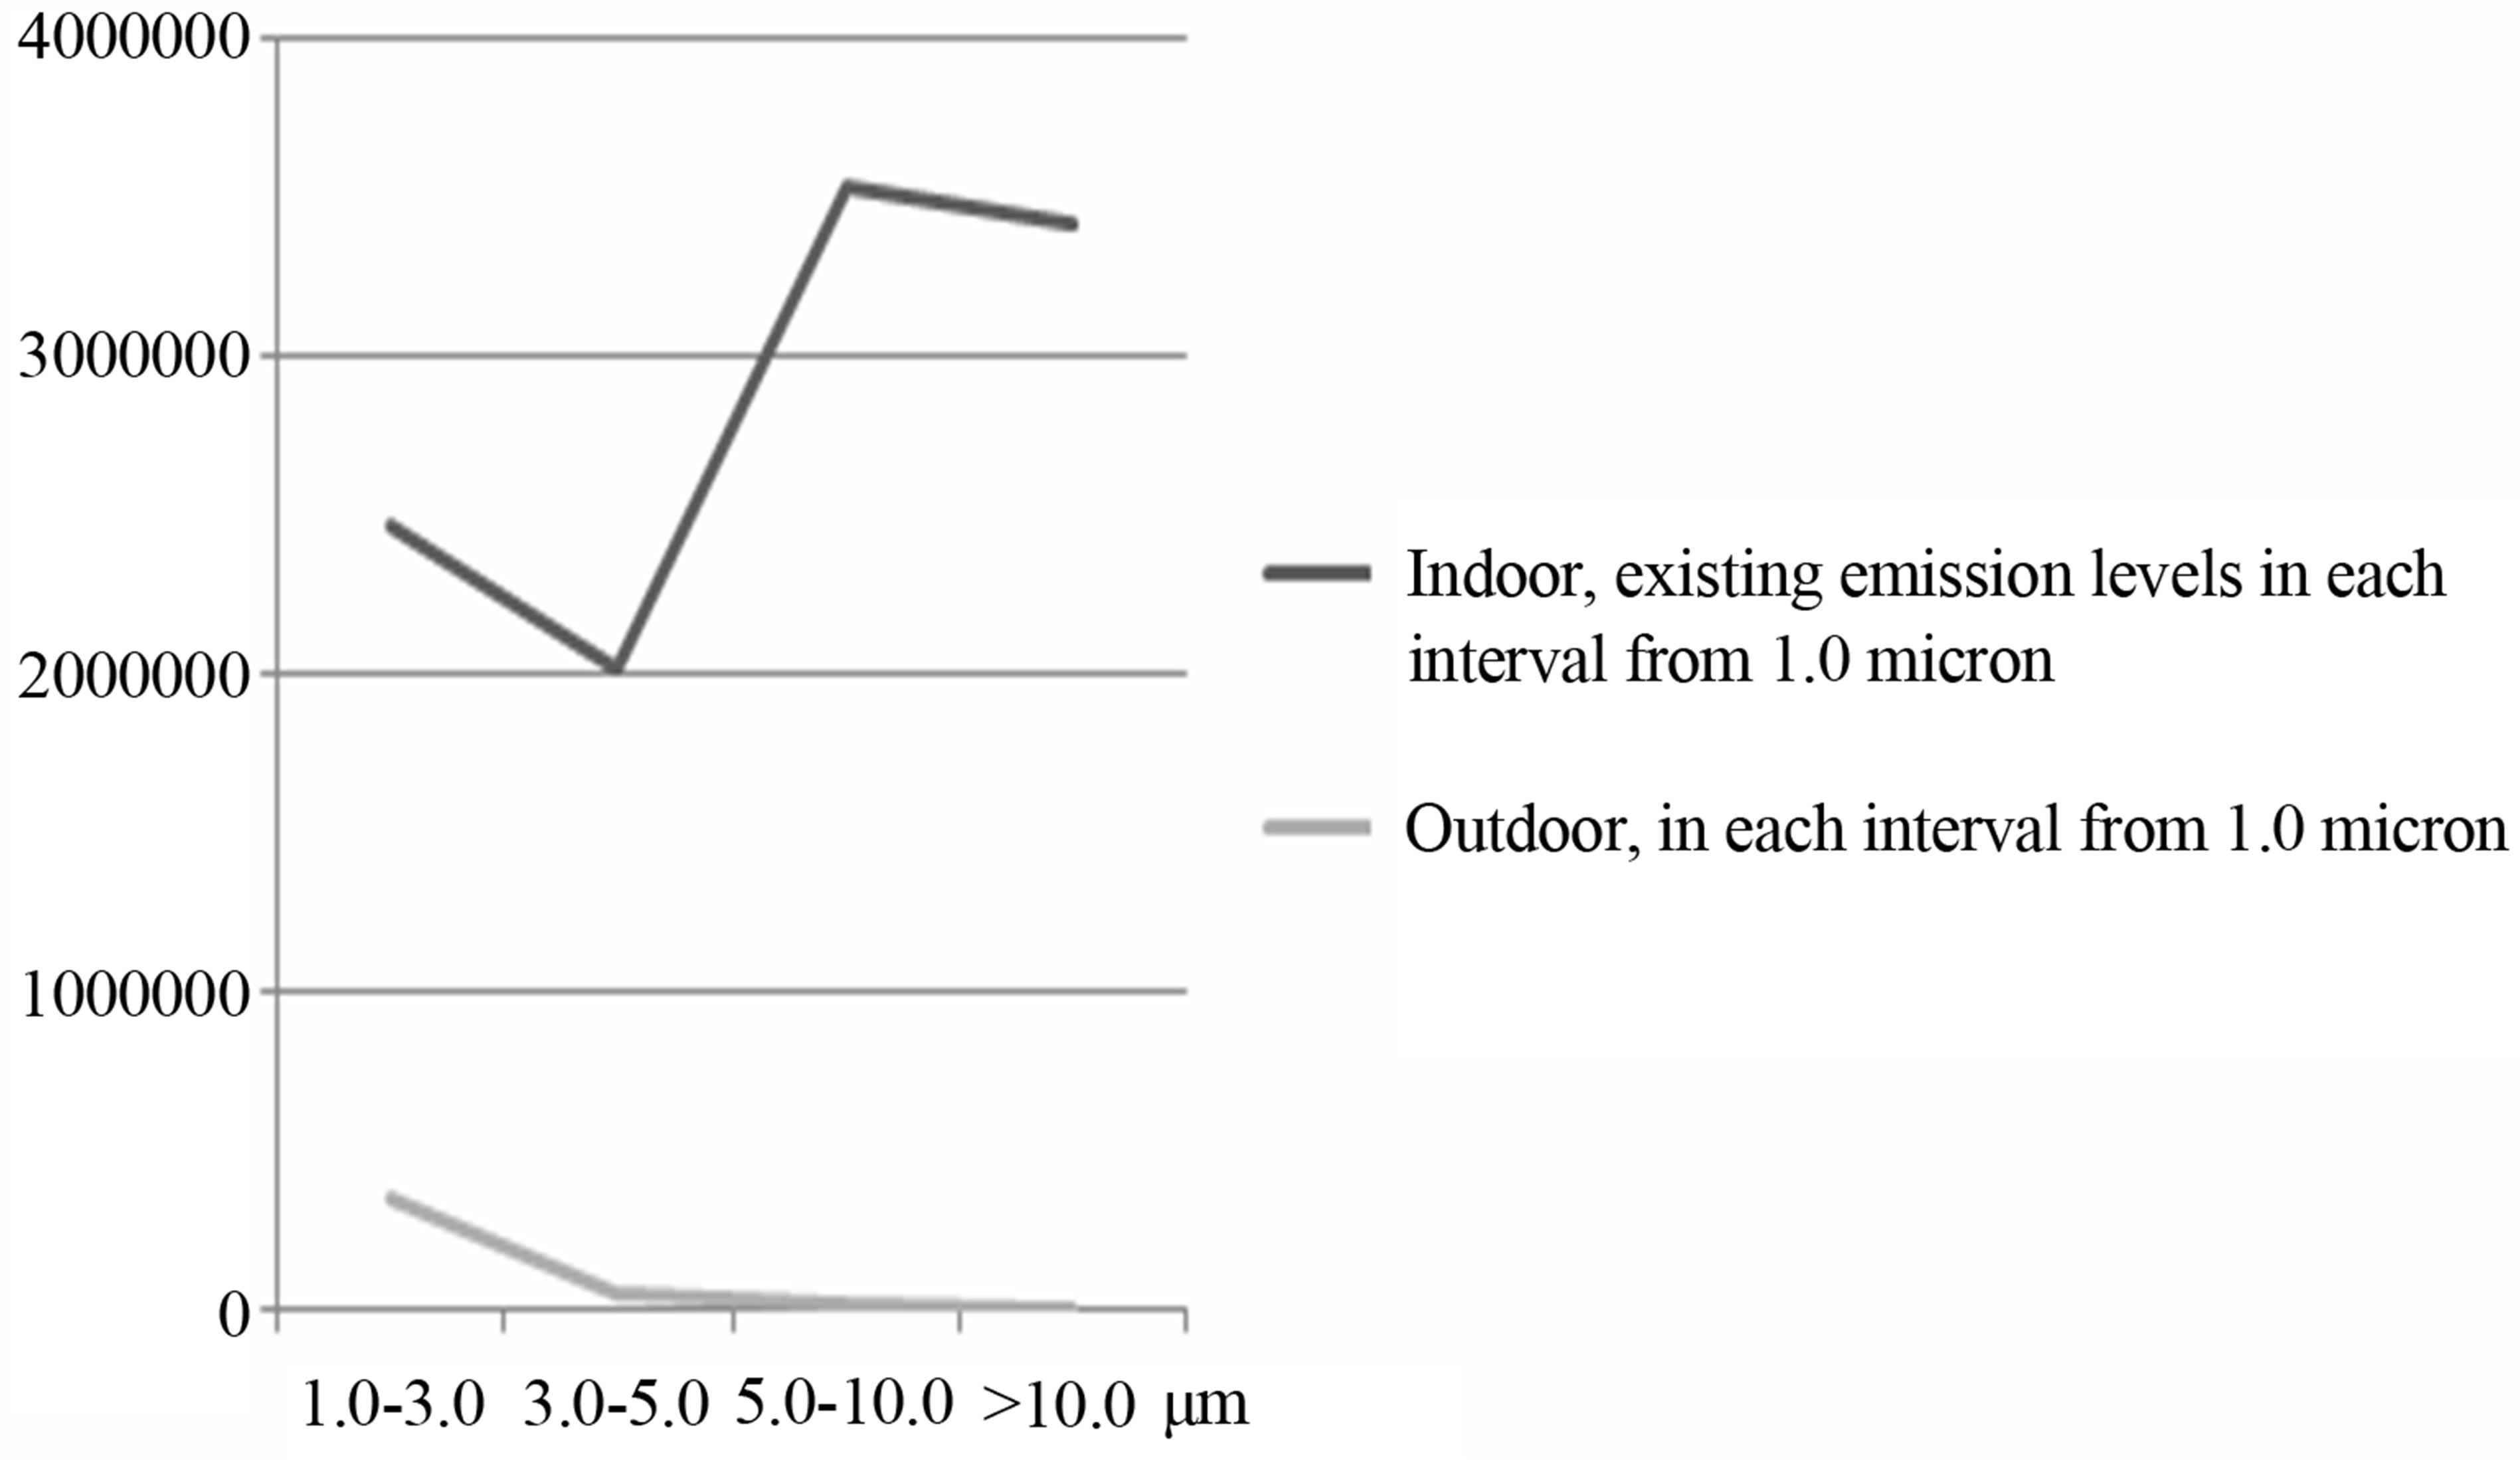
Figure 10. Selected school environments, 5 units, existing emission levels, number of particles/m3, averaged emission quantities where the graphs show emission levels indoor and outdoor, in each interval from 1.0 micron.
range of 1.0 micron Figures 3-10. This situation can be remedied with relatively limited resources, and the project has been held within the respective municipalities existing budget. The result is shown in Figure 11, where the sum of the respective interval are reported and in Figure 12, where the sum of the respective range is reported.
Comfort measurements, humidity RH (%) and air temperature (˚C), were carried out in the five units where indoor environment was corrected. The measurements were conducted during different time periods and length of time, but preferably during the winter months when the heating season was in progress. The measured results, maximum, minimum and average values, for each building and outdoor air at each building are shown in Table 3. The table shows that the mean indoor humidity in all cases is below 30% and in unit 5 as low as 16%. It should also be noted that the device shows the lowest value of 6%. For outdoor levels, there are no significant differences. The variations found between the various units should be caused by that environment and building. To obtain an estimate of how the ventilation system affects comfort in the indoor environment, it’s studied how this relates in two buildings with different ventilation design. One of the buildings is unit No. 2 in Table 3, a preschool with in schools and preschools in Sweden normally occurring mechanical ventilation system.
In the second building the ventilation design consists of natural ventilation. The measurements were carried out during the winter period, 12 January to 13 February 2013 and measured levels are reported in Figures 13 and 14.
A comparison between the two ventilation structures indicates the following values on the humidity.
• The mean value is 19% in the building with mechanical ventilation, and 34% in the one with natural draft.
• The maximum measured value is 29% in the building
 (a)
(a) 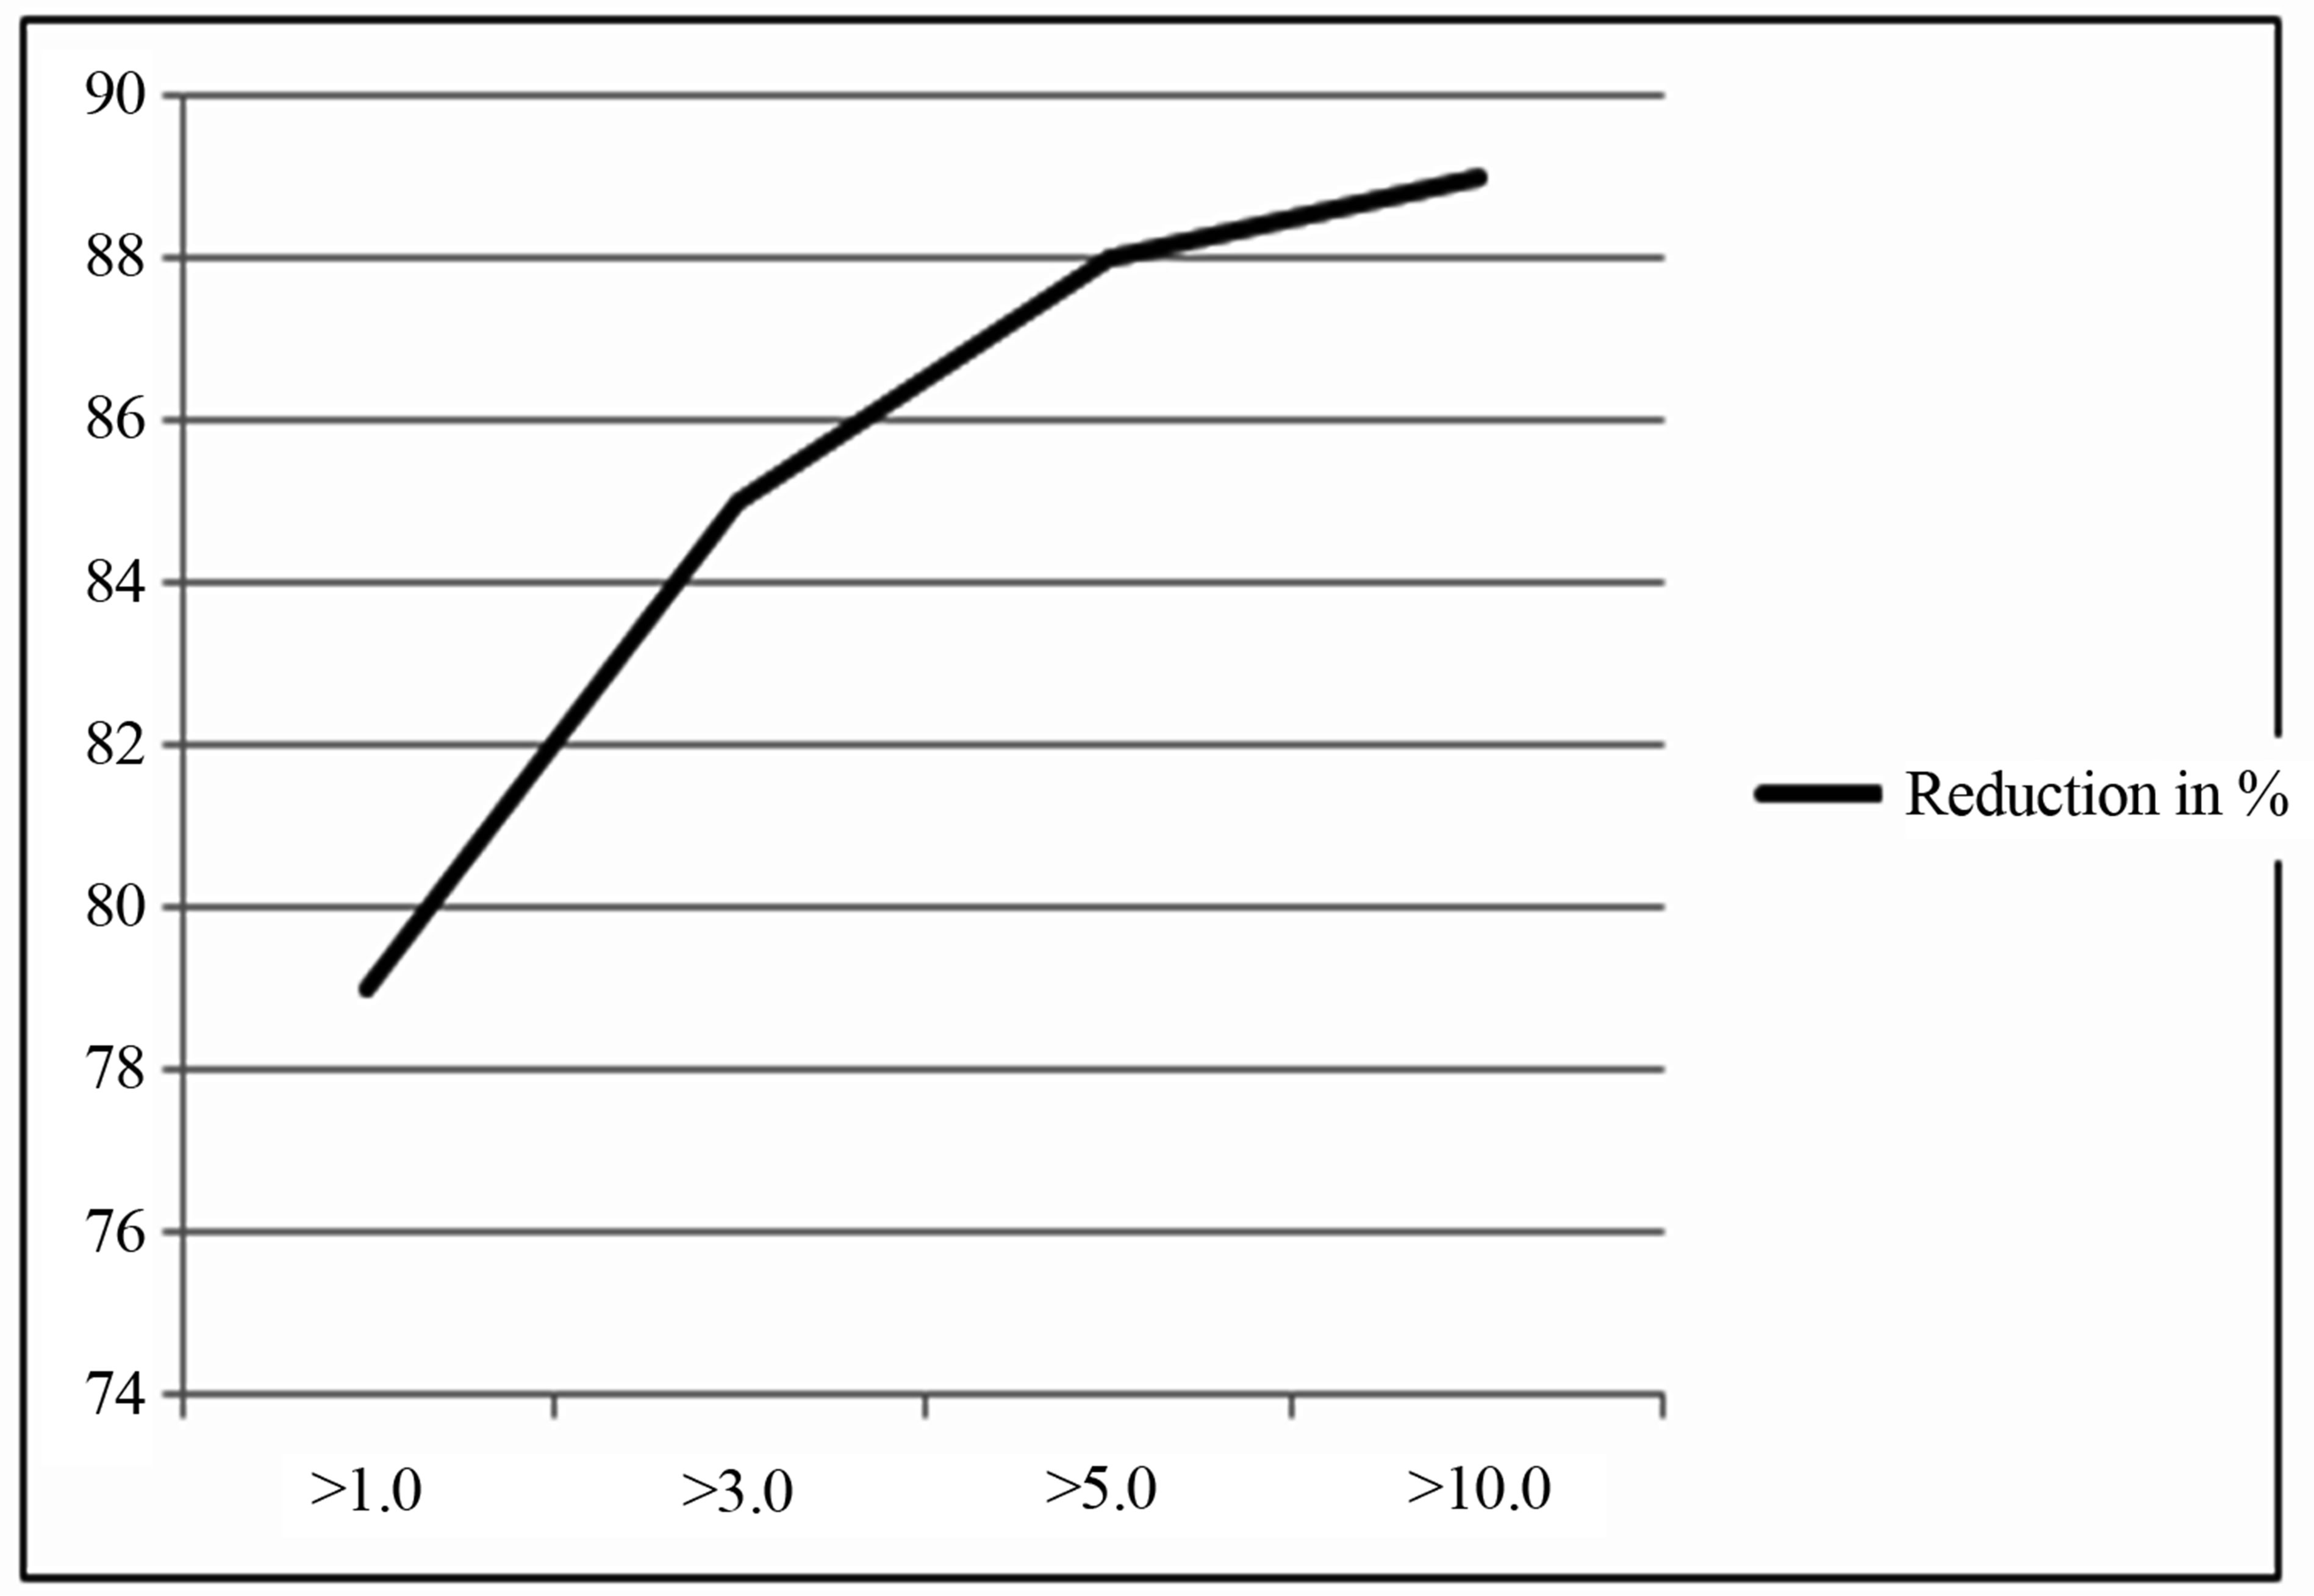 (b)
(b)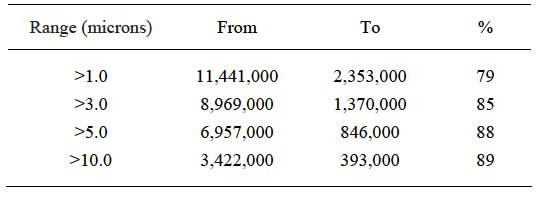
Figure 11. Comparison between emission amount from interval > 1.0 micron, existing levels respectively after measures. Chart a shows the number of particles/m3 and Chart (b) shows the reduction in percent (%). When comparing the pre-existing level and the level after measures it’s demonstrated that the emission load in the indoor environment from the respective interval 1.0 micron has decreased significantly in percent, see the table below.
with mechanical ventilation, and 41% in the one with natural draft.
• The lowest measured value is 13% in the building with mechanical ventilation and 20% in the one with natural draft.
During the measurement period, the mean temperature outside was −6˚C, with the maximum value of +4˚C and the lowest of −19˚C. The humidity ranged between 77% and 100%, with a mean of 96%. In Figure 15, the graph of the temperature outside is assembled with the two buildings graphs of humidity.
 (a)
(a) 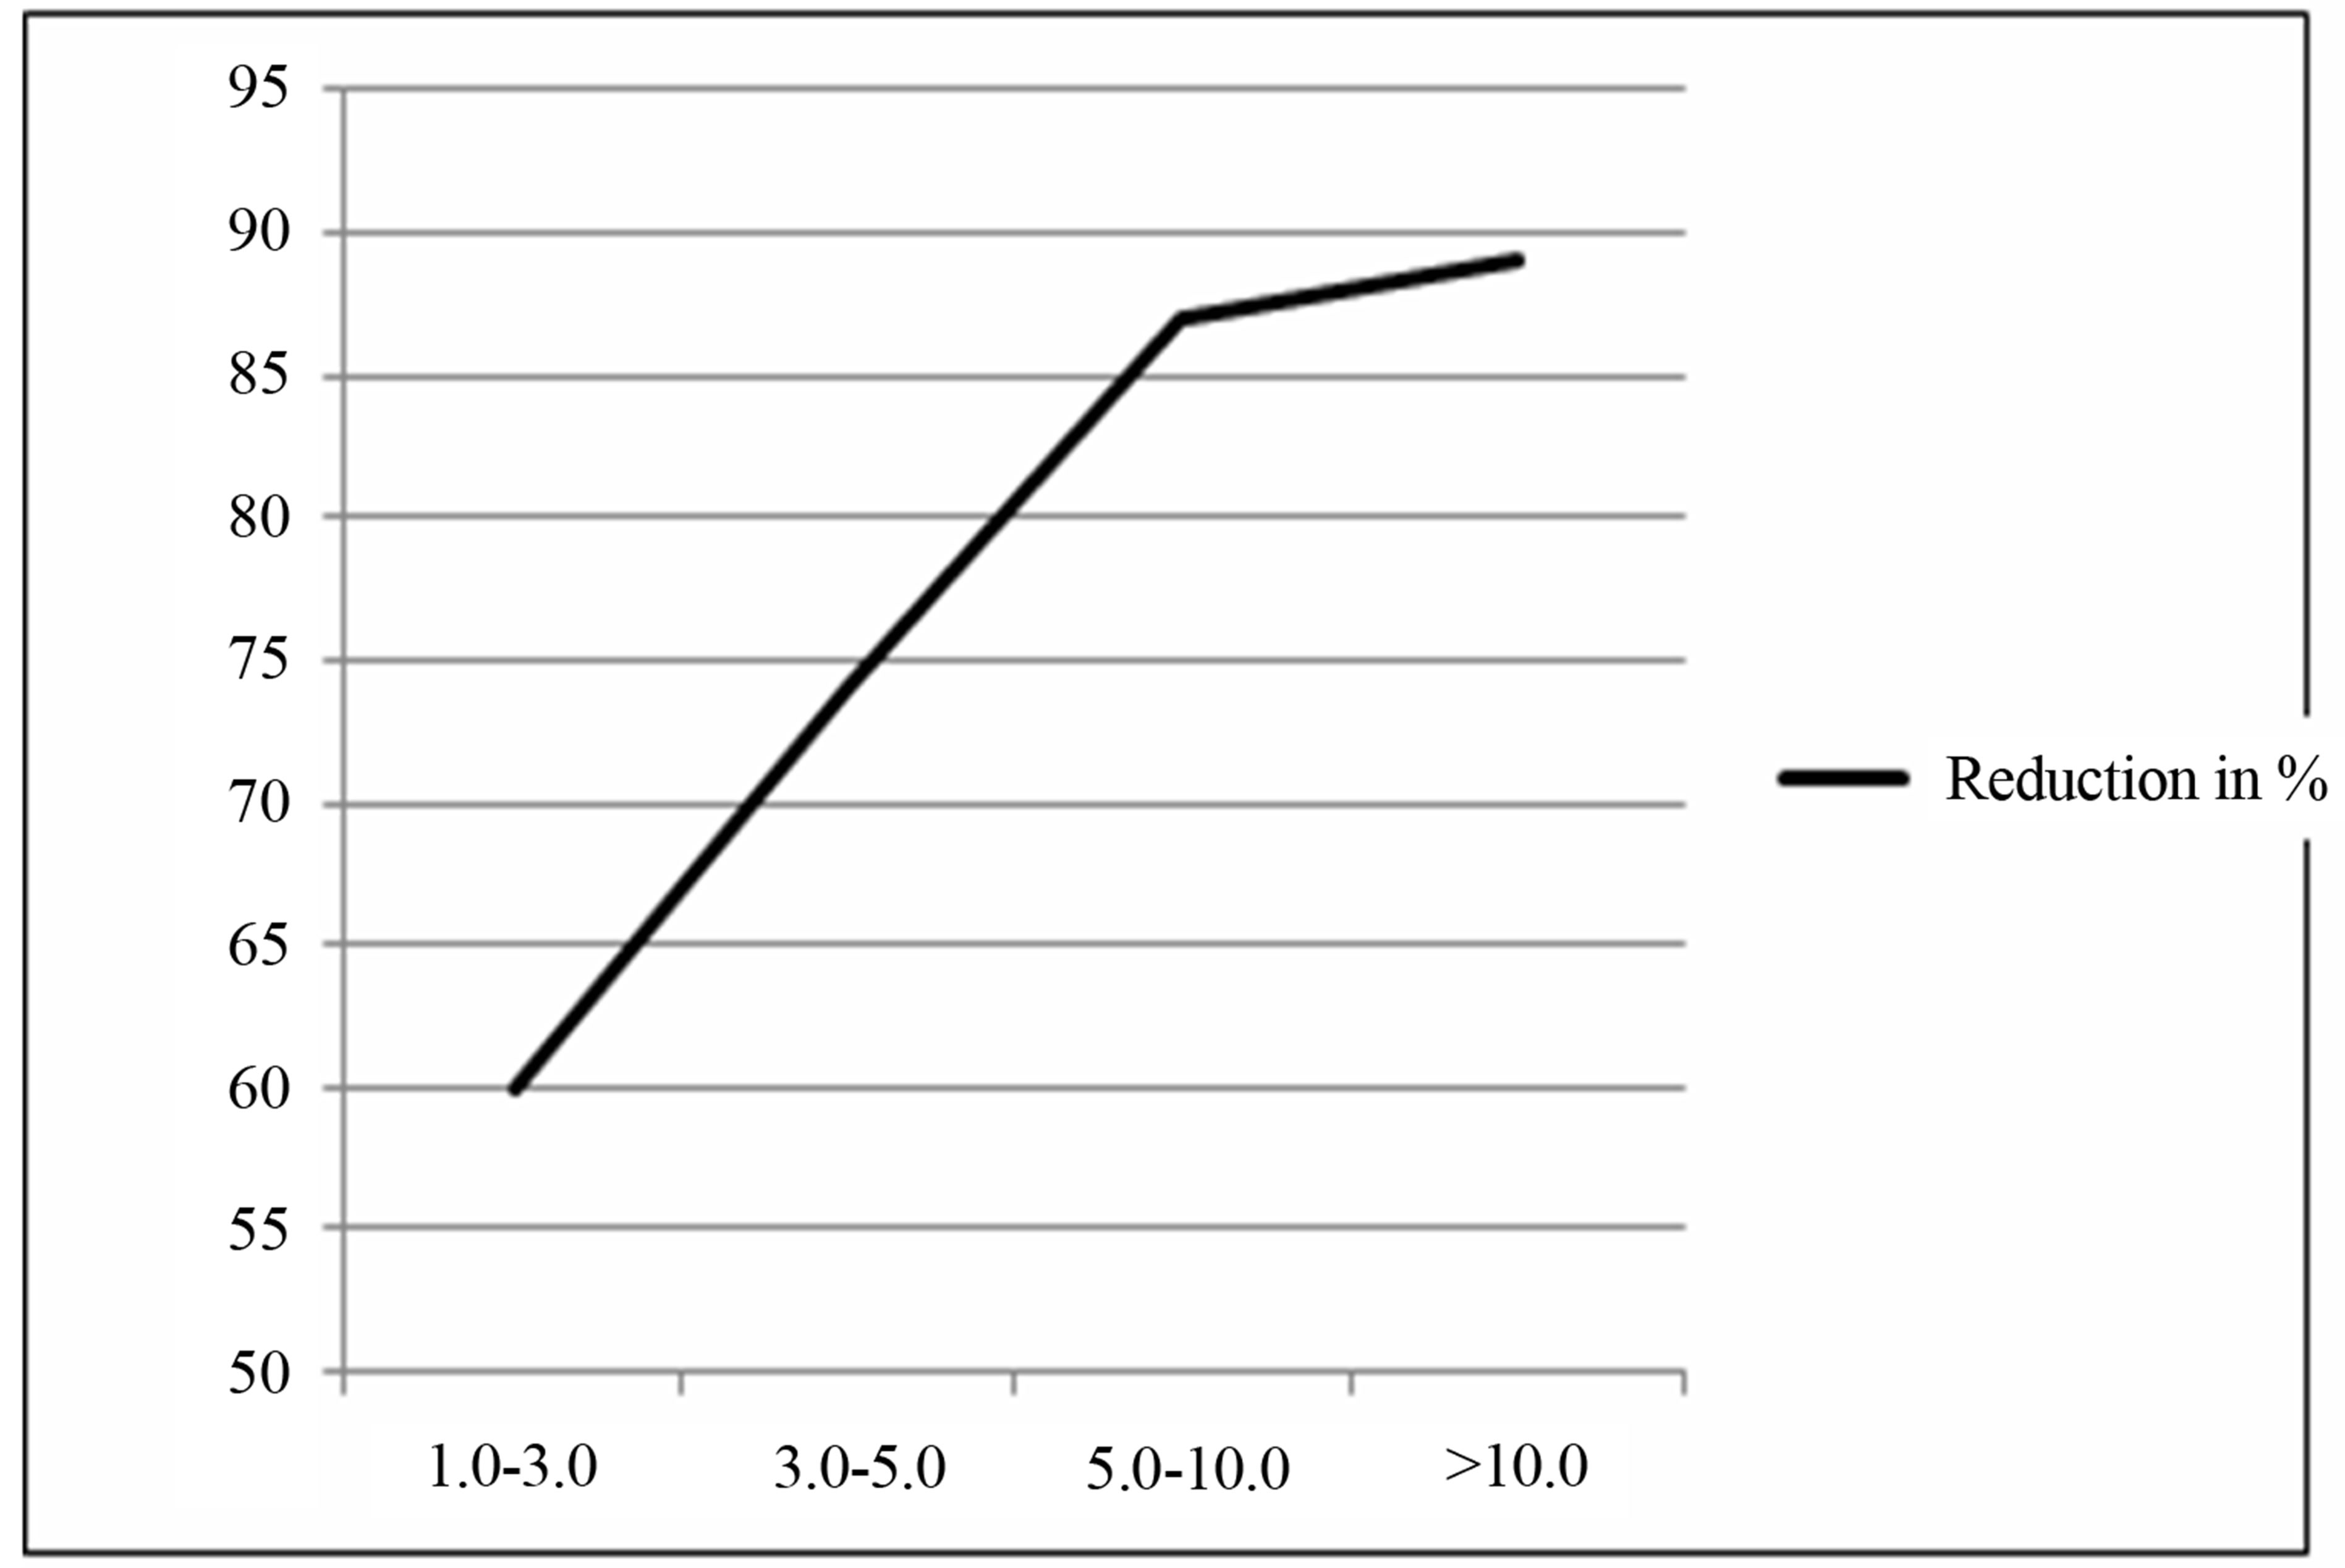 (b)
(b)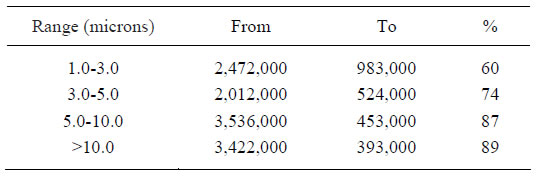
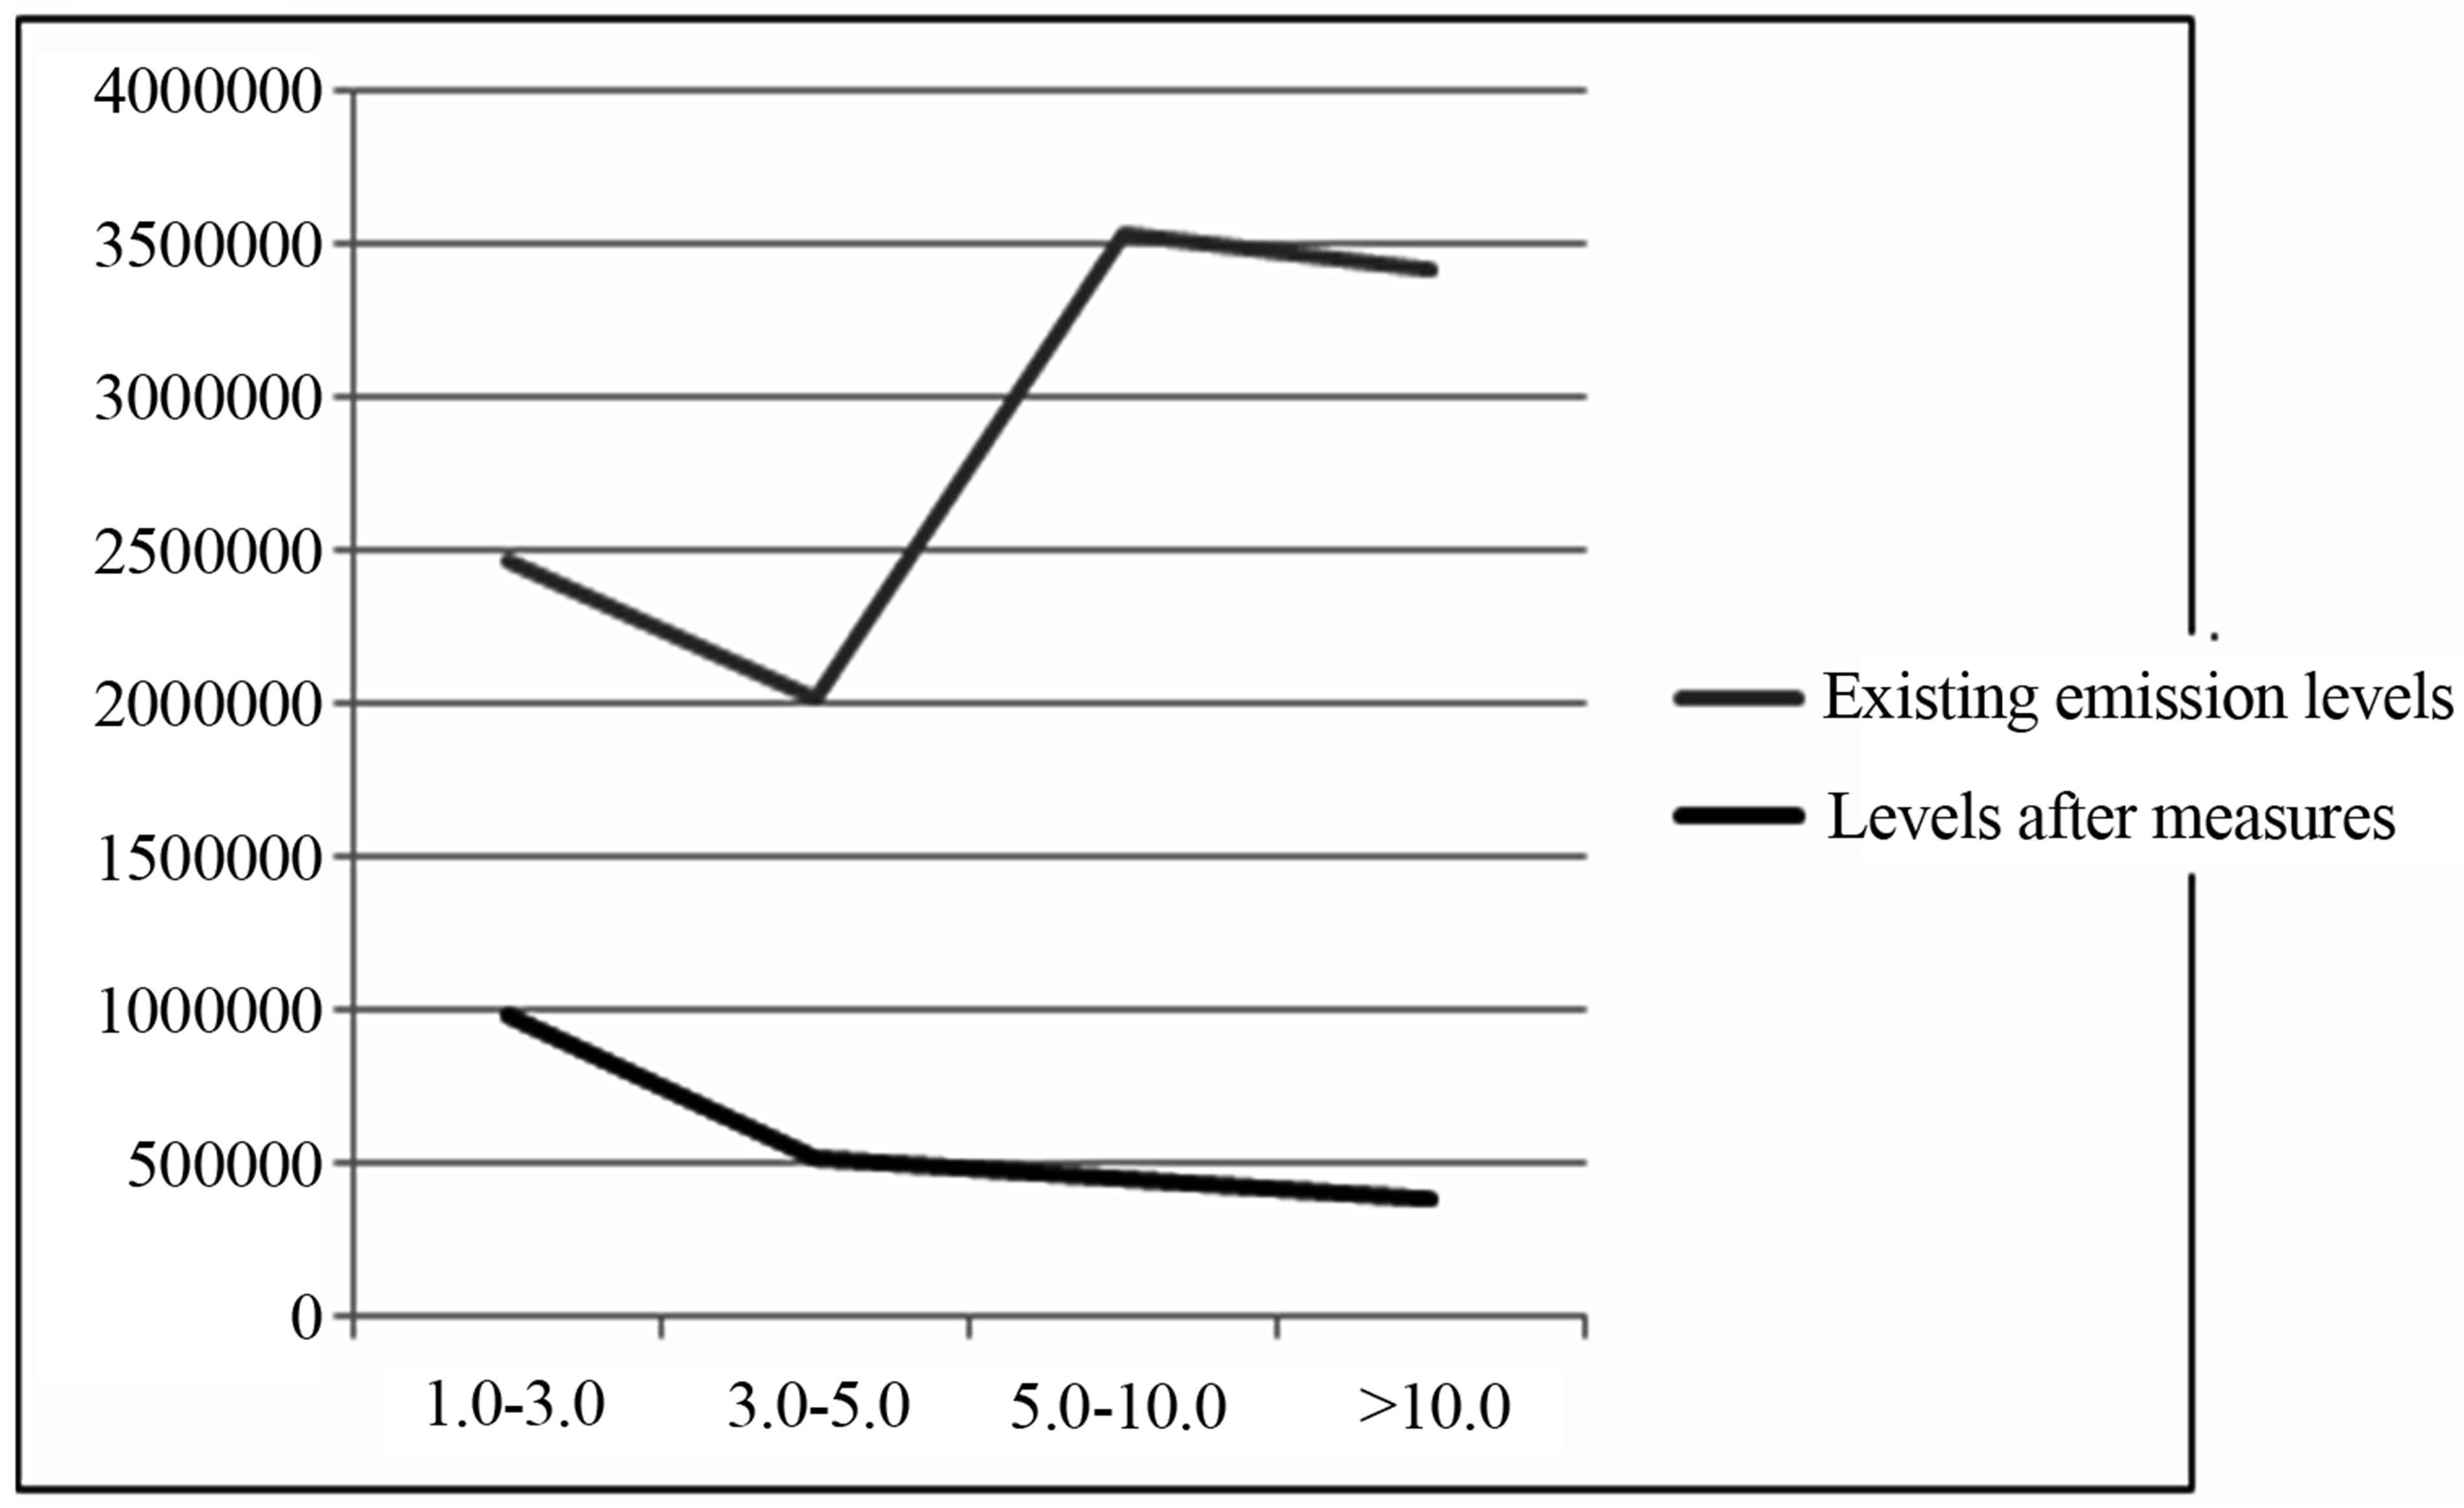
Figure 12. Comparison of emission amount in each interval from 1.0 micron, existing levels respectively after measures. Chart a reports the number of particles/m3 and Chart (b) shows the decrease in percent (%). When comparing the pre-existing level and the corrected level it shows that the emission load in the indoor environment for each interval from 1.0 micron has declined significantly in percent, see the table.
4. Conclusions
This study shows that there is a need to develop the environment in Swedish schools. The measurements are consistent. The survey shows that the majority of the respondents feels that the air is bad and dusty and that unpleasant odors are extensive and comfort problems prevailing in winter. The problems which the survey indicates are supported by the physical measurements. Regarding the unhealthy emission ranges, these results show higher levels than what is necessary. In Figure 16, the emission levels from the range of 1.0 micron are studied.
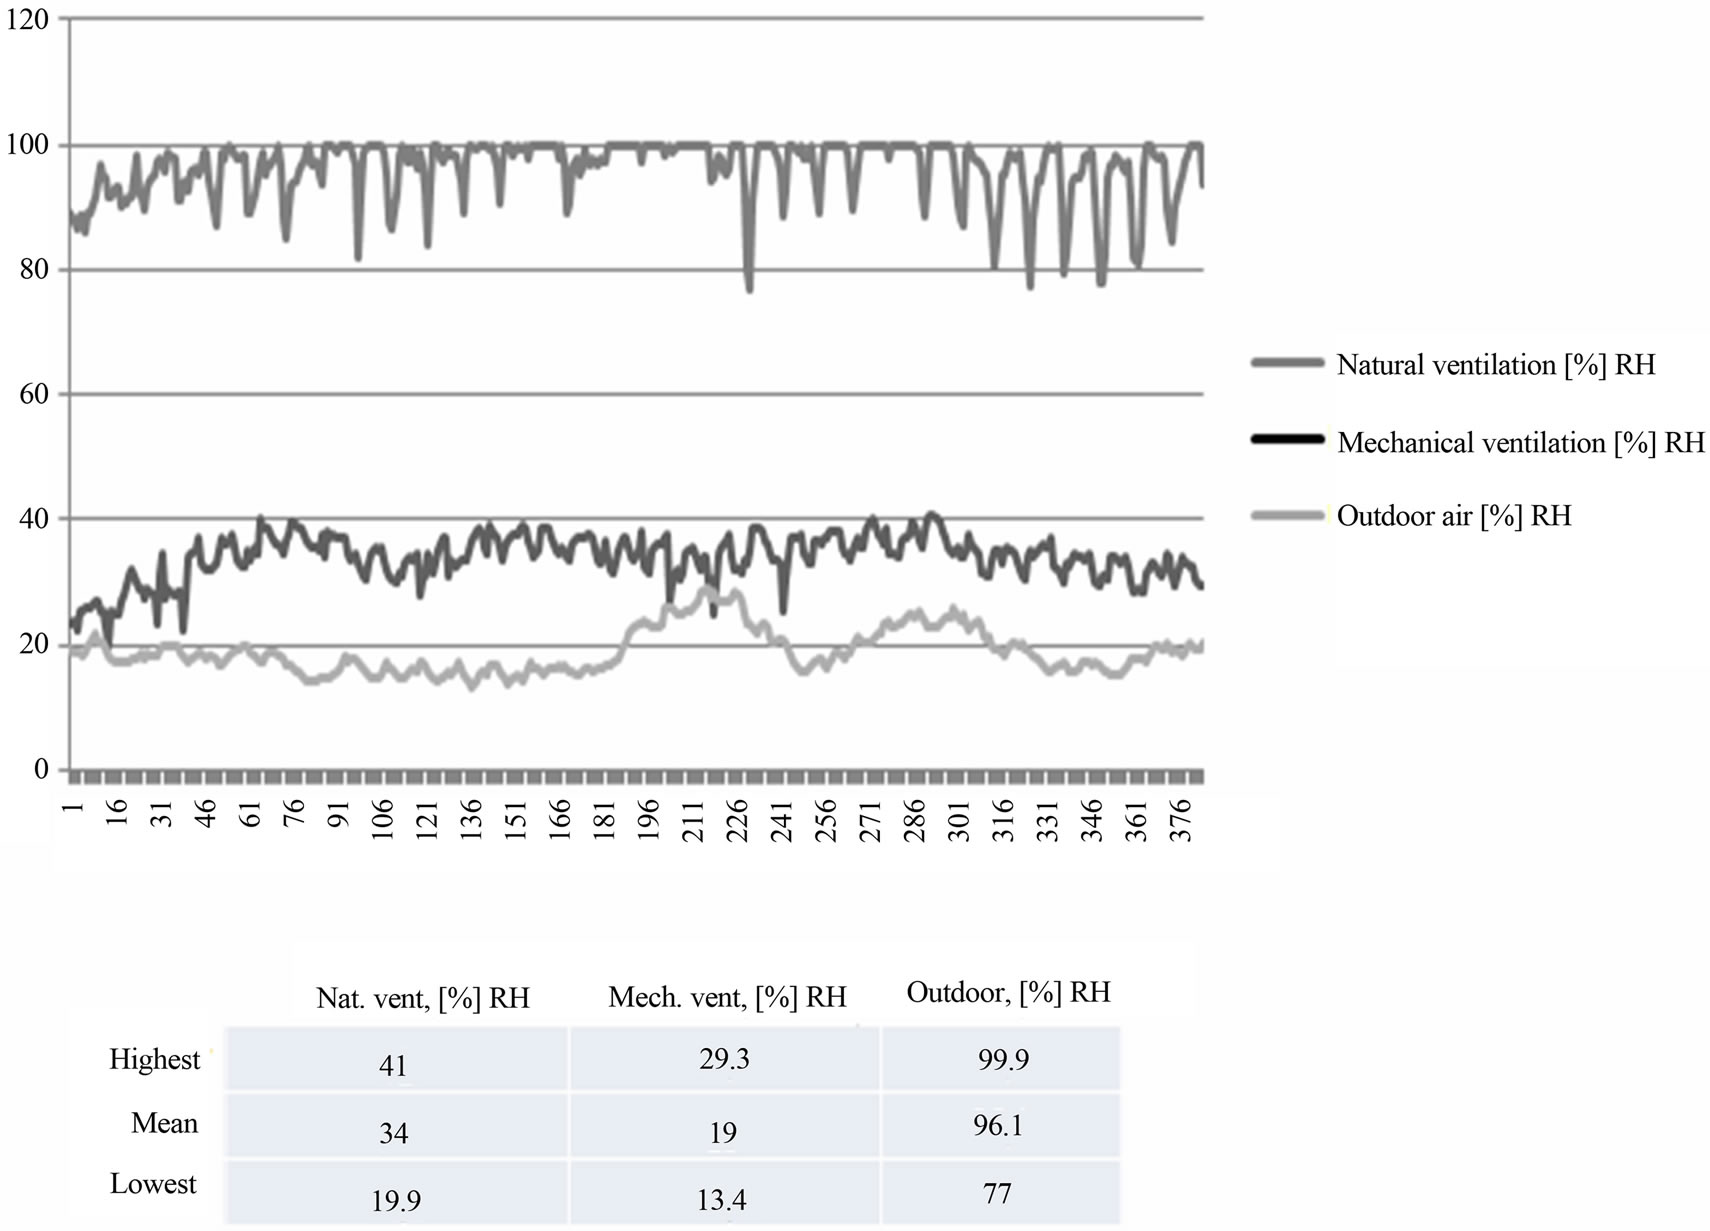
Figure 13. Humidity, RH (%), in the outside air and in the two buildings; one building with mechanical ventilation and one building with natural ventilation.
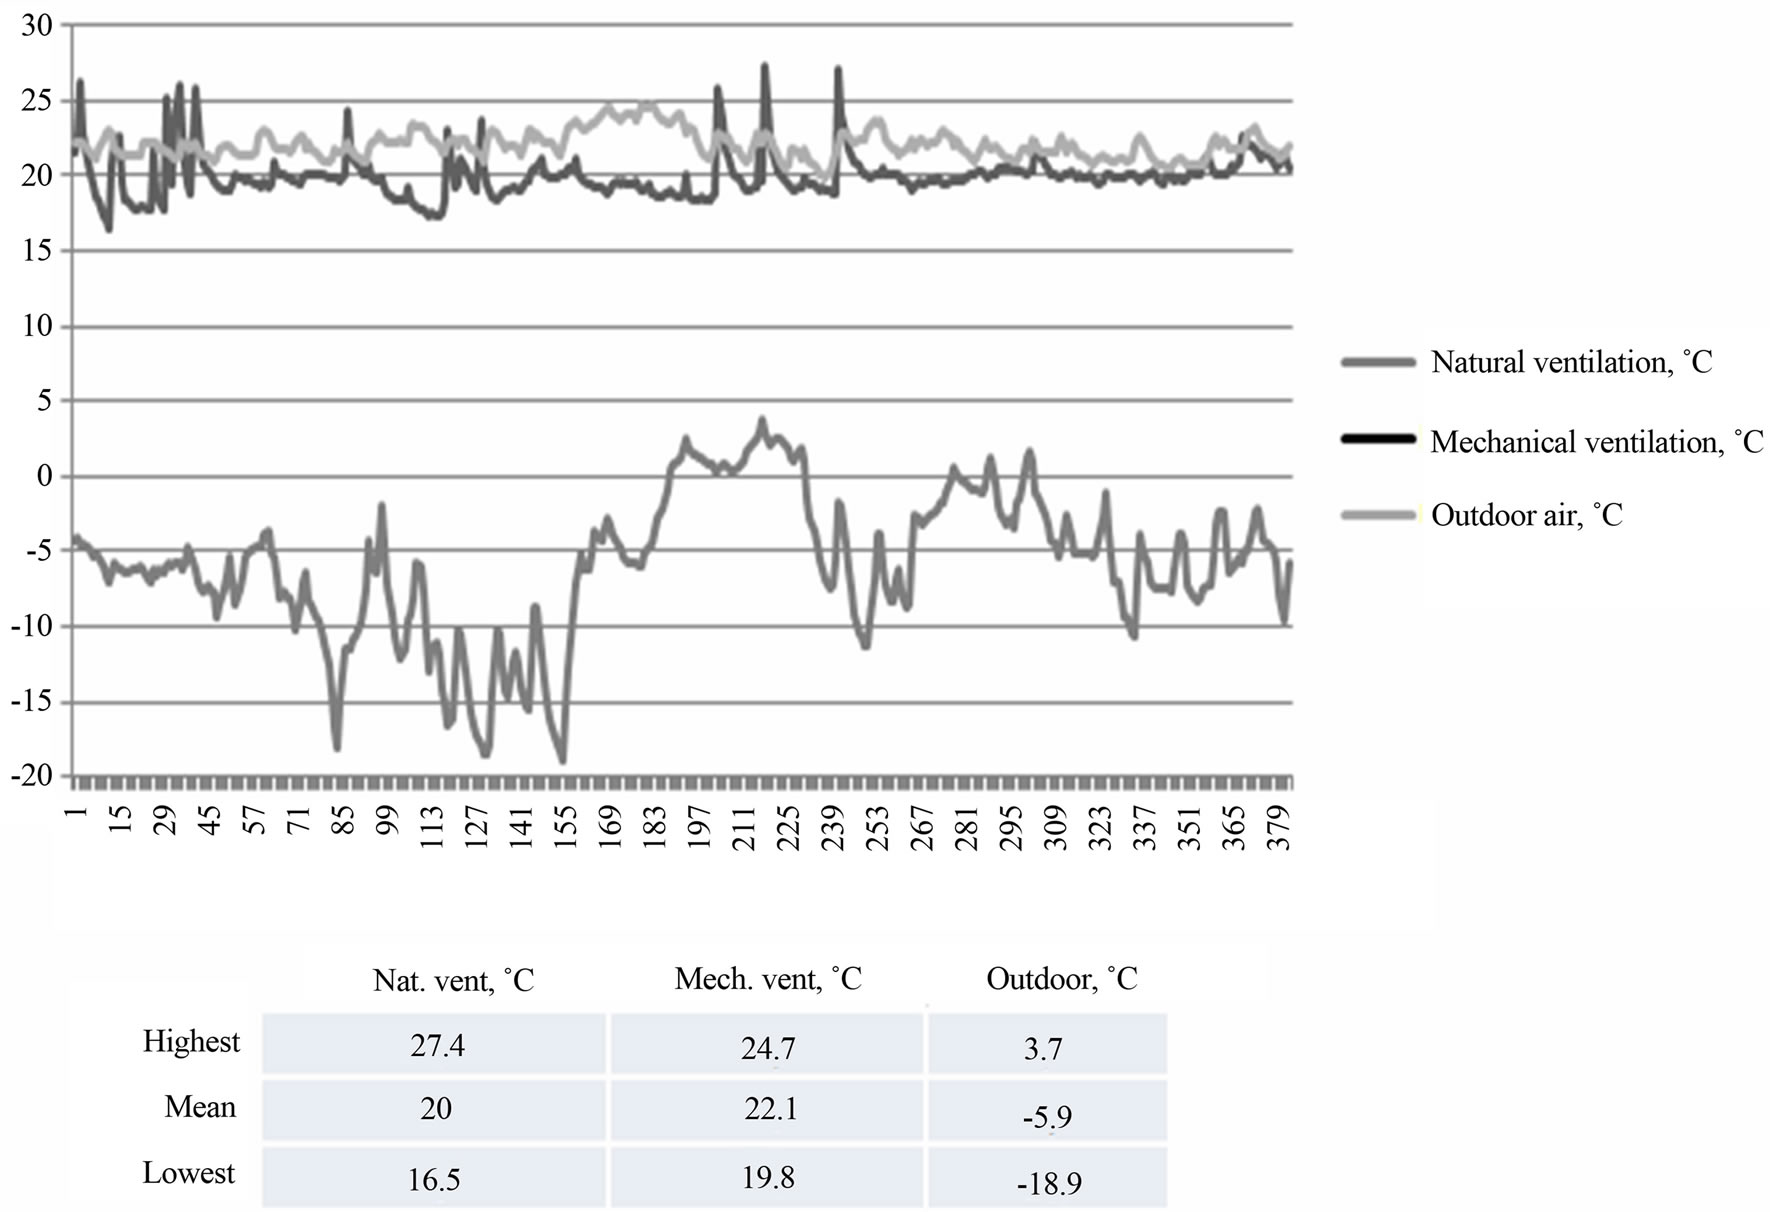
Figure 14. Air temperature, ˚C, in the outside air and in the two buildings; one building with mechanical ventilation and one building with natural ventilation.
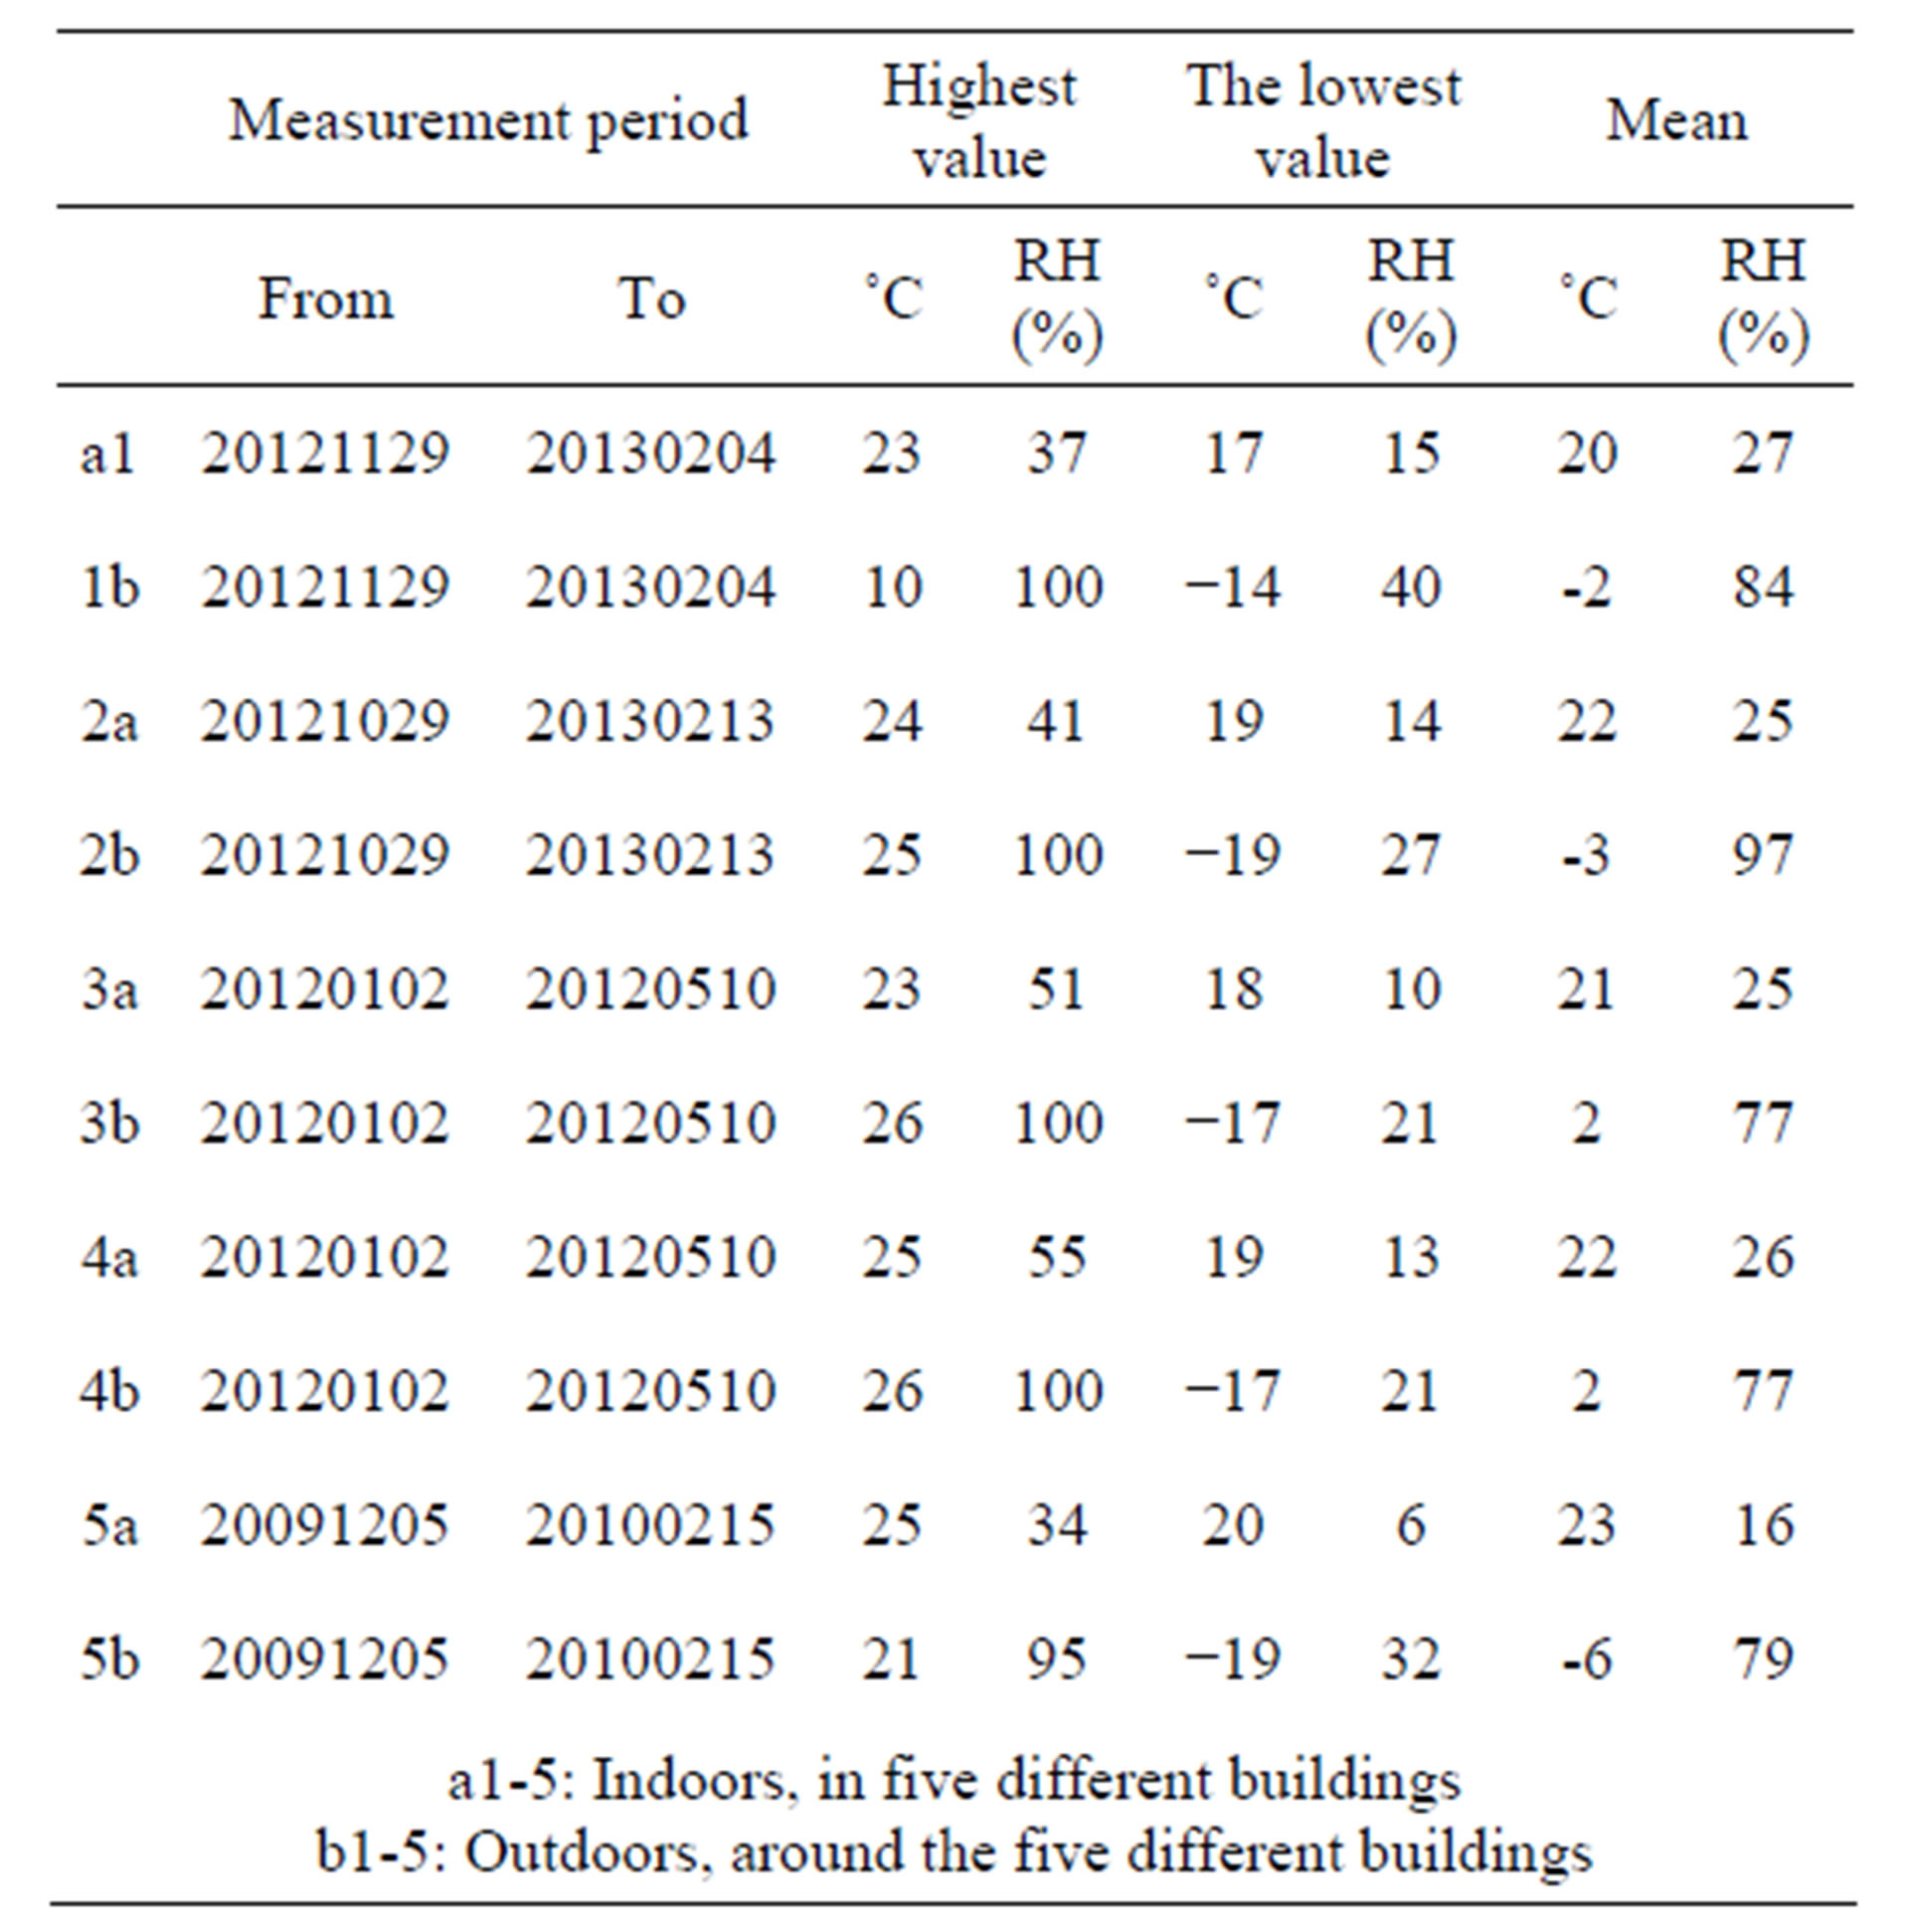
Table 3. The table shows that the mean indoor humidity in all cases is below 30% and in unit 5 as low as 16%. It should also be noted that the device shows the lowest value of 6%. For outdoor levels, there are no significant differences. The variations found between the various units should be caused by that environment and building.
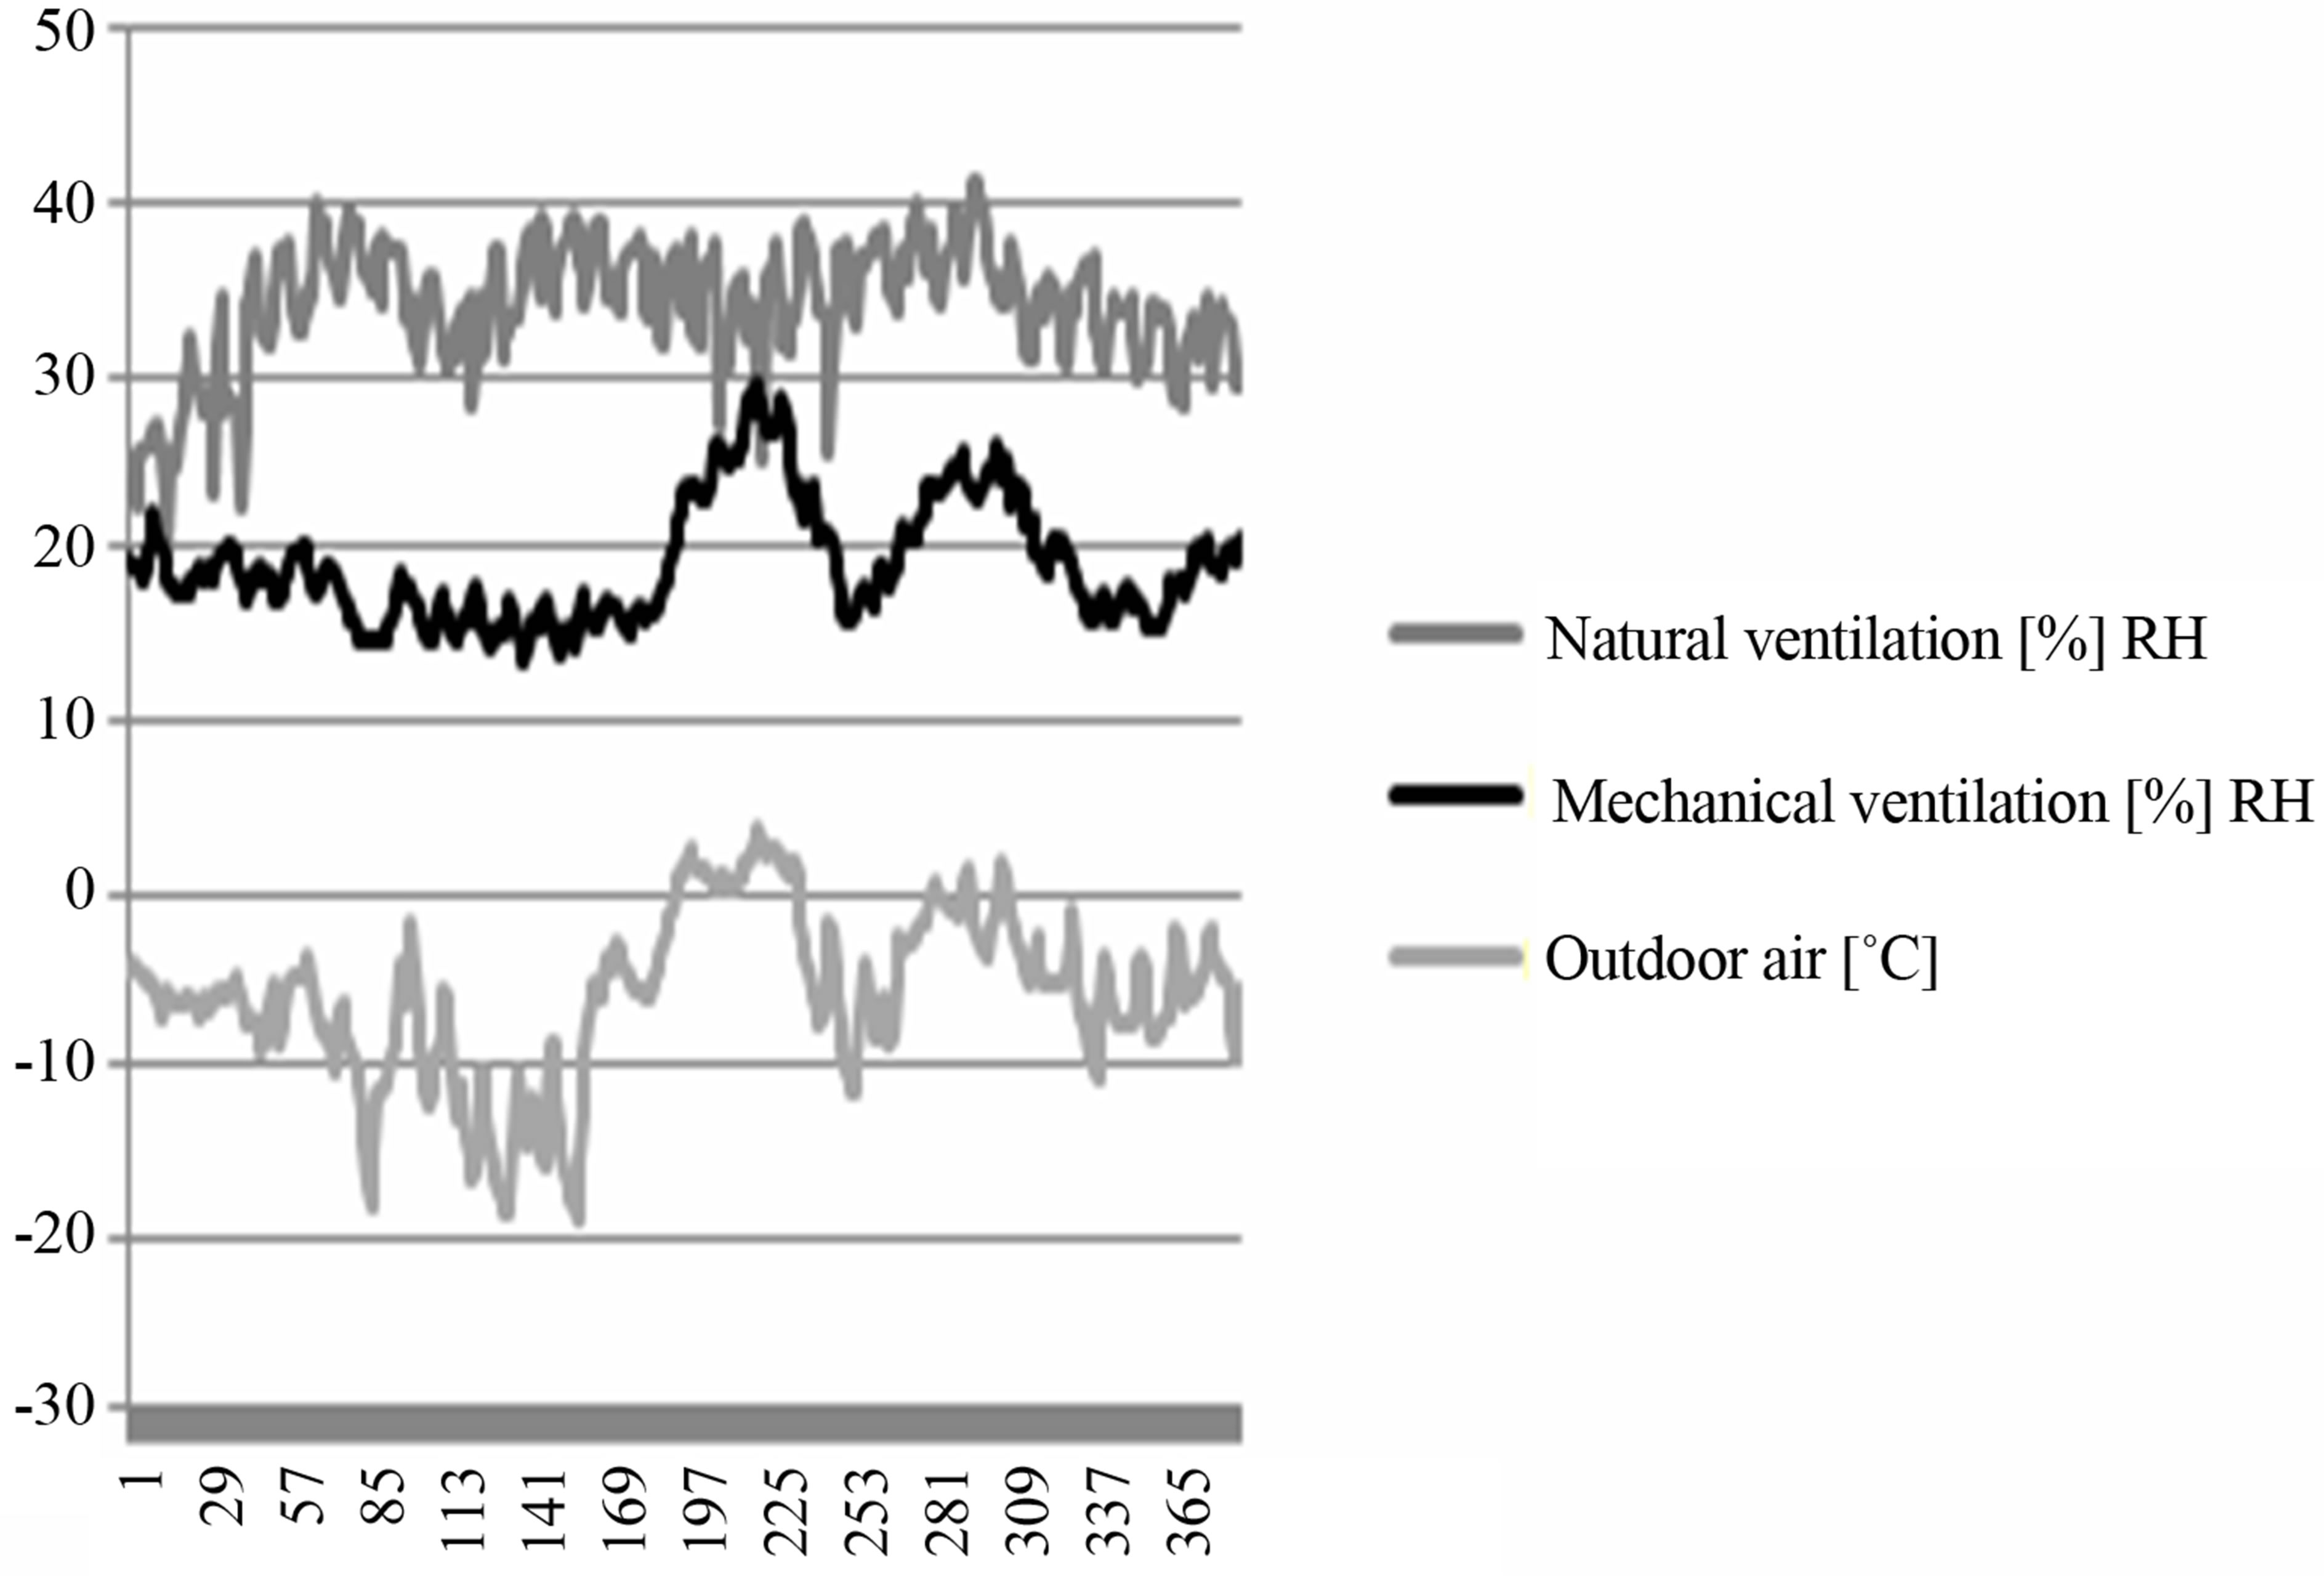
Figure 15. Comparison of the humidity in two buildings; one building with mechanical ventilation and one building with natural ventilation and the outside temperature during the measurement period, 12 January to 13 February 2013.
As shown in the two graphs, existing level and after measurements, the load on the air environment could be relieved significantly. The emission level in the larger intervals >5.0 microns has been reduced by 88%. With regard to the health aspect of these issues means it is important to gain control of this relationship. Of course, the working efficiency of the schools is also affected. Higher emission limits should increase both absenteeism by the spread of infection increasing with the amount of emission and fatigue in those who are present, resulting
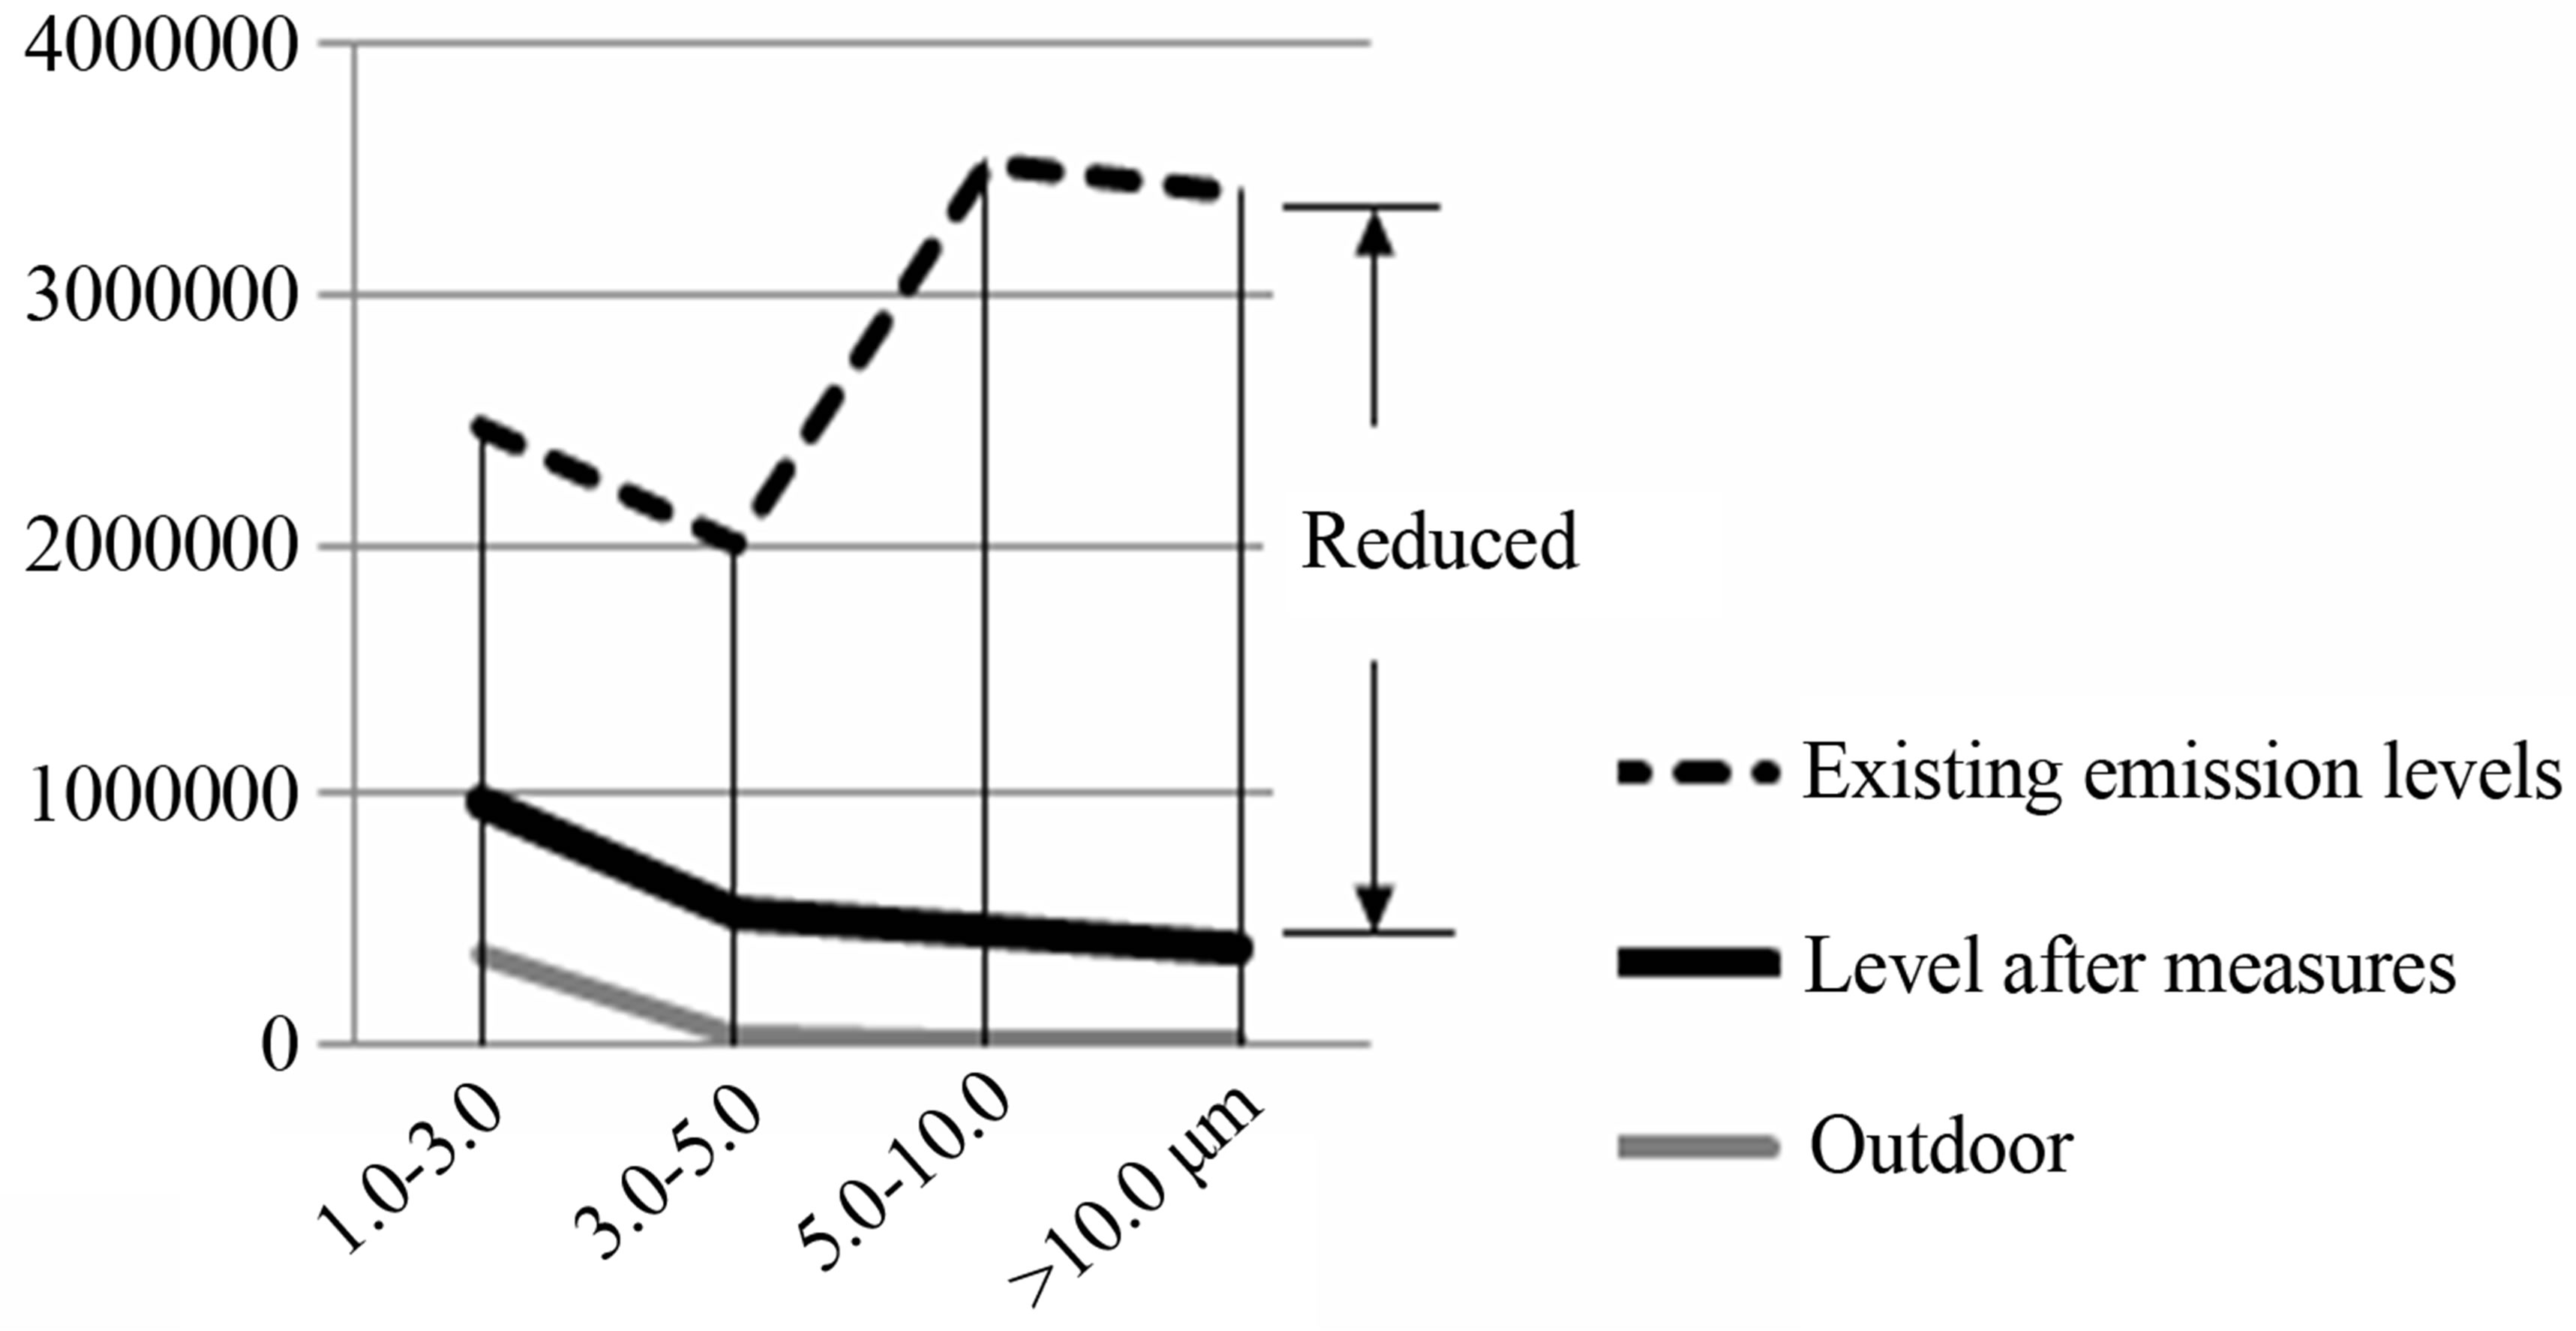
Figure 16. Emission amount, number of particles/m3, in each interval from 1.0 micron; existing level and after that the indoor environment has been measured, and in outdoor air. The graphs in the figure show that the emission load with relatively simple measures can be reduced significantly.
in decreased performance. An interesting observation about the ventilation system is shown in the diagrams in Figures 13-15. It shows that a significant difference exists in the humidity level and the significantly lower levels observed in the building with mechanical ventilation. It can also be shown how sensitive mechanical systems are to lower temperatures in the outdoor environment. Within the framework of this project, there was only opportunity to examine one building. However, it is important to begin to highlight the problem, indoor environments with high particulate emissions, combined with dry air. The low humidity levels indoors increase the risk of the occupants of the premises, including the mucous membranes dry out, they become more susceptible to external issues and that they themselves emit these to a greater extent. Regarding emission limits measurements indicate that there are good opportunities to create such values. Of course, it is required that instruments are developed for the purpose. In this study the same instrument was used at all measurements, which in itself is a calibration system. Should limits be created, it is required that the standard instruments are available and that the instruments are mutually calibrated. A good baseline is to use outdoor air in the way that this project has done by compiling many values from the outdoor environment. Regarding the indoor environment, the lower emission level as reported in Figures 9-12 can be an initial indication. Of course, a larger and more comprehensive bank of values should be built up, both for indoor and outdoor environment which provides a statistically reliable basis.
REFERENCES
- P. E. Nilsson, “Achieving the Desired Indoor Climate,” Chalmers University of Technology, Gothenburg, 2003.
- K. Asplund, P. Pershagen and M. Svartengren, “Environmental Health Report,” The National Board of Health and Welfare, Stockholm, 2005.
- M. Renström, A. C. Egmar and M. Wickman, “A Summary of Knowledge about the Consequences of Cleaning on Allergy and Hyper-sensitivity in Schools and Preschools,” Stockholms Läns Landsting and Swedish National Institute of Public Health, Stockholm, 1996.
- W. W. Nazaroff, “Indoor Particle Dynamics,” Indoor Air, Vol. 14, Suppl. 7, 2004, pp. 175-183.
- The National Board of Health and Welfare, “Message to Boards of Environment and Health Protection, County Administrations and Units for Environmental Medicine of the County Councils, Health Risks with Moisture Problems in Buildings,” 2006.
- Swedish Work Environment Authority, “Plan of Action for Dealing with Sick-Building Problems,” 2008. http://www.av.se/teman/sjuka_hus/Startintro_sjukahus.aspx
- G. Stridh, “Should We Measure the Chemistry Beneath the Floor Coverage and, If So, How Do We Interpret the Results?” Indoor Climate Örebro, Örebro University Hospital, 2003, pp. 102-108.
- L. Grinbergs, “Mould Resistance of Surfaces in Wet Rooms,” Department of Building Technology, KTH, Royal Institute of Technology, Stockholm, 1992.
- T. Alsmo, “A Study with Surveys and Particle Measurements,” Department of Buildings and Construction, KTH, Royal Institute of Technology, Stockholm, 1994.
- J. Sundell and M. Kjellman, “The Indoor Air We Breathe,” Swedish National Institute of Public Health, Stockholm, 1995.
- Wikipedia, 2008. http://sv.wikipedia.org/wiki/Sensibilisering
- L. Månsson, “The Invisible Enemy of High-Tech,” TIMAB AB, Malmö, 1992.
- M. Ramtorp, “Clean Technology and Clean Rooms—An Introduction,” BioTeknisk Processdesign AB, Malmö, 1999.
- G. Einberg, “Air Diffusion and Solid Contaminant Behaviour in Room Ventilation—A CFD Based Integrated Approach,” Ph.D. Thesis, Technology and Health, KTH, Royal Institute of Technology, Stockholm, 2005.
- T. Alsmo and S. Holmberg, “Sick Buildings or Not: Indoor Air Quality and Health Problems in Schools,” Vol. 16, No. 6, 2007, pp. 548-555.
- Å. Thörn, “The Emergence and Preservation of Sick Building Syndrome, Karolinska Institutet,” Department of Public Health Sciences, Division of Social Medicine, Stockholm, 1999.
- C. Brauer, “The Sick Building Syndrome Revisited,” Department of Occupational Medicine, Copenhagen University Hospital, Glostrup, Denmark, 2005.
- Partiklar i luft, Social & hälsovårdsministeriet. http://www.hsy.fi/seututieto/Documents/Ilmanlaatu_esitteet/Partiklar_i_luften.pdf
- TSI Incorporated, 500 Cardigan Road, Shoreview, MN 55126 USA. http://www.tsi.com/en-1033/index.aspx
- B. Ljungqvist, R. Nydahl and B. Reinmüller, “Measurement Technology in Rooms with high demand,” The Royal Institute of Technology, KTH and KABI, Stockholm, 1989.
- The National Board of Housing, Building and Planning, “Law on Technical Requirements for Construction Work,” 2008.
- http://www.testo.com/online/abaxx-?$part=PORTAL.INT.Applications&$event=show-from-content&externalid=opencms:/Products/MeasurementParameters/temperature/Messgeraete/Datenlogger/testo_175-T2_new/Englisch. product
- http://www.engineeringtoolbox.com/psychrometric-chart-mollier-d_27.html
- A. V. Arundel, E. M. Sterling, J. H. Biggin and T. D. Sterling, “Indirect Health Effects of Relative Humidity in Indoor Environments,” Environmental Health Perspectives, Vol. 65, No. 3, 1986, pp. 351-361.