Journal of Environmental Protection
Vol. 3 No. 8 (2012) , Article ID: 21755 , 6 pages DOI:10.4236/jep.2012.38084
Removal of Phosphorus from Water Using Marble Dust as Sorbent Material
![]()
Laboratory of Water Environment Engineering, Kyushu University, Fukuoka, Japan.
Email: ommj73@yahoo.com
Received May 10th, 2012; revised June 12th, 2012; accepted July 9th, 2012
Keywords: Removal of Phosphorus; Marble Dust; Kinetic Model; Pseudo Equation; Isotherm Model
ABSTRACT
The removal of phosphorus from water using marble dust as sorbent material was studied by conducting batch tests, kinetic sorption model and isotherm model. The kinetic sorption model based on a pseudo equation was applied to predict the rate constant of sorption. Thorough investigations to understand the mechanism of phosphorus sorption onto the marble dust using kinetic sorption models, pseudo first order and pseudo second order kinetic sorption models showed that the kinetic sorption is consistent with the second order model, from which it can be inferred that the mechanism of sorption is chemisorption. The Langmuir and Freundlich isotherm models were applied to describe the equilibrium isotherms. The results of isotherm models showed that the Langmuir isotherm agrees very well with the experimental data compare with Freundlich isotherm. Batch tests and kinetic sorption models results showed that using the marble dust as sorbent material could be remove more than 94.3% of phosphorus from water.
1. Introduction
Phosphorus is an essential nutrient for all forms of life and cannot be replaced by other species. Phosphorus is mostly obtained from mined rock phosphate and existing rock phosphate reserves could be exhausted in next 50 - 100 years [1]. At the same time release of phosphorus from wastewater systems, agricultural areas runoff and landfill leachate into water reserves constitutes the main risk for reduced water quality.
In order to reduce the negative effects of overloading the ecosystems with phosphorus as well as recycling of phosphorus and reducing the high costs of mining and processing of phosphorus, it is necessary to investigate various techniques and materials that could contribute to the removal and recycling of phosphorus.
Phosphorus removal using natural materials as novel sorbents has been gaining increased attention. Several studies have reported on the using of natural materials to improve the phosphorus removal by sorption, including: limestone, shale, slag, iron rich gravel, zeolite, calcite and other artificial materials [2]. Adam et al., (2007) [3] reported that the shells and filtralite as natural materials were been tested for their phosphorus sorption capacity, both with batch and column experiments and found that the phosphorus removal rate of 92 and 91 was measured in the columns of shells and filtralite respectively, for the entire experimental period. It was reported that zeolite and pelleted clay, either alone orin combination with soils, alum, calcite and dolomite, was found to improve the phosphorus sorption capacity [4].
In this study marble dust was chosen in order to test its phosphorus sorption capacity. The main goal of this study was to determine the removal efficiency of marble dust with regard to a synthetic phosphorus solution, including the maximum sorption capacity of this material.
2. Materials and Methods
2.1. Materials
The sorbent material used in this experimentis marble dust; it was supplied by Tawarayakobo Company, Japan. The marble dust grain size is smaller than 0.2 mm and a chemical composition is 99.8% of CaCO3.
2.2. Batch Experiments
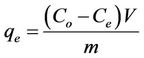
Batch experiments were conducted to investigate the kinetic sorption and efficiency of phosphorus removal by marble dust. The batch experiments were carried out in 300 mL glass flasks and the standard phosphorus solution used in the experiments were prepared from KH2PO4. Glass flasks were filled with 250 mL of phosphorus solutions at four different phosphorus concentrations (5, 30, 100, and 150 mg/l), and 5 g of the marble dust was added toeach glass flask. The mixtures were shaken at 120 rpm and 25˚C for 120 h. At different periods solution samples were taken and filtered with a 0.2 mm membrane filter prior to determination of phosphorus concentrations by spectrophotometer. The sorbet amount of phosphorus was calculated from the concentrations in solution before and after sorption. Also the amount of phosphorus sorbet by natural material from the solution at equilibrium qe (mg/g) was computed using Equation (1) [5]:
 (1)
(1)
where Co and Ce are the initial and equilibrium phosphorus concentrations respectively (mg/l), V is the solution volume (l) and m is the mass of mixed sorbent (g).
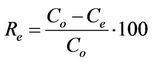
The percentage of phosphorus removed Re (%) from the aqueous solution was calculated using Equation (2) [6]:
 (2)
(2)
2.3. Kinetic Sorption Model
To investigate the sorption kinetics of phosphorus onmarble dust used in this study, two kinetic models are used: pseudo first order and pseudo second order.
2.3.1. Pseudo First Order Model
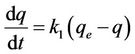
The pseudo first order equation can be written as follows [5,7,8]:
 (3)
(3)
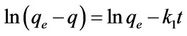
where k1 is the rate constant of pseudo first order sorption (1/hr), q is the amount of phosphorus sorbet at time t (mg/g), qe is the amount of sorption at equilibrium (mg/g) and t the contact time (hr). After integration of equation (3) for the boundary conditions q = 0 at t = 0 and q = q at t = t, Equation (3) becomes:
 (4)
(4)
The plot of  vs t gives a straight line with a slope of −k1. Equation (4) can be rearranged to obtain:
 (5)
(5)
2.3.2. Pseudo Second Order Model
Another model for the analysis of sorption kinetics is pseudo second order. The pseudo second order equation can be written as follows [5,7-9]:
 (6)
(6)
where k2 is the rate constant of pseudo second order sorption (g/mg·hr). Integrating Equation (6) and applying the boundary conditions q = 0 at t = 0 and q = q at t = t, Equation (6) becomes:
 (7)
(7)
The plot of  vs t gives a straight line with slope of
  and intercept of
 . So the qe and k2 could be evaluated from the slope and intercept respectively. Equation (7) can be rearranged to obtain:
 (8)
(8)
2.4. Isotherm Model
In this study, the Langmuir and the Freundlich isotherm models were used to describe the equilibrium sorption data. To optimize the design of a sorption system, it is important to establish the most appropriate correlation for the equilibrium curves.
The Langmuir equation is widely used for adsorption equilibrium because of its thermodynamical basis. The Langmuir isotherm model assumes monolayer coverage of sorbet over a homogeneous sorbent surface, and at equilibrium, a saturation point is reached where no further sorption can occur. The Langmuir isotherm model is expressed as [10]:
 (9)
(9)
where qm is the maximum sorption capacity of the sorbent (mg/g) and kL is the Langmuir constant related to the affinity of the compound for the sorbent (l/mg). Equation (9) can be rearranged into a linear form:
 (10)
(10)
A graph with  as x-axis and
  as y-axis provides a line; kL and qm could be calculated from the slope and intercept of the line respectively.
The Freundlich isotherm is an empirical equation employed to describe heterogeneous systems and is expressed by the following equation [10]:
 (11)
(11)
where kF is the Freundlich constant related to capacity of sorbent (l/g) and n is the Freundlich exponent related to affinity the compound for the sorbent (dimensionless). Equation (11) can be rearranged into a linear form:
 (12)
(12)
A graph with  as x-axis and
  as y-axis provides a line; kF and n could be calculated from the intercept and slope of the line respectively.
2.5. Validity of Models
The validity of sorption models pseudo first order and pseudo second order checked from the linear plots of  vs t and
  vs t respectively. The validity of isotherm models Langmuir and Freundlich isotherms also checked from the linear plots of
  vs
vs  and
and  vs
vs  respectively. In this study the coefficient of determination, r2, was used to compare the applicability of the models [11]:
 (13)
(13)
where qmo is the modeled amount of phosphorus sorbet at time t, qme is the measured amount of phosphorus sorbet at time t and  is the average of qme.
3. Results and Discussion
3.1. Effect of Contact Time and Initial Concentration
Kinetics of phosphorus sorption governs the rate, which determines the residence time, and it is one of the important characteristics defining the efficiency of asorbent [12]. The kinetic behavior of phosphorus sorption onto the marble dust was examined by 120 hours contact time at various concentrations. The removal efficiency of the marble dust for phosphorus is illustrated in Figure 1, while the variation of sorption capacity of phosphorus with contact time for the marble dust is shown in Figure 2. It can be seen from these figures that the removal efficiency of marble dust after 12 hours were 32.0%, 60.0%, 74.6%, and 78.3% for initial concentrations 5, 30, 100, and 150 mg/l respectively. The rate of phosphorus removal was rapid initially, but it gradually becomes slower with passage of time reaching equilibrium almost at 24 hours. The initial faster rate may be due to the availability of the uncovered surface area of the sorbent initially, since sorption kinetics depends on the surface area of the sorbent [13]. The final removal efficiencies of the marble dust for phosphorus were 74.0%, 83.0%, 93.0%, and 94.3% for initial concentrations 5, 30, 100, and 150 mg/l respectively. The sorption capacity at equilibrium increases with an increase in the initial phosphorus concentration. The sorption capacity of the marble dust for phosphorus were 0.15, 1.02, 3.81, and 5.8 mg/g for initial concentrations 5, 30, 100, and 150 mg/l respectively.
3.2. Kinetic Modeling of Phosphorus Sorption
In order to investigate the mechanism of phosphorus
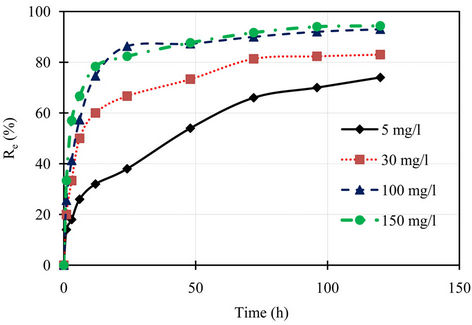
Figure 1. Percentage removal of phosphorus with time for different initial concentrations.

Figure 2. Phosphorus sorption capacity variation with contact time for different initial concentrations.
sorption by the marble dust, kinetic models were used to model the transport of phosphorus. Two kinetic models were used, pseudo first order and pseudo second order.
The pseudo first order plot of  vs t (Equation (4)) for the sorption of phosphorus for different initial concentrations is illustrated in Figure 3. The pseudo first order rate constant k1 obtained from the plotis shown in Table 1. The values of the rate constant k1 computed from the slope of the straight line. The results show weak compliance with the pseudo first order equation at high initial concentrations. The disagreements between the sets of data are reflected by the low coefficient of determination obtained and these values are shown in Table 1.
The pseudo second order rate constants k2 obtained from the plots of Equation (7). The values of the rate constant k2 (Table 1) computed from the intercept of the straight line. Figure 4 shows the plots of  vs t for sorption of phosphorus for the pseudo second order model and there are good agreements for all of initial concentrations. The good agreements between the sets of data are reflected by the extremely high coefficient of
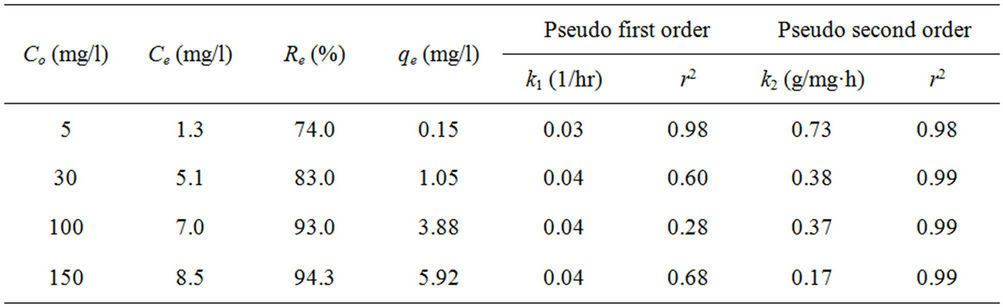
Table 1. Kinetic values for pseudo first and second order models.
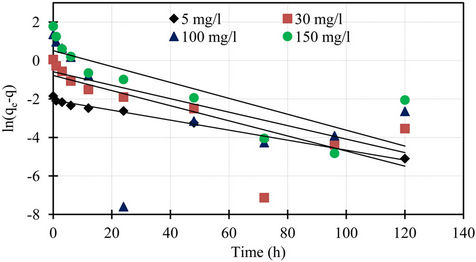
Figure 3. Pseudo first order kinetics of phosphorus for different initial concentrations.
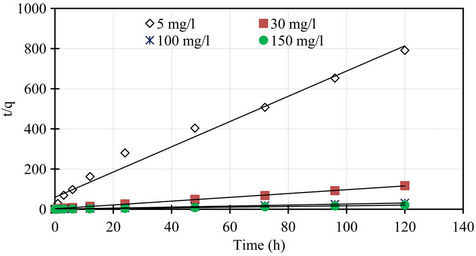
Figure 4. Pseudo second order kinetics of phosphorus for different initial concentrations.
determination obtained and these values are shown in Table 1. The results obtained from pseudo first and second order kinetic sorption model showed that the kinetic sorption is compliance with the second order model. Thus this second order kinetic model was taken as the best fit equation for the description of the mechanism of sorption of phosphorus. In addition, examination of the sorption capacity values of the pseudo second order model shows that the values were in the same range as the experimental sorption capacity values. Therefore, the sorption of phosphorus from aqueous solution onto the marble dust sorbent was found to follow the pseudo second order kinetic equation. Similar conclusion was also reported for the sorption of phosphorus onto various sorbent surfaces [5,8]. Furthermore, the pseudo second order is based on the assumption that sorption follows a second order mechanism, with chemisorption as the rate limiting step. So the rate of occupation of sorption sites is proportional to the square of the number of unoccupied Sites [14,15].
A comparison of the experimental phosphorus sorption with the profiles of pseudo first order and second order models for different initial concentrations shown in Figures 5 and 6, the data generated using the values of qe, k1, and k2 obtained from kinetic studies, clearly showed that the experimental data followed pseudo second order model at all initial concentrations.
3.3. Isotherm Model
Isotherm studies were done by applying the experimental data to the known Langmuir and Freundlich isotherms. Sorption isotherms of Langmuir and Freundlich are presented in Figures 7 and 8.
The Langmuir parameters of the maximum sorption capacity qm and the constant kL calculated from the intercept and the slope of the linear plot are showed in Table 2. Also the Freundlich parameters of kF and n obtained from the intercept and the slope of the linear plot are showed in Table 2. Both Langmuir and Freundlich isotherms describe with success the equilibrium sorption data of phosphorus sorbet onto the marble dust. The Langmuir isotherm fitting more accurately compared to Freundlich isotherm. The accurately of Langmuir isotherm is reflected by the extremely high coefficient of determination obtained, the coefficient of determination r2 values are 0.99 and 0.95 for Langmuir and Freundlich respectively.
4. Conclusion
The sorption of phosphorus onto marble dust was investigated by batch experiments, kinetic sorption model and isotherm model. The results showed that the sorption capacity of marble dust were 94.3%. Therefore, the present investigation on the removal of phosphorus suggests that the marble dust can be used as novel sorbent for phosphorus removal from aqueous solution. Furthermore, the marble dust as a waste of marble mining areas and marble industry production is not only economic sorbent
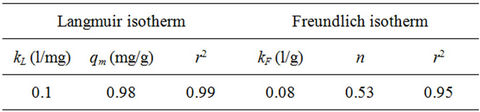
Table 2. Isotherm parameters of Langmuir and Freundlich for sorption of phosphorus on marble dust.
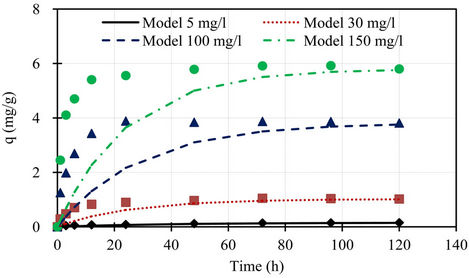
Figure 5. Comparison of the experimental phosphorus sorption with the profile of pseudo first order model for different initial concentrations.
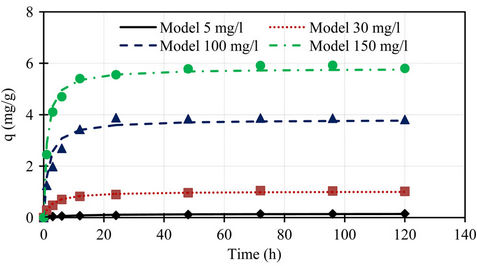
Figure 6. Comparison of the experimental phosphorus sorption with the profile of pseudo second order model for different initial concentrations.
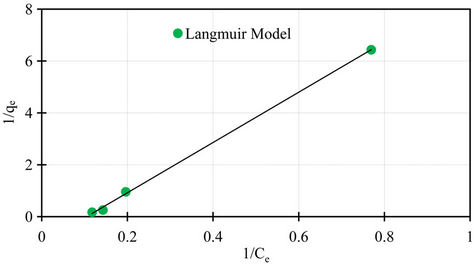
Figure 7. Langmuir isotherm for sorption data of phosphorus on marble dust.
can be used for phosphorus removal, at the same time solving the problem of waste residues from marble mining and industry processes. However, for phosphorus
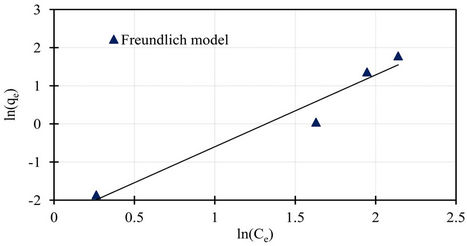
Figure 8. Freundlich isotherm for sorption data of phosphorus on marble dust.
sorption the kinetic model is important and significant in the rate controlling step and for the sorption of phosphorus onto marble dust the pseudo second order kinetics provides the best correlation with the experimental data.
5. Acknowledgements
Authors gratefully acknowledge the JSPS institutional program for young researcher overseas visits and JSPS Core-to-Core Program “Collaborative Project for Soil and Water Conservation in Southeast Asian Watersheds” for providing financial assistance for this study through Kyushu University.
REFERENCES
- D. Cordell, J. O. Drangert and S. White, “The Story of Phosphorus: Global Food Security and Food for Thought,” Global Environmental Change, Vol. 19, No. 2, 2009, pp. 292-305. doi:10.1016/j.gloenvcha.2008.10.009
- C. A. Prochaska and A. I. Zouboulis, “Removal of Phosphates by Pilot Vertical-Flow Constructed Wetlands Using a Mixture of Sand and Dolomite as Substrate,” Ecological Engineering, Vol. 26, No. 3, 2006, pp. 293-303. doi:10.1016/j.ecoleng.2005.10.009
- K. Adam, T. Krogstad, L. Vrale, A. K. Sovik and P. D. Jenssen, “Phosphorus Retention in the Filter Materials Shell Sand and Filtralite P®—Batch and Column Experiment with Synthetic P Solution and Secondary Wastewater,” Ecological Engineering, Vol. 29, No. 2, 2007, pp. 200-208. doi:10.1016/j.ecoleng.2006.09.021
- Y. Ann, K. R. Reddy and J. J. Delfino, “Influence of Chemical Amendments on Phosphorus Immobilization in Soils from a Constructed Wetland,” Ecological Engineering, Vol. 14, No. 1-2, 2000, pp. 157-167. doi:10.1016/S0925-8574(99)00026-9
- A. O. Babatunde and Y. Q. Zhao, “Equilibrium and Kinetic Analysis of Phosphorus Adsorption from Aqueous Solution Using Waste Alum Sludge,” Journal of Hazardous Materials, Vol. 184, No. 1-3, 2010, pp. 746-752. doi:10.1016/j.jhazmat.2010.08.102
- A. A. Augustine, B. D. Orike and A. D Edidiong, “Adsorption Kinetics and Modeling of CU(II) Ion Sorption from Aqueous Solution by Mercaptoacetic Acid Modified Cassava (Manihots Culenta Cranz) Wastes,” Electronic Journal of Environmental, Agricultural and Food Chemistry, Vol. 6, No. 4, 2007, pp. 2221-2234.
- S. Azizian, “Kinetic Models of Sorption: A Theoretical Analysis,” Journal of Colloid and Interface Science, Vol. 276, No. 1, 2004, pp. 47-52. doi:10.1016/j.jcis.2004.03.048
- S. Karaca, A. Gürses, M. Ejder and M. Açıkyıldız, “Kinetic Modeling of Liquid-Phase Adsorption of Phosphate on Dolomite,” Journal of Colloid and Interface Science, Vol. 277, No. 2, 2004, pp. 257-263. doi:10.1016/j.jcis.2004.04.042
- H. Yuh-Shan and E. O. Augustine, “Pseudo-SecondOrder Model for Lead Ion Sorption from Aqueous Solutions onto Palm Kernel Fiber,” Journal of Hazardous Materials, Vol. B129, 2006, pp. 137-142.
- G. Limousin, J. P. Gaudet, L. Charlet, S. Szenknect, V. Barthe’s and M. Krimissa, “Sorption Isotherms: A Review on Physical Bases, Modeling and Measurement,” Applied Geochemistry, Vol. 22, No. 2, 2007, pp. 249-275. doi:10.1016/j.apgeochem.2006.09.010
- H. Yuh-Shan, “Isotherms for the Sorption of Lead onto Peat: Comparison of Linear and Non-Linear Methods,” Polish Journal of Environmental Studies, Vol. 15, No. 1, 2006, pp. 81-86.
- K. A. Krishnan and T. S. Anirudhan, “Removal of Cadmium (II) from Aqueous Solutions by Team-Activated Sulphurised Carbon Prepared from Sugar Cane Bagasse Pith: Kinetics and Equilibrium Studies,” Water SA, Vol. 29, No. 2, 2003, pp. 147-156. doi:10.4314/wsa.v29i2.4849
- O. Eljamal, K. Sasaki and T. Hirajima, “Numerical Simulation for Reactive Solute Transport of Arsenic in Permeable Reactive Barrier Column Including Zero-Valent Iron,” Applied Mathematical Modelling, Vol. 35, No. 10, 2011, pp. 5198-5207. doi:10.1016/j.apm.2011.04.040
- W. M. Antunes, A. S. Luna, C. A. Henriques and A. C. A. D. Costa, “An Evaluation of Copper Biosorption by a Brown Seaweed under Optimized Conditions,” Electronic Journal of Biotechnology, Vol. 6, No. 3, 2003, pp. 174- 184.
- M. Fekri, N. Gorgin and L. Sadegh, “Phosphorus Desorption Kinetics in Two Calcareous Soils Amended with P Fertilizer and Organic Matter,” Environmental Earth Sciences, Vol. 64, No. 3, 2011, pp. 721-729.