Journal of Environmental Protection
Vol.3 No.11(2012), Article ID:24723,16 pages DOI:10.4236/jep.2012.311162
Comparison of the Groundwater Quality in the West Tahta Area, Upper Egypt in 1989 and 2011
![]()
1Department of Applied Geoscience and Geophysics, Montan University, Leoben, Austria; 2Department of Geology, Faculty of Science, Minia University, El-Minia, Egypt; 3National Authority for Remote Sensing and Space Sciences (NARSS), Cairo, Egypt.
Email: esamismail79@yahoo.com
Received February 22nd, 2012; revised July 8th, 2012; accepted August 17th, 2012
Keywords: Under Groundwater; Withdrawal; West Tahta; Evaluation of Groundwater
ABSTRACT
Egypt is characterized by arid climate with rare rainfall that means surface water. The River Nile is the main source of water supply. The study area is located in Upper Egypt in the western desert. The area under investigation is subjected to intensive development in the last twenty years, clearly seen in the change of the agriculture and urban areas. The rapid increase of the population in Egypt especially in the upper part leads to an increasing demand for houses on the old cultivated land lead to the migration towards the desert and reclaimed new areas. These new reclaimed areas are depending on the ground water. The extensive use of groundwater and increasing fertilizing system leads to the change of the water table, characterization and quality. In this study we use the analysis of 30 groundwater samples collected and analyzed in 1989 and 28 groundwater samples collected and analyzed in 2011 from the same area to identify the change in the quality of the ground water. According the hydrogeologic data which were collected from the study area in 1989 and 2011 we found a changing water table decreasing, from 1 to 48 m in 1989 and 5 to 60 m in 201. The water level is decreasing in the same direction towards the River Nile. The sufficient recharge and leaching and dissolution of the aquifer materials due to extensive use lead to increase in TDS which reaching to 4453 ppm in 2011. The water type in the 1989 samples is mainly NaHCO3 and in 2011 samples Na2SO4. Grid classification shows that the water samples collected in 1989 are mainly sodium bicarbonate and sodium chloride extending to sodium sulphate while the water samples collected in 2011 are mainly sodium sulphate and sodium chloride. Most of the 1989 groundwater samples are suitable for drinking purposes while majority of the 2011 groundwater samples are not suitable due to high salinity.
1. Introduction
Water is the most important natural resource for life on Earth. Fresh surface water can be reached easily for consumption in most countries except for countries in desert areas such as in Africa. The study area are located in the Upper Egypt (Figure 1), Egypt are characterized by arid climate, very rapid growth population and limited surface fresh water. To solve the problem of population it must be constrain a new towns and reclaimed new areas for agriculture. This leads to change in the agriculture area and urban area from 1989 and 2011 the agriculture area in 1989 is 345.74 Km2 while it reached to about 363.6 Km2 in 2009 with total increase in the agriculture area from 1987 to 2009 about 17.86 Km2 with average annual rate 0.812 Km2/year and the total urban area in 1987 are 60.34 Km2 and in 2009 it reached to 82.66 Km2 with total increase in the period from 1987 to 2009 about 22.31 Km2 and average annual rate 1.01 Km2/year. This increase in the agriculture and urban areas leads to reclaimed new area. The new reclaimed area are mainly depends on the underground water. The extensive withdrawal and use of old irrigation methods (flood method) as well as sufficient recharge all these reasons leads to increase the depth to water and also decrease the water level in the aquifer. The main purpose of this study is identifying the change in the quality of groundwater in the period from 1989 to 2011.
We used the chemical analysis of 30 groundwater samples which collected and analyzed by [1] and 28 groundwater samples collected from the same area and analyzed in 2011 (Figure 2). The results are used to comparing between the hydrochemical properties of the samples and identify the change in the water quality from 1989 and 2011.
According to Said [2,3] the rock units of the study area and its neighboring are sedimentary origin it ranging from Tertiary to Quaternary age. The Holocene deposits contain all series of unconsolidated sediments, accumu-
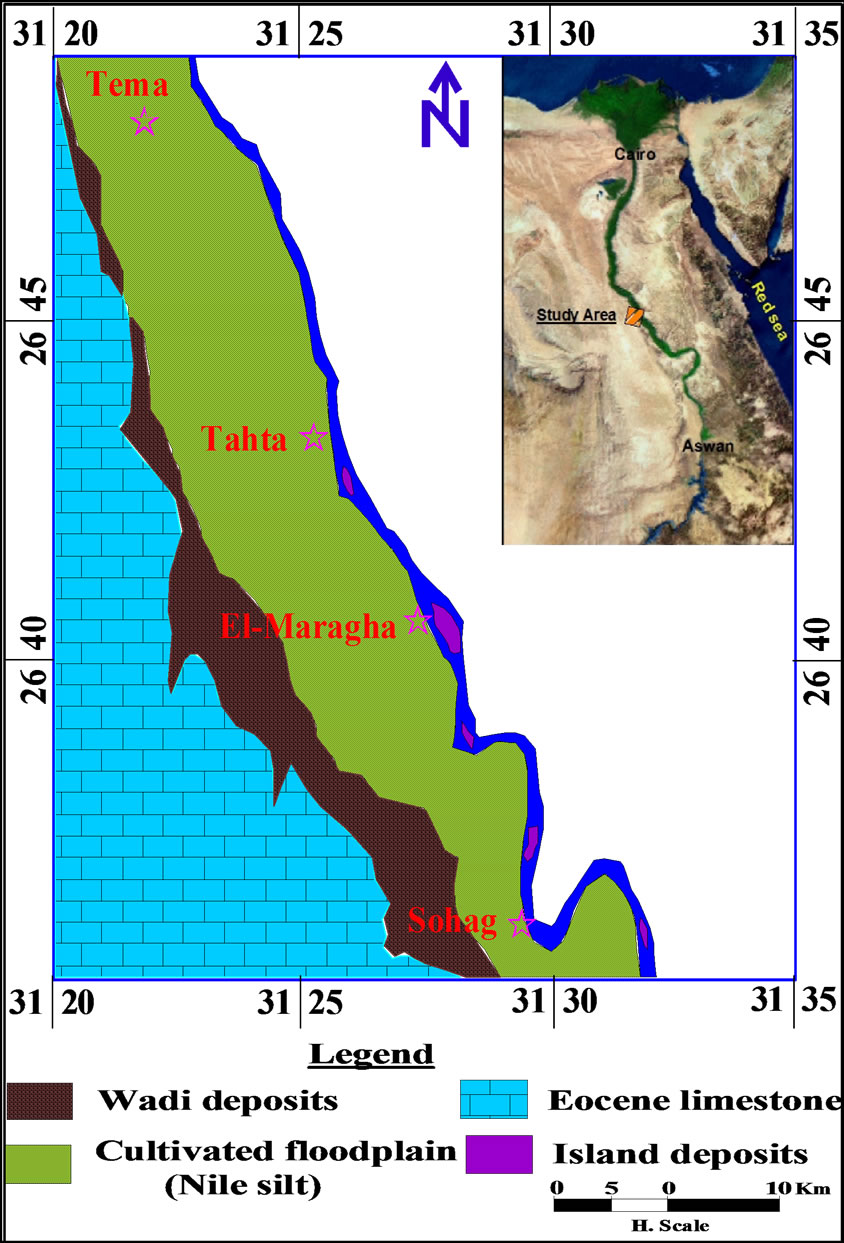
Figure 1. Location and geologic map of the study area (after El-Sayed Sedek Abu Seif, 2010).
lated under different environmental conditions. These deposits represented by Nile silt, wadi deposits and fanglomerates.
Pleistocene deposits represented the main water bearing formation in the Nile Valley and composed of sands and gravels with intercalations of clay, they are directly underlies the Holocene deposits and overlies the Pliocene clay and Eocene fractured limestone. Pliocene deposits consist of a lower marine sequence and an upper fluvial sequence. They are represented by dark colored clays inter-bedded with sandstone lenses. The Pliocene deposits lie below the Pleistocene deposits and act as a thick impermeable one below it. The Eocene limestone is bounded the Nile Valley in both the eastern and western sides as scarps, and made up of carbonates intercalated by clays, shale and sands.
2. Hydrogeological and Hydrogeochemical Data
The study area lies in Sohag Governorate, this Governorate belongs to the arid belt of Egypt where it characterized by long and hot summer, warm winter and scarce rainfall except the occasional storms. During the period between 1960 and 1998, the average value of precipitation in Sohage Governorate, was recorded as 2.25 mm/year [4]. The average maximum values of air temperature is (36.5˚C) which are recorded in summer and the minimum one is (15.5˚C) are recorded in winter. The relative humidity in winter is higher than in summer and it varying between 35 and 61% [5]. The Nile Valley in the study area characterized by one aquifer system (Quaternary aquifer), this aquifer system consists of fluvial sands with minor conglomerate and clay. It is capped with sands with the Neonile silt and fine-grained sands that constitute the base of the cultivated lands. Along the eastern and western fringes, the Neonile silty layer is replaced by the recent sediments. Therefore, the aquifer system in the floodplain is under semi-confined condition, but in the desert fringes it is under unconfined condition. The penetrated thickness of the aquifer system varies from 150 m in the central part of the flood plain to about 50 m in the desert fringes. The average hydraulic conductivity of the aquifer is about 70 m/day; while it reaches 4 cm/day for the salty top layer [6]. The Quaternary aquifer is recharged mainly from the dominant surface water, especially from the irrigations canals which play the main role in the configuration of the water table, while the discharge of this aquifer is take place during the evaporation process, connection with the underlying aquifer and the river that acts as an effluent stream in most of its parts.
The hydrogeological data of 1989 are based on the information which collected for fifty six wells distributed in the study area, and information of 28 wells collected in 2011. This data are used to mapping the water table and water level of the groundwater. The hydrogeochemical aspects are evaluated in the present work based on the chemical analysis of 1989 and 2011 water samples. Salinity contour map carried out to show the direction of salinity increase. Major cations and major anions were measured in the lab (Tables 1 and 2) and the results are used to calculate the ion dominance, sodium adsorption ratio and water types. Piper diagram applied for the study water samples to define the water origin and grid classification are applied to show the water type. The results are compared with the world health organization tables to evaluate the water samples for different purposes and the US Laboratory Staff’s diagram are used to evaluate the water samples for irrigation.
3. Result and Discussion
The hydrogeologic data of the groundwater samples show that, the main flow direction of the groundwater is northeast direction toward the River Nile (Figures 3 and 4) this is due to the influence of canals recharging. The water table are affected in the study area by the extensive withdrawal from 1989 and 2011, in 1989 the depth to water is ranged between 1 to 48 m and from 5 to 60 m in
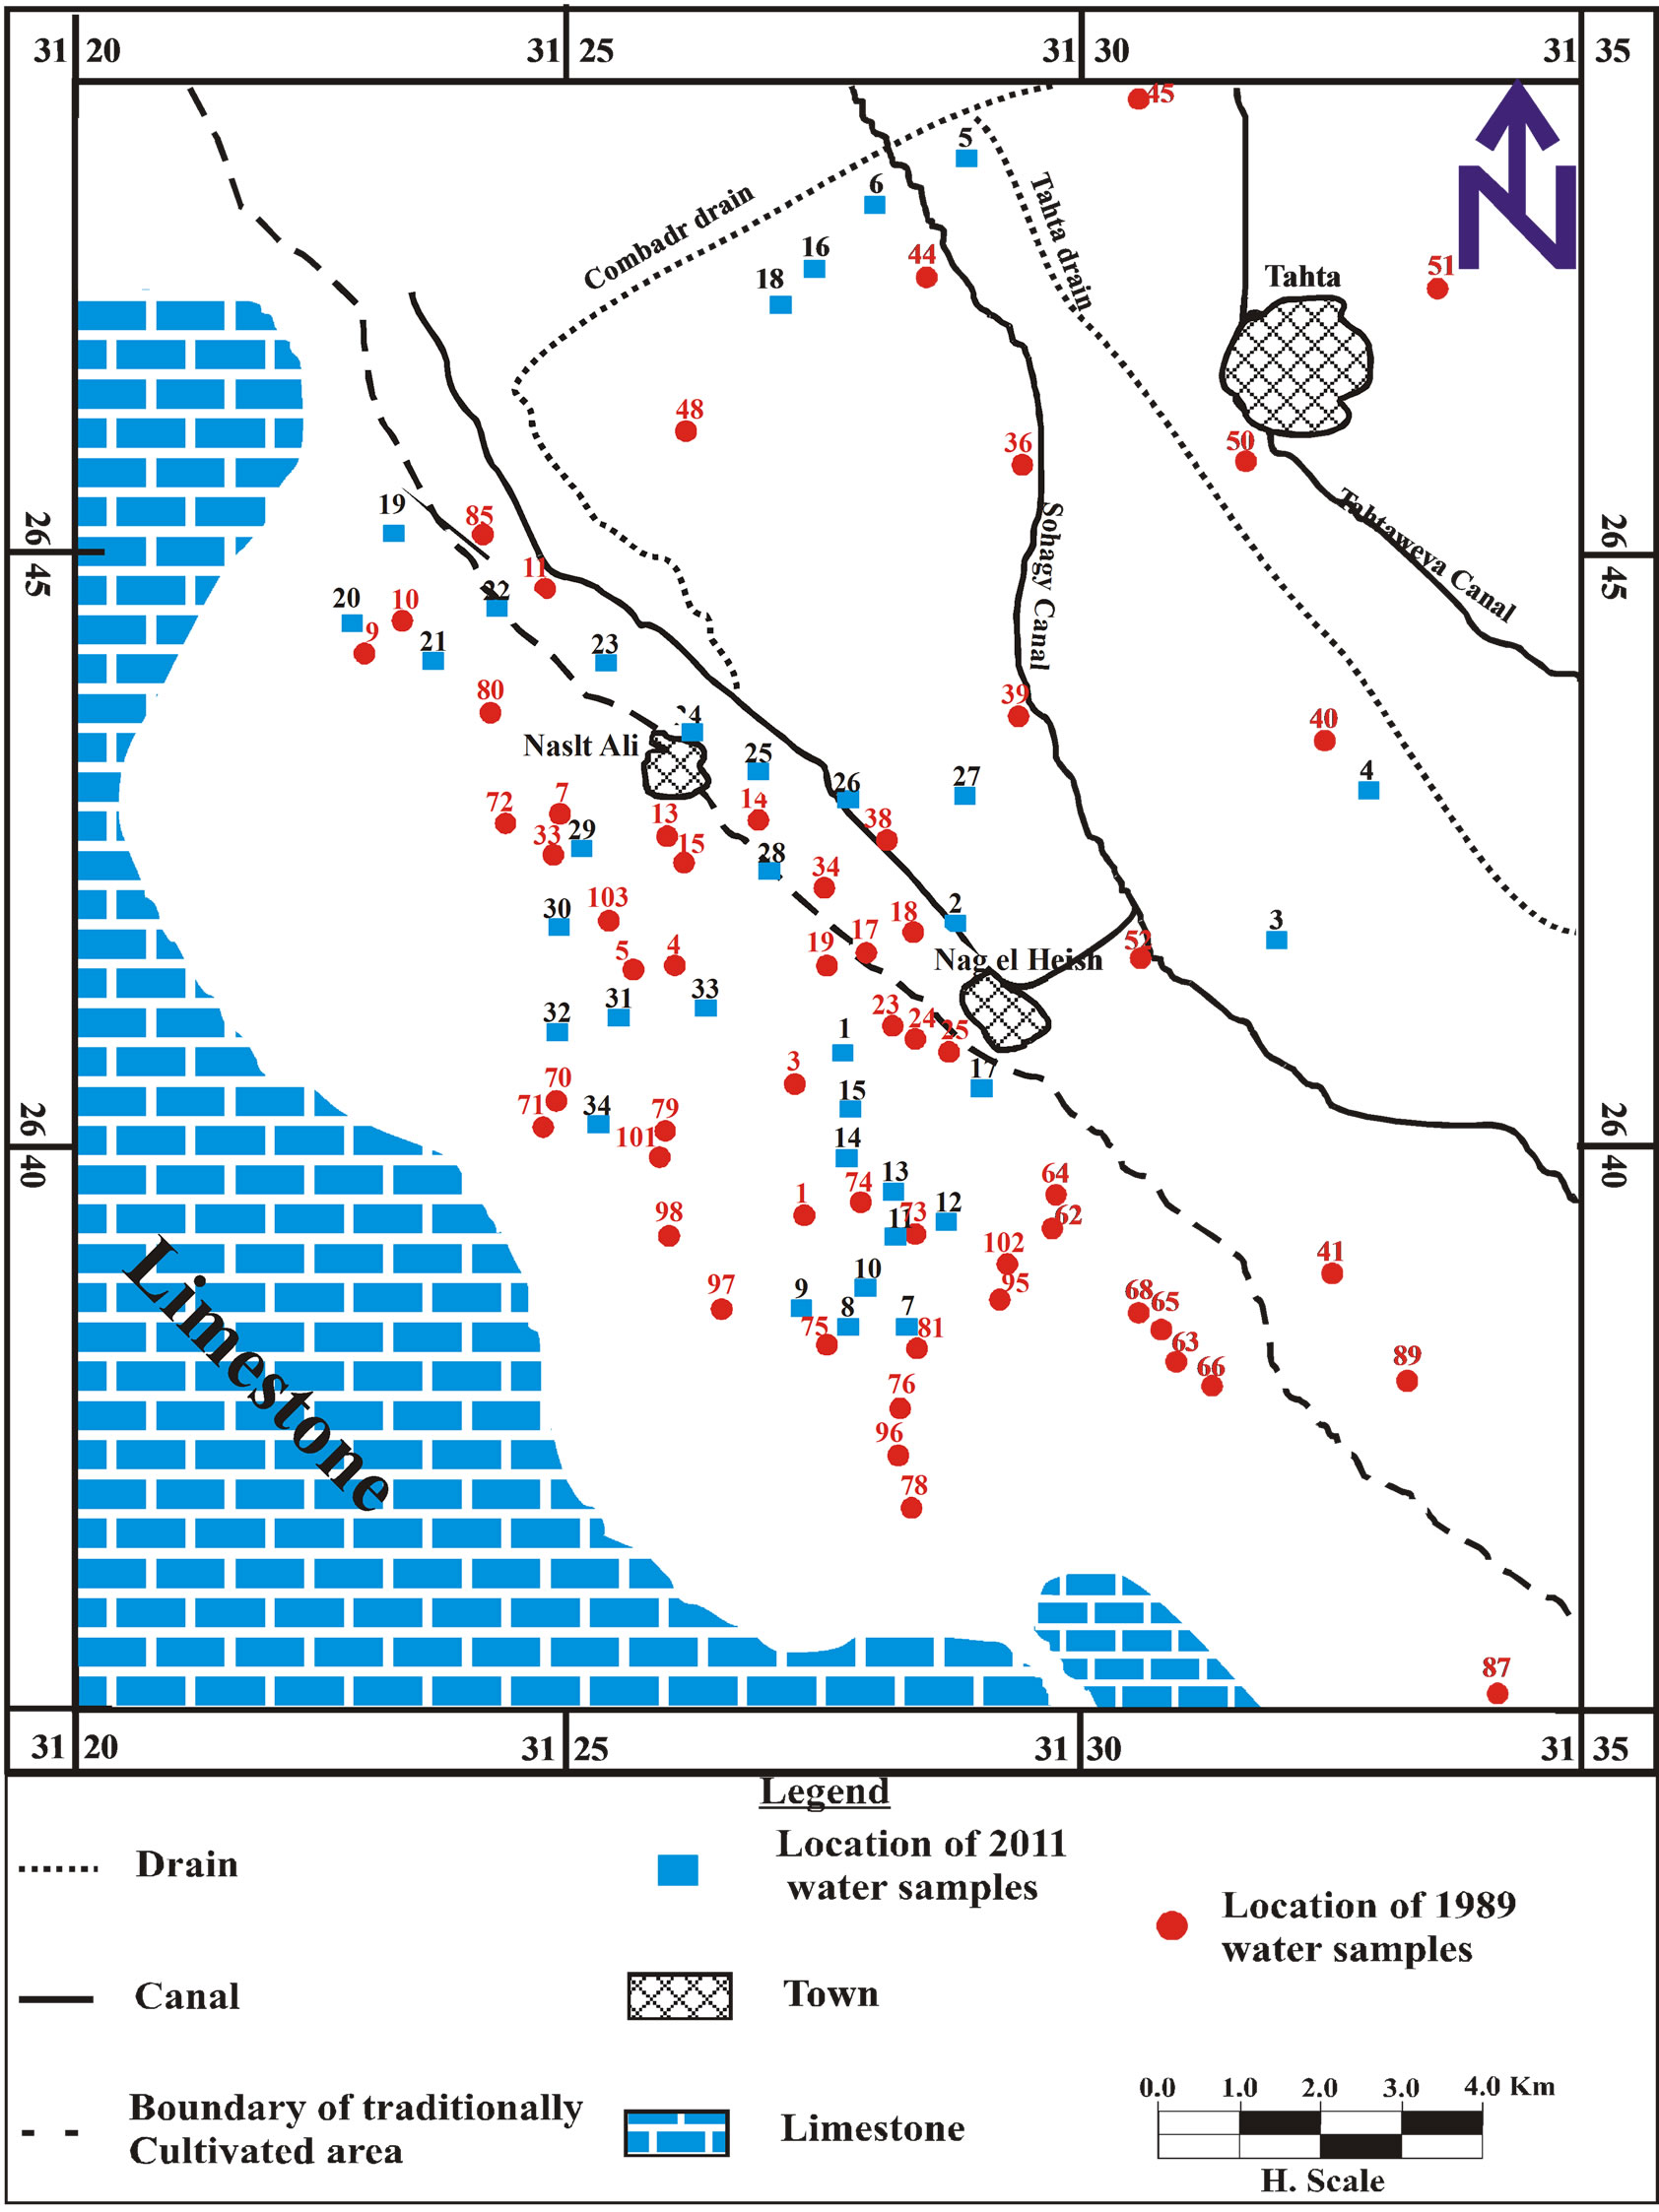
Figure 2. Location map of the productive wells of the study area.
2011 (Figures 5 and 6). The hydraulic gradients are relatively moderate and regular, except the areas of water depressions, where these gradients become steeper in north-eastern and south-western portions [7].
The salinity of groundwater collected in 1989 varies between fresh and slightly saline water, where it ranges between 205 to 2880 ppm. Salinity of samples collected in 2011 ranged between fresh and moderately saline water (between 184 and 4448 ppm) according [8] classification. Increase of salinity from 1989 to 2011 is attributed to leaching processes and dissolution of limestone with affected of extensive withdrawal, as well as the effect of direct evaporation from the surface through the irrigation water system prevailing the area.
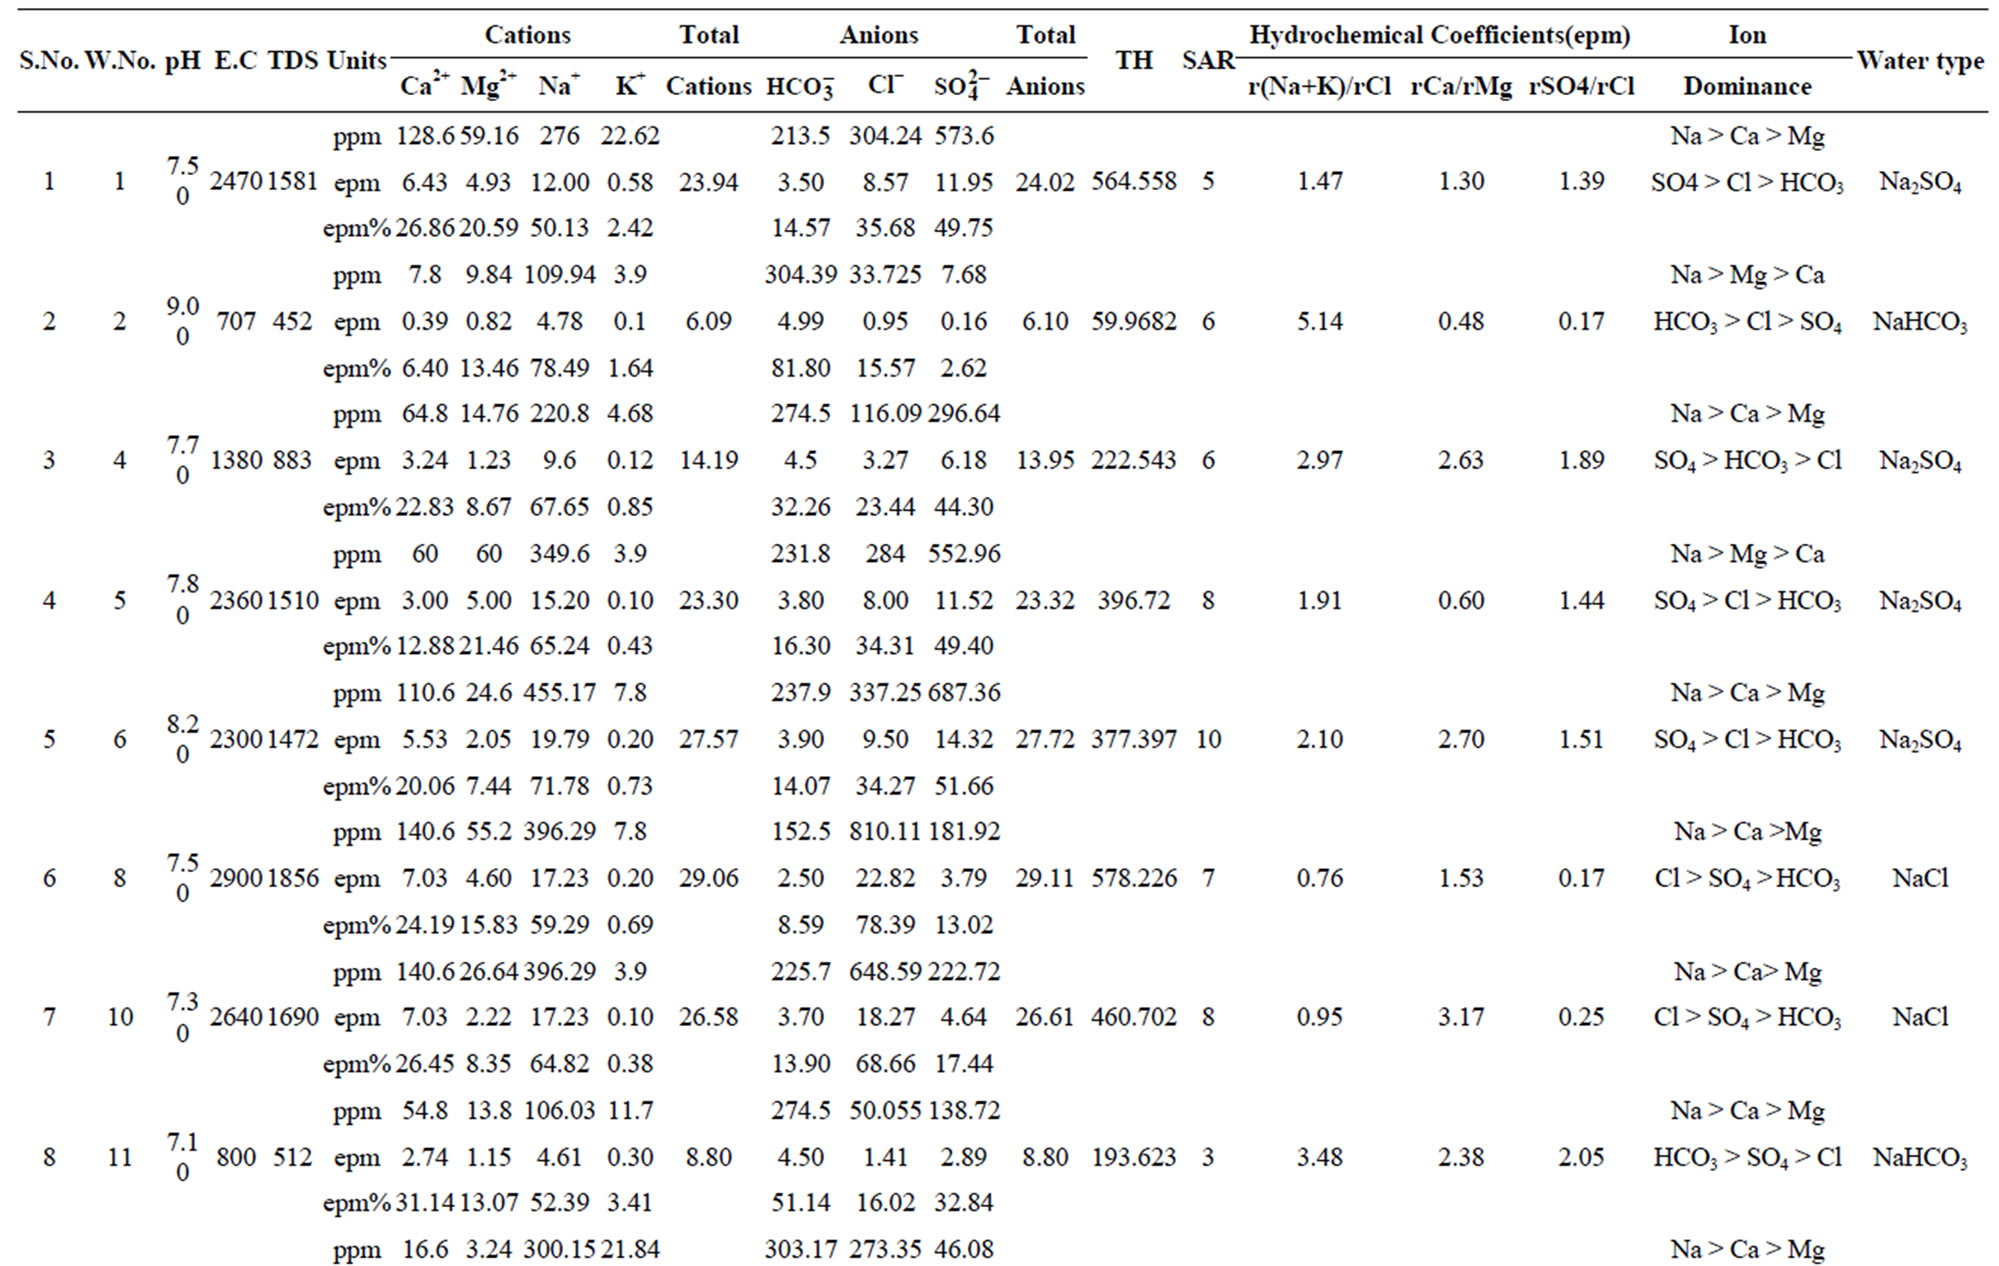

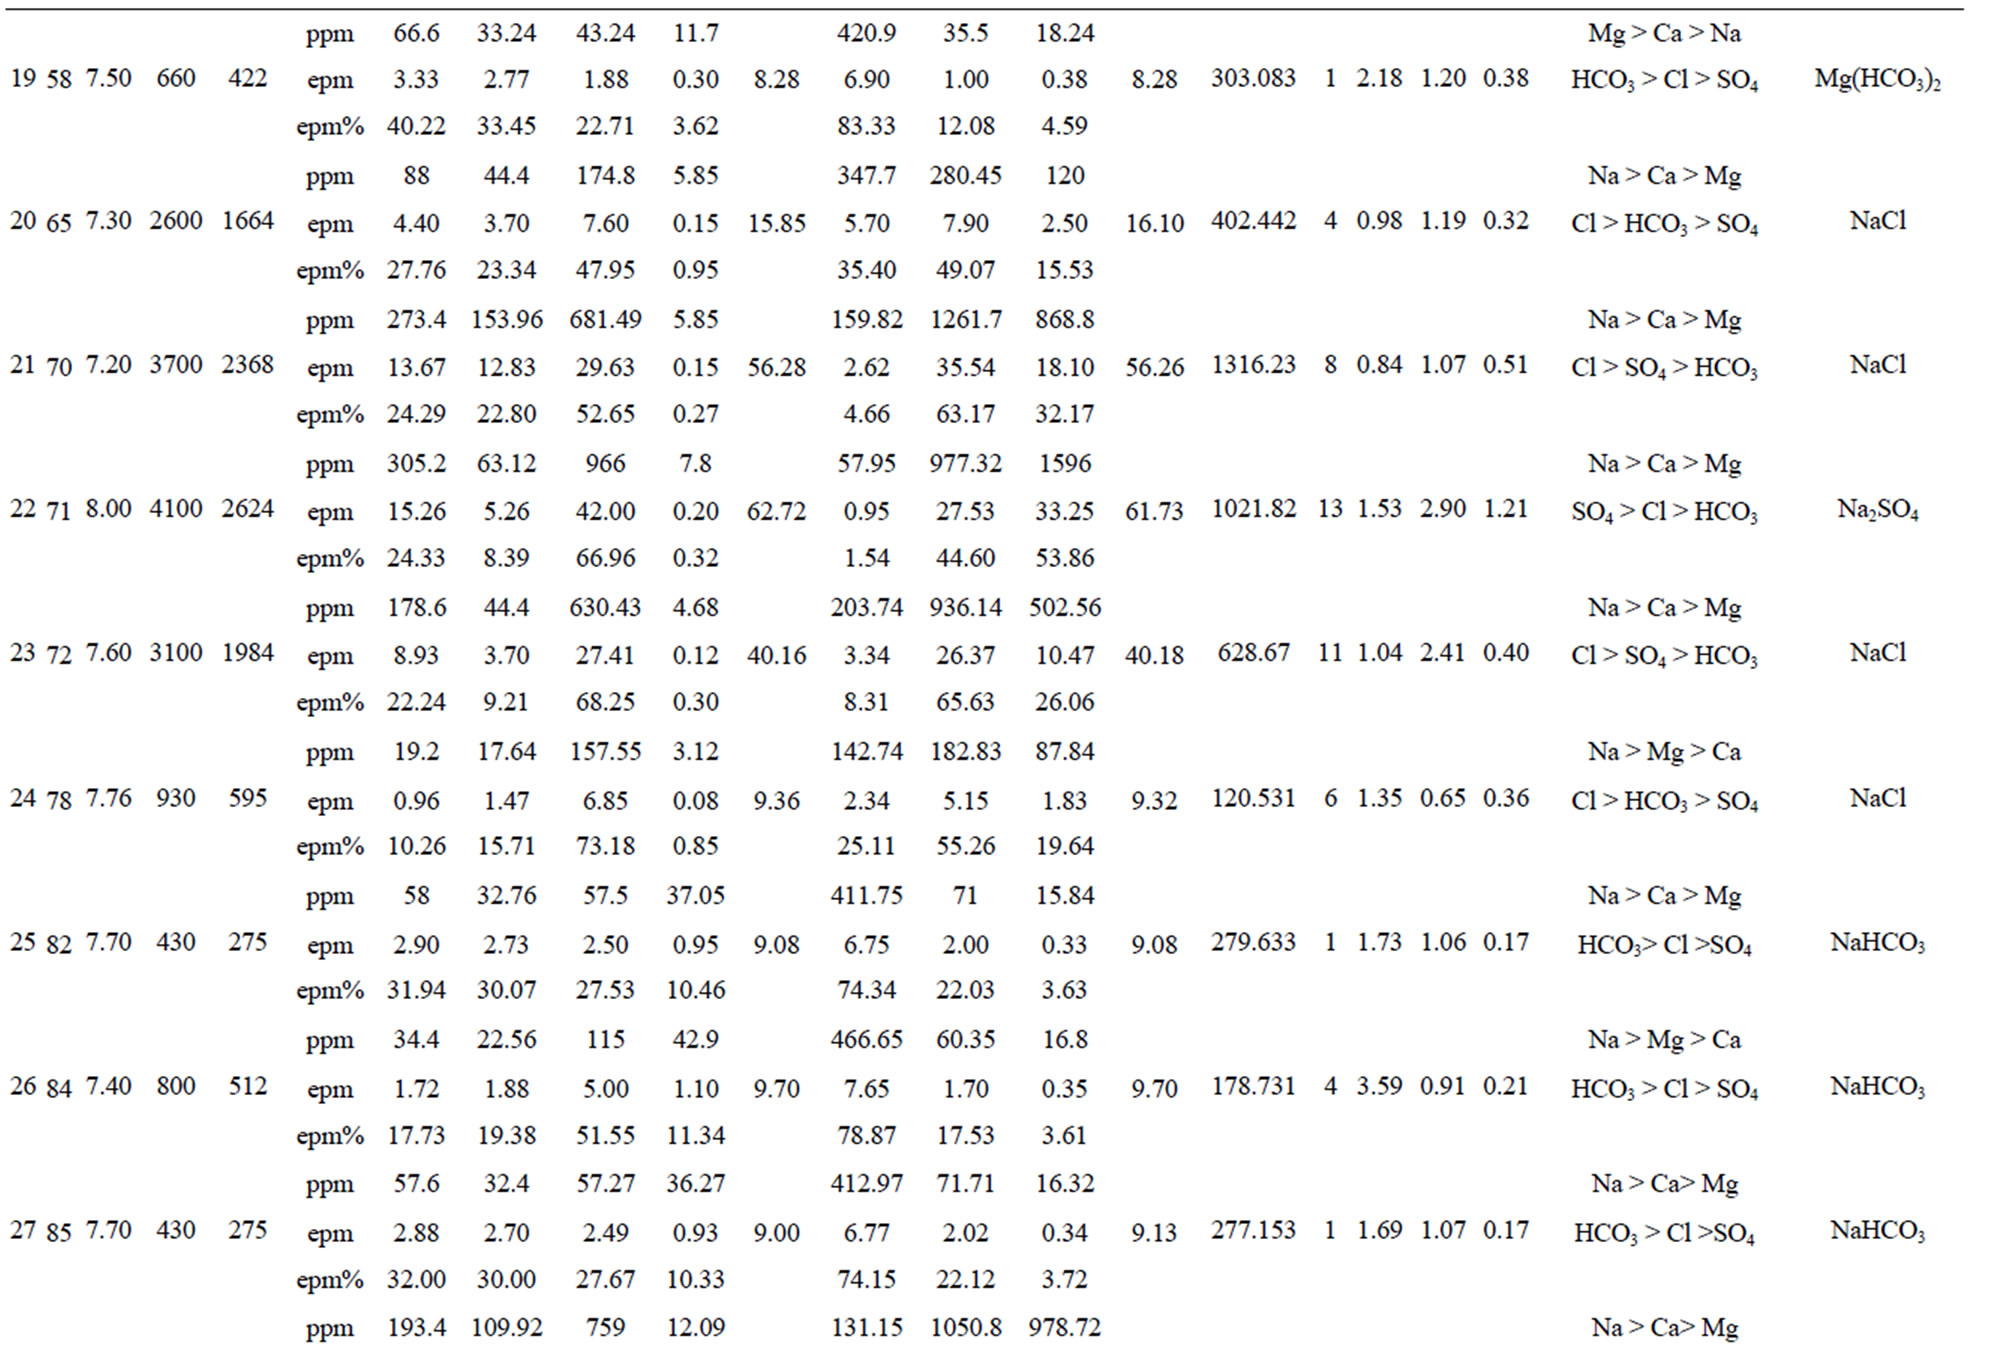
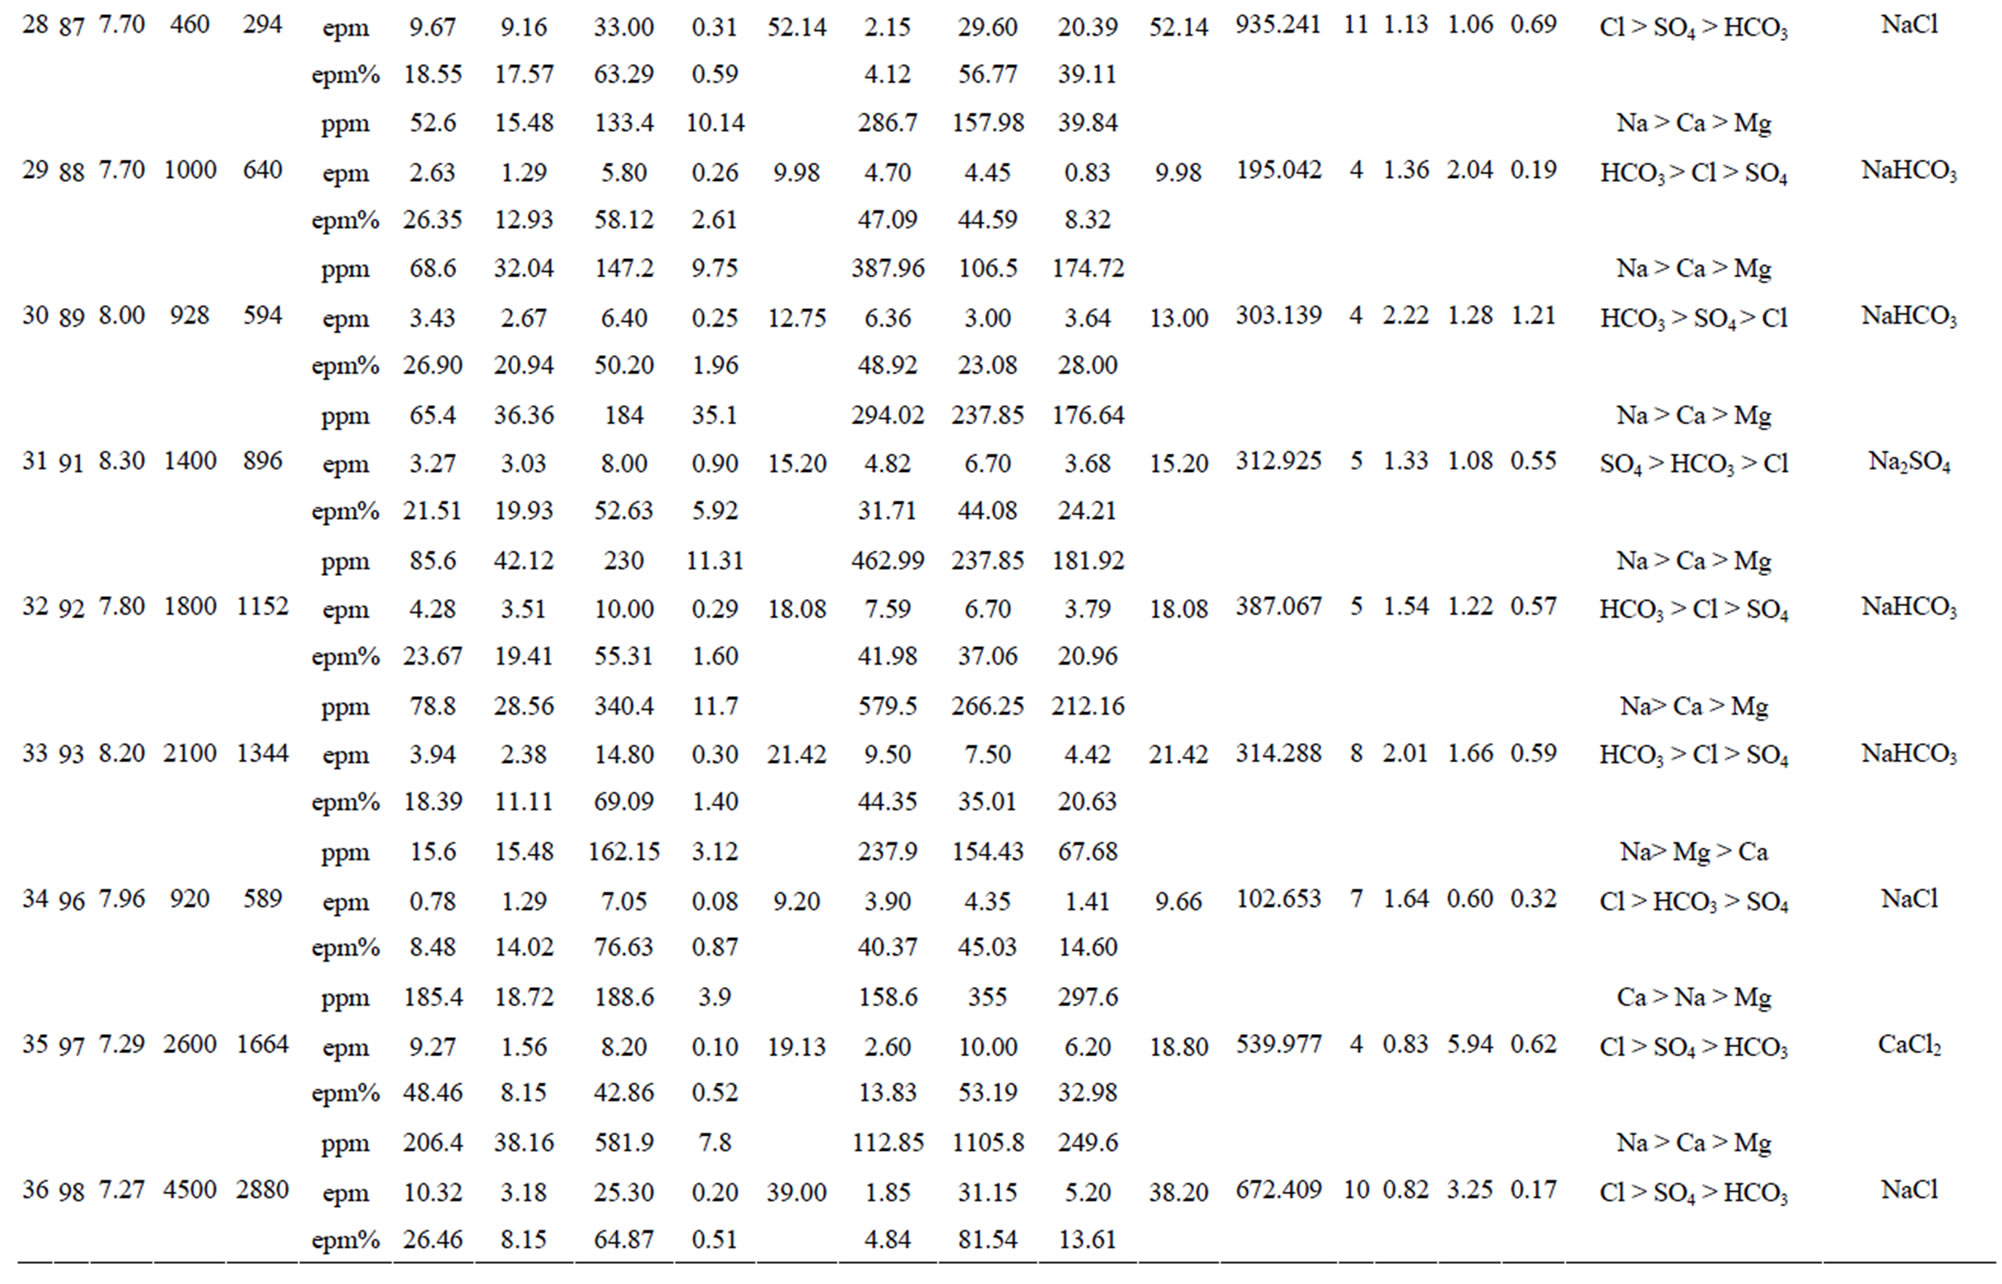
Table 1. Chemical analysis data and hydrochemical parameters of the 1989 groundwater samples.

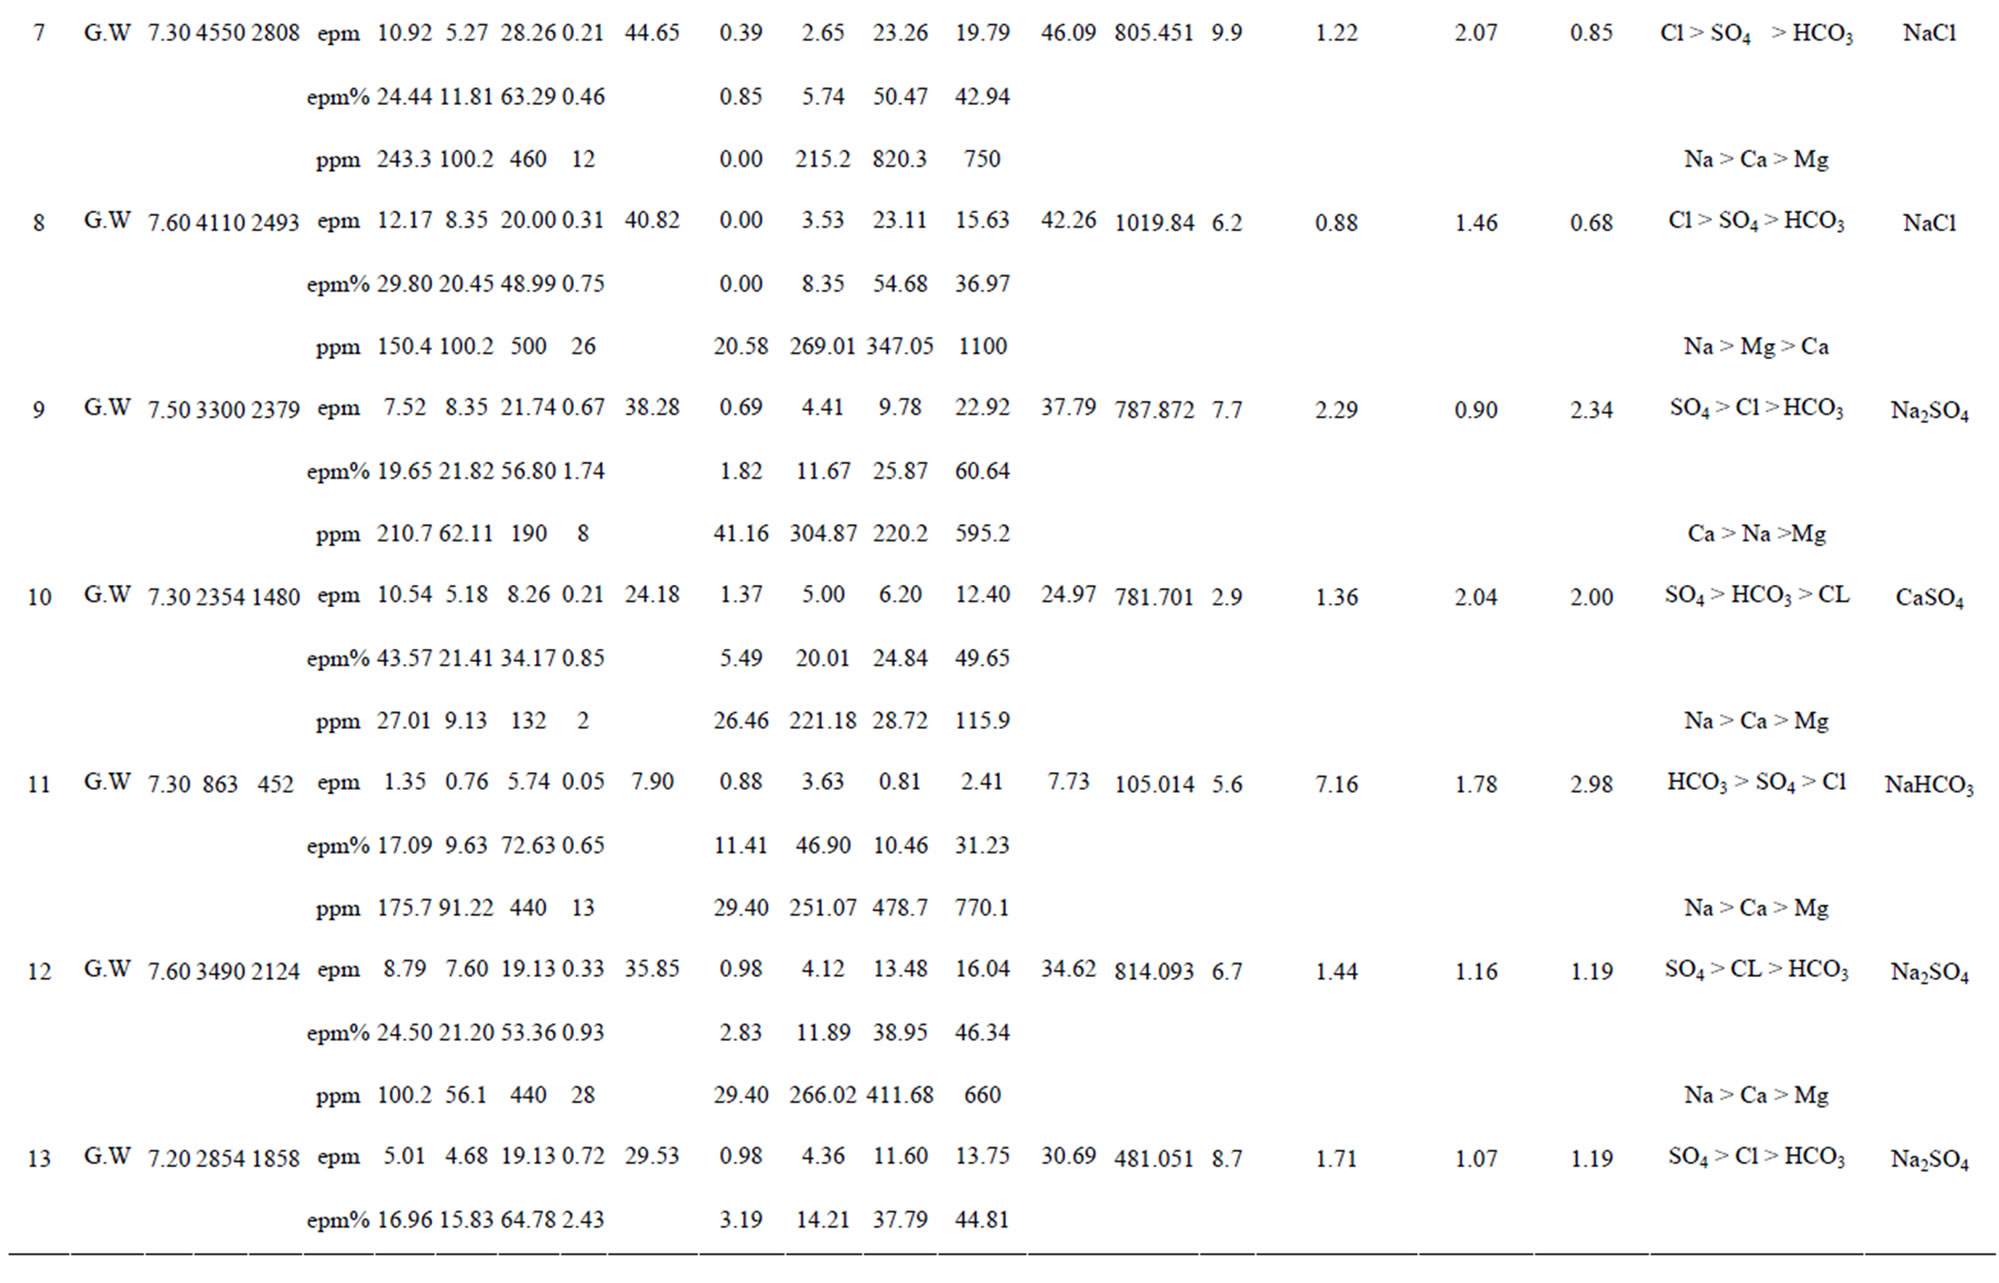

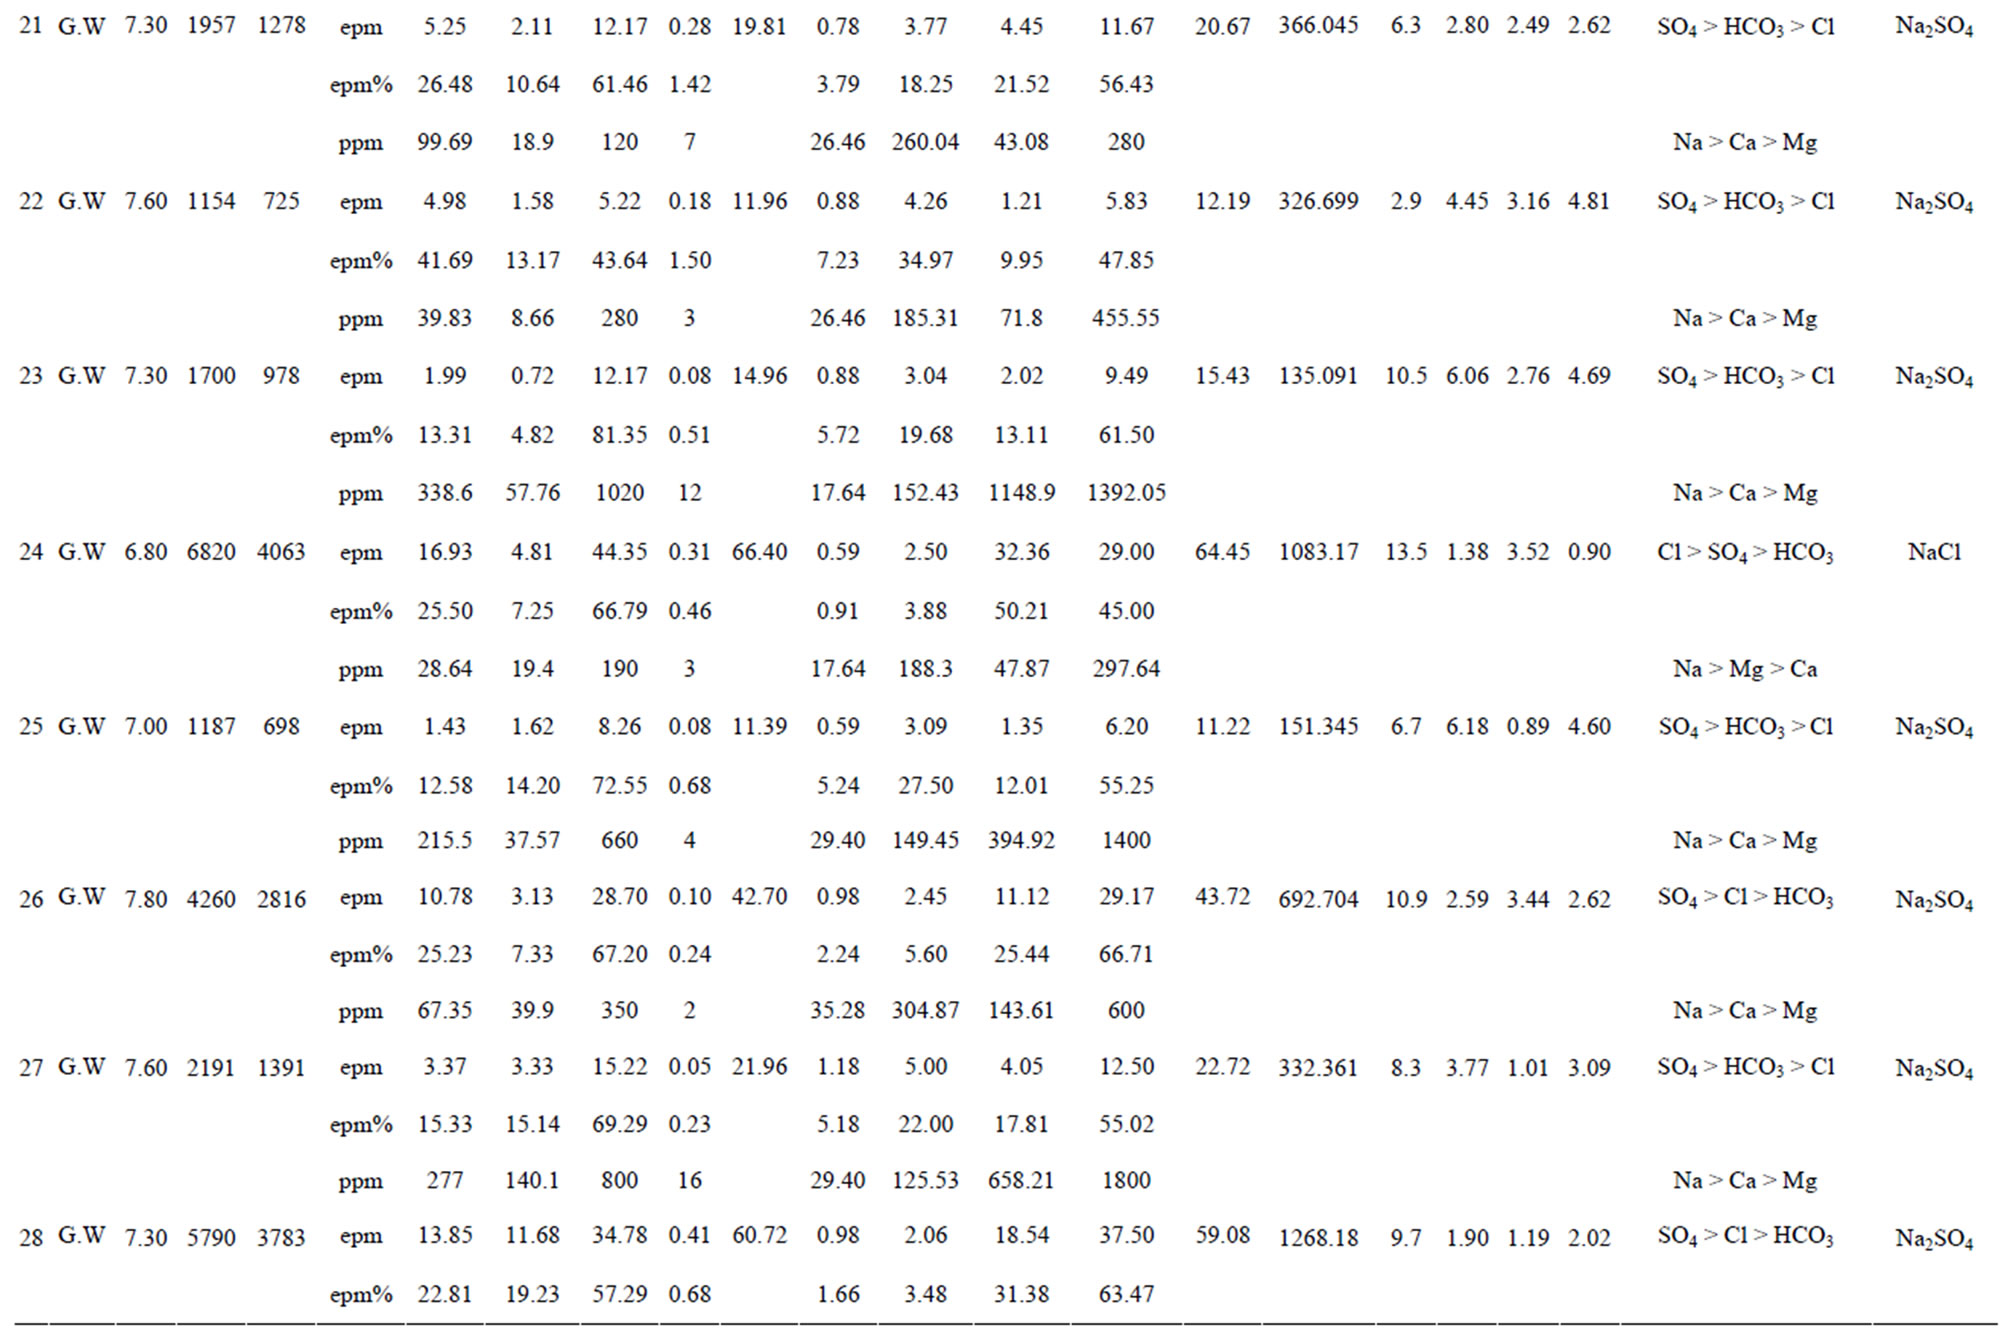
Table 2. Chemical analysis data and hydrochemical parameters of the 2011 water samples.
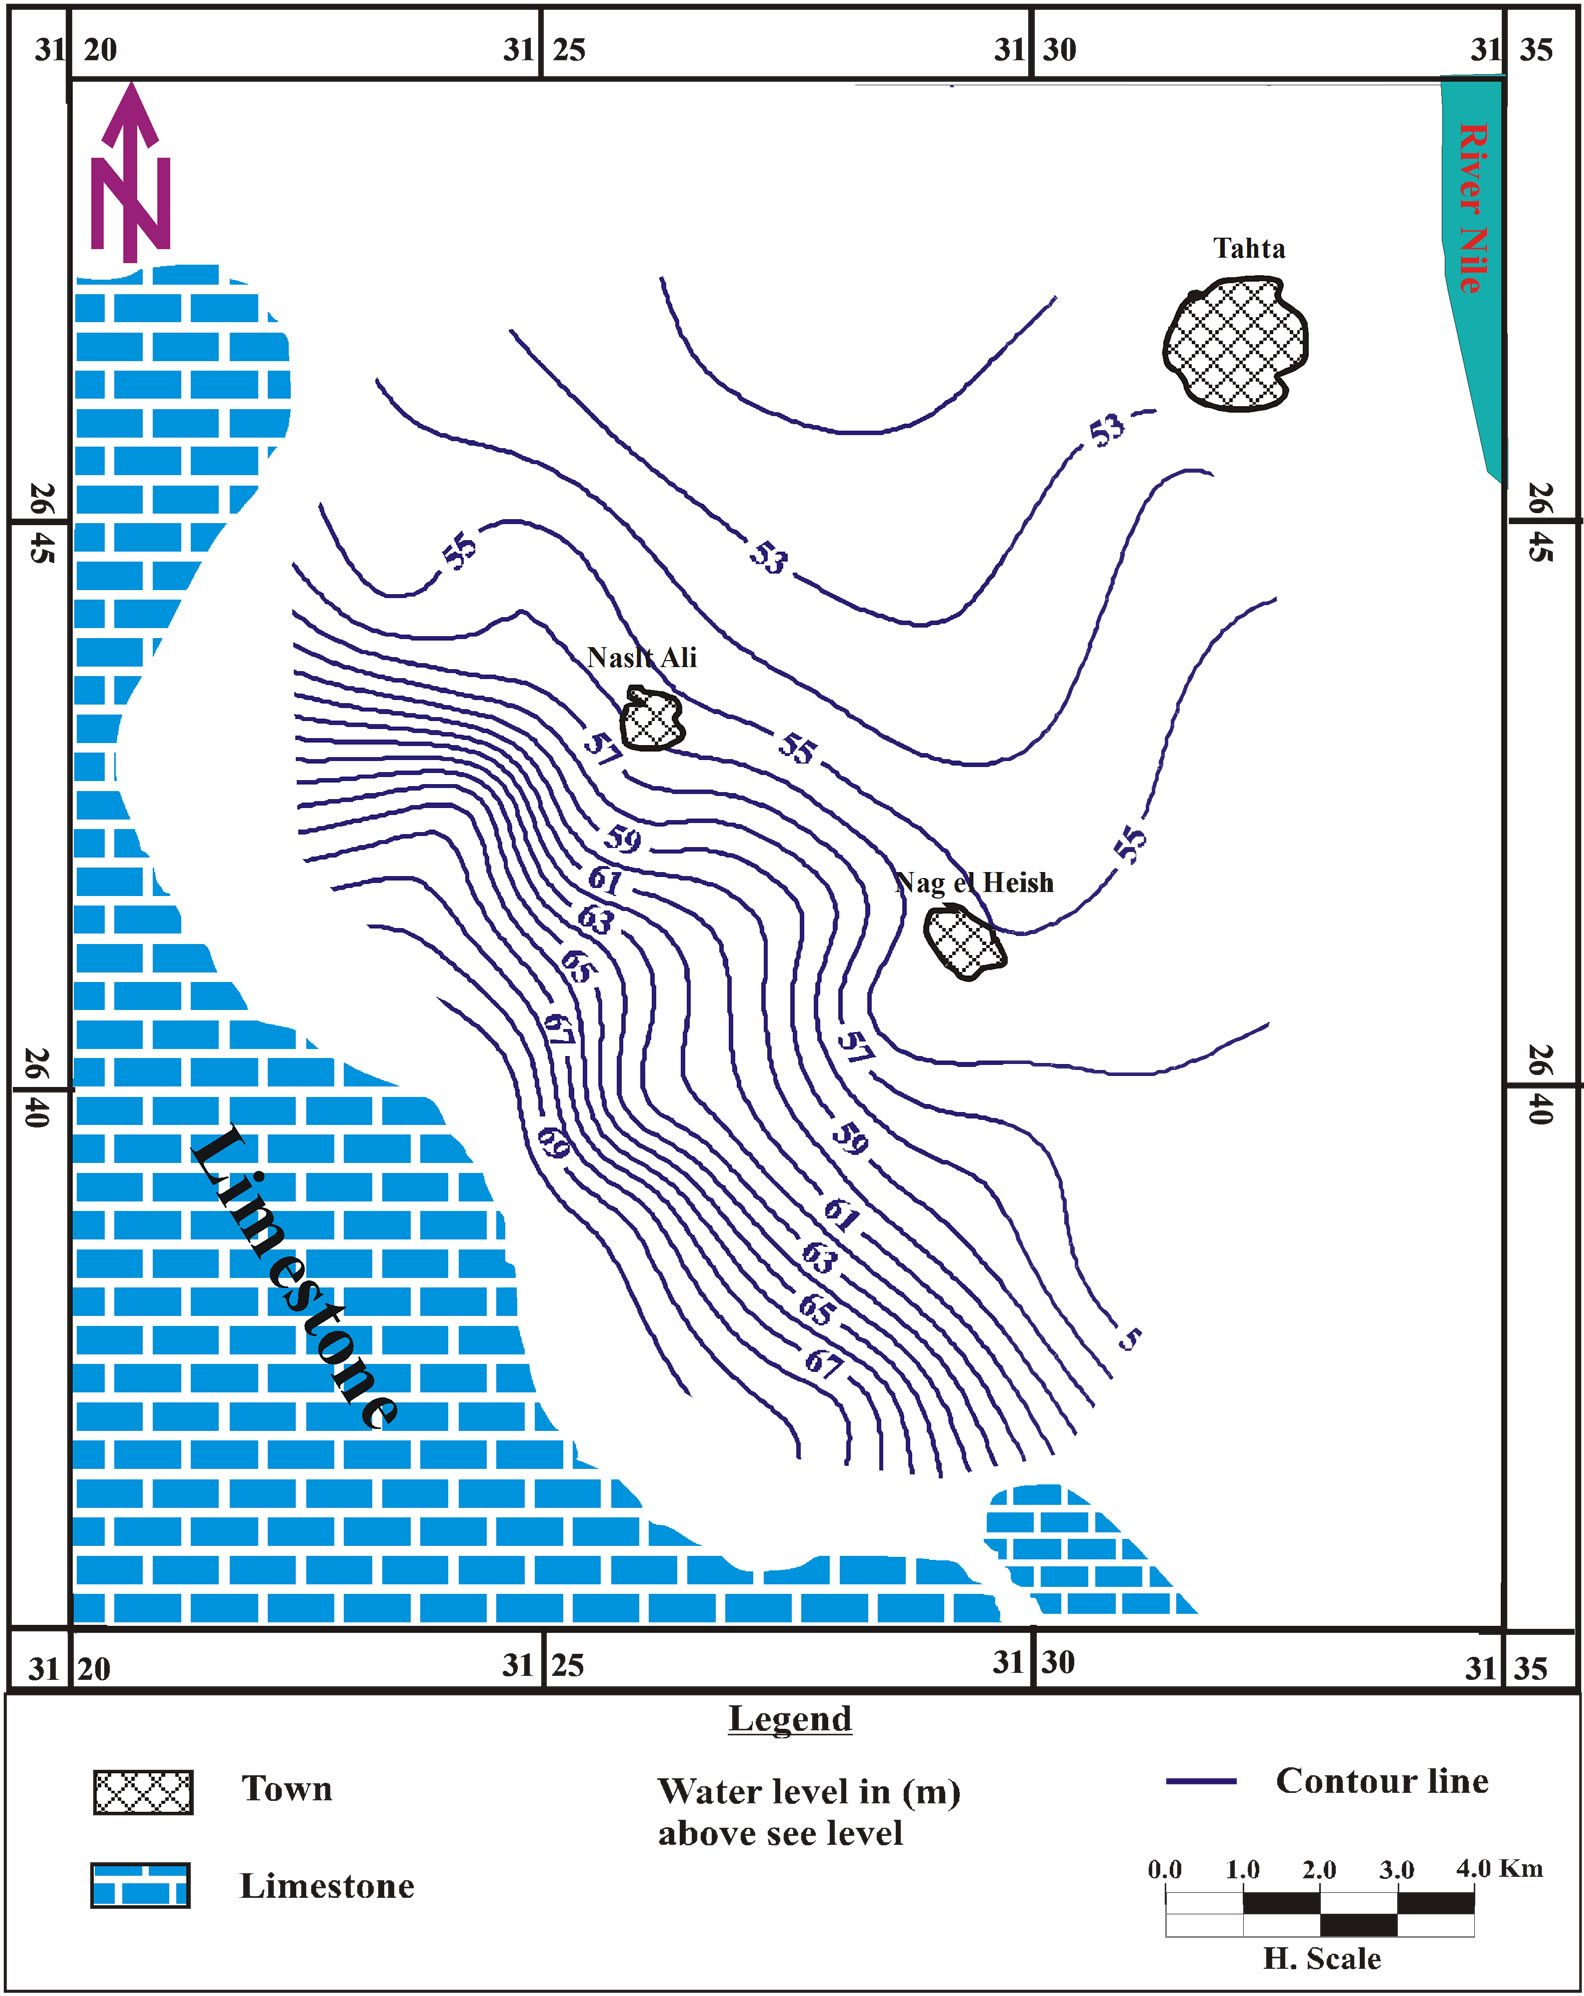
Figure 3. Water level contour map 1989.
The iso-salinity contour maps (Figures 7 and 8) showed that, salinity of the area under investigation increases from east to west with no change from 1989 and 2011. This reflecting the impact of the leaching and dissolution of limestone deposits to the west of the study area.
Total hardness is the most important parameter effect in the use of water for different purposes. According [9], [10,11] the total hardness (TH) in ppm was determined by following equation TH = 2.497Ca2+ + 4.115Mg2+. Hence, classification of the groundwater collected in 1989 and 2011 [12] has been carried out and presented in the Table 3.
The high total hardness in the samples collected in 2011 reflect the high dissolution of the limestone The dominant chemical water types of the groundwater samples collected in 1989 are NaHCO3, and NaCl. Most of groundwater samples collected in 2011 have Na2SO4 water type. This means that, chemical of the groundwater of the study area are affected during time due to extensive withdrawal from the aquifer and also extensive using of fertilizers. By applying the Trilinear diagram introduced by [13] (Figure 9), we noticed that, about 61% and 86% from 1989 and 2011 water samples respectively are meteoric origin, 25% and 11% from
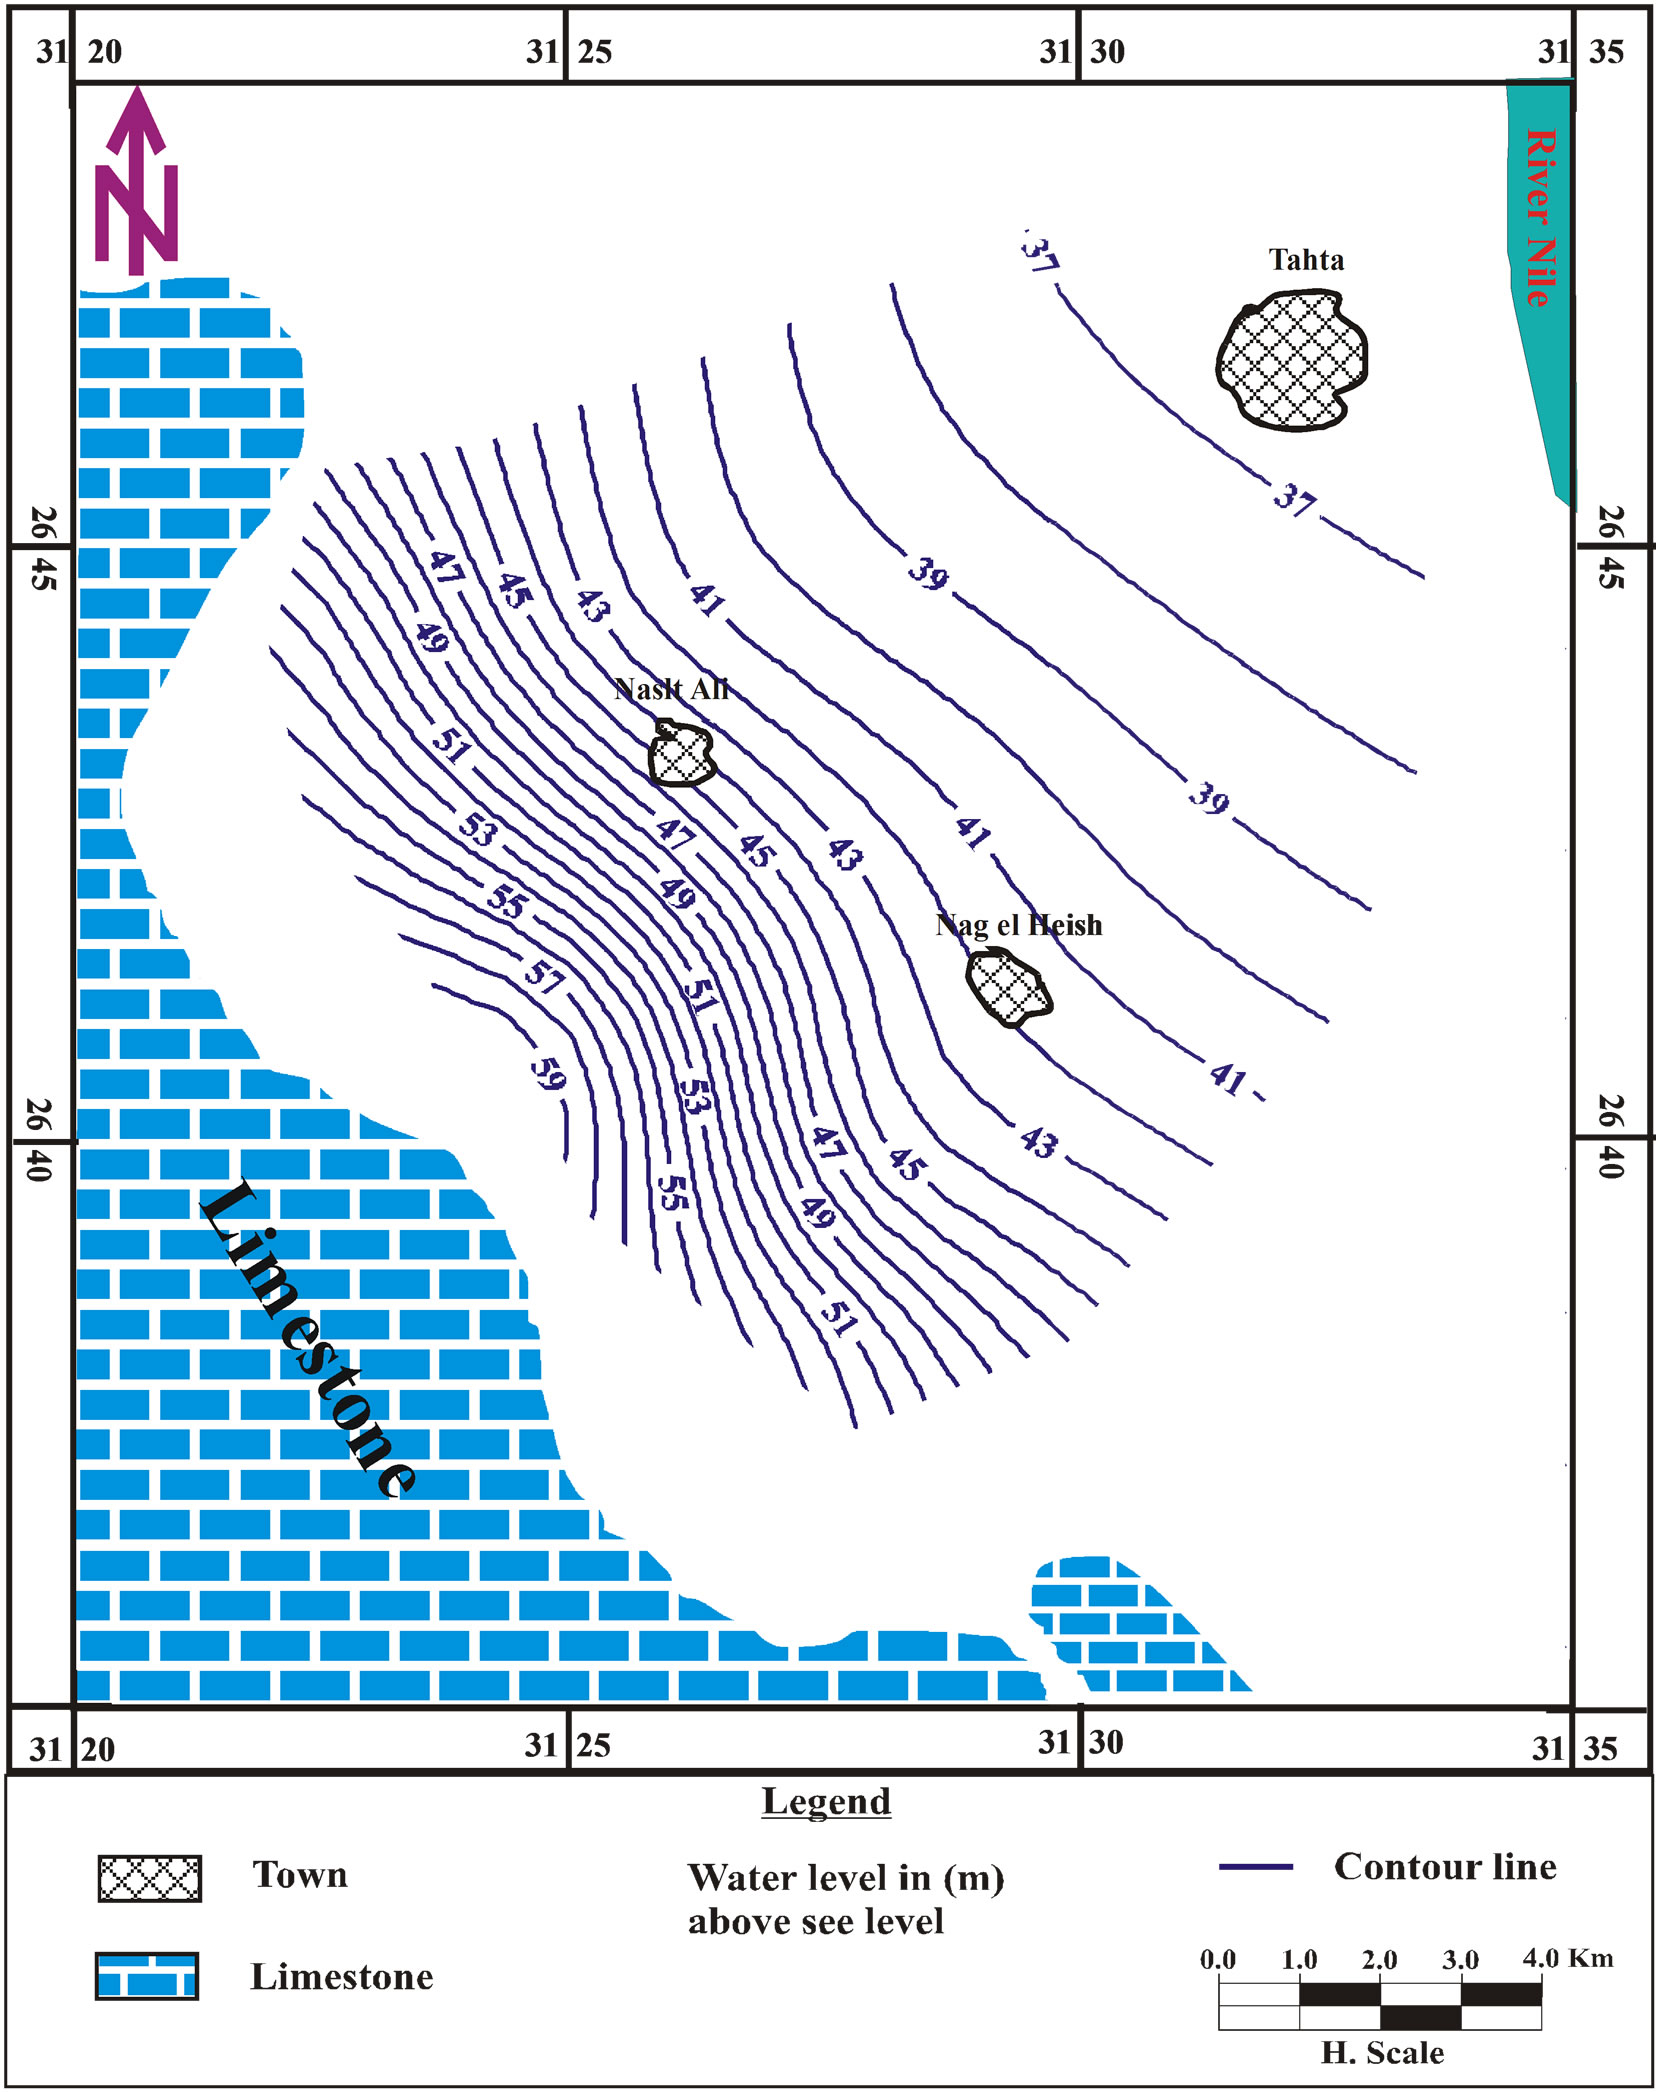
Figure 4. Water level contour map 2011.
1989 and 2011 respectively are mixed water and the rest is marine origin. The presence of saline water mixed with the meteoric water in the 1989 samples is probably due to the washing of soils, and also the presence in 2011 samples due to presence clay and shale deposits, as well as ionic exchange between the groundwater and the aquifer sediments rich in clay lenses.
The studied groundwater samples are plotted in the grids diagram [14], where each point represents a sample. The pattern of distribution will immediately gives an idea about the major and minor classes of waters encountered. The water samples which collected in 1989 are mainly sodium bicarbonate and sodium chloride with extended to sodium sulphate. The 2011water samples are mainly sodium sulphate and sodium chloride (Figure 10).
By represented the groundwater samples which collected in 1989 and 2011 on the guidelines for human drinking uses (International Standards and the Egyptian Committee for Water, 2007), it is clear that; Most of 1989 groundwater (64%) are suitable for drinking due to
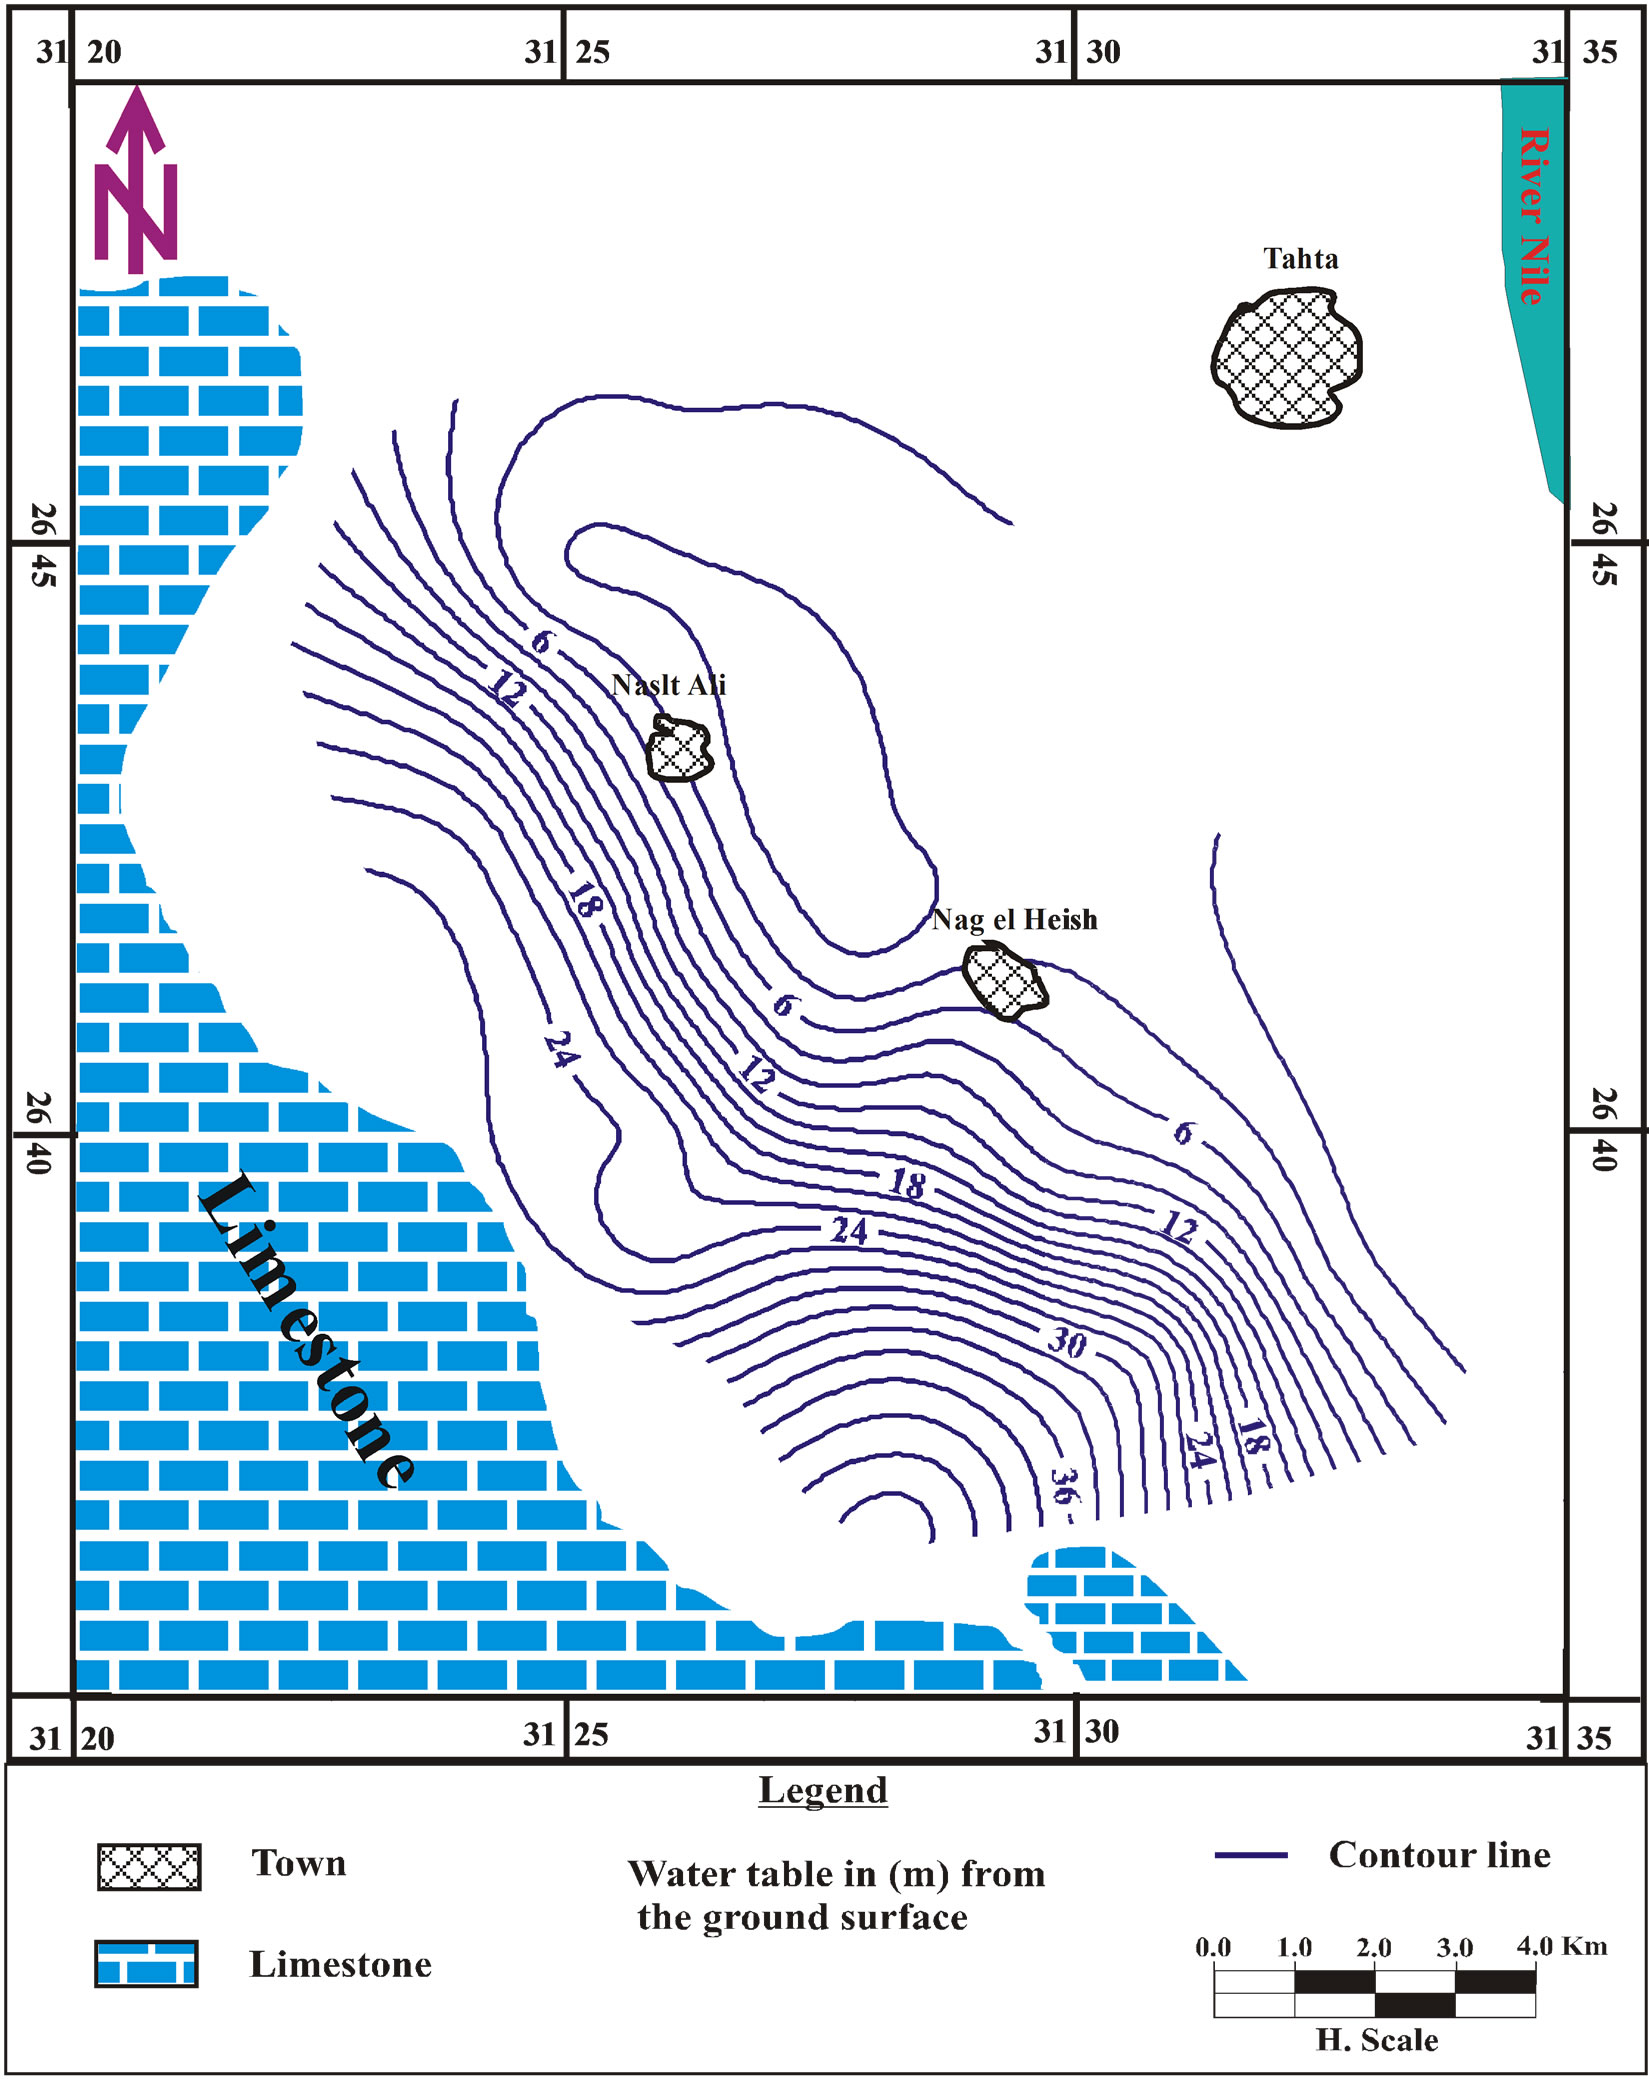
Figure 5. Water table contour map 1989.
low of salinity concentration (>1200 ppm) and also major ions less than the permissible limits.
The rest of samples 36 % are unsuitable due to high of total salinity and the major ions concentrations are more than the permissible limits. On the other hand, the majority of 2011 groundwater samples (71%) are unsuitable for human drinking because it has concentration of water salinity more than 1200 ppm it reached to 4453 ppm and major ions more than the permissible limits. The rest of the samples (29%) are suitable for drinking due to low of salinity (>1200) and also the major ions less than the permissible limits.
Based on [15] classification of groundwater use for irrigation purposes, the studied water samples have been classified and are given in (Table 4), from this classification we found that, the 1989 groundwater samples are categorized under good quality to very doubtful water for irrigation. While half of 2011 ground water samples are categorized under unsuitable and the other half ranged between good qualities to doubtful for irrigation.
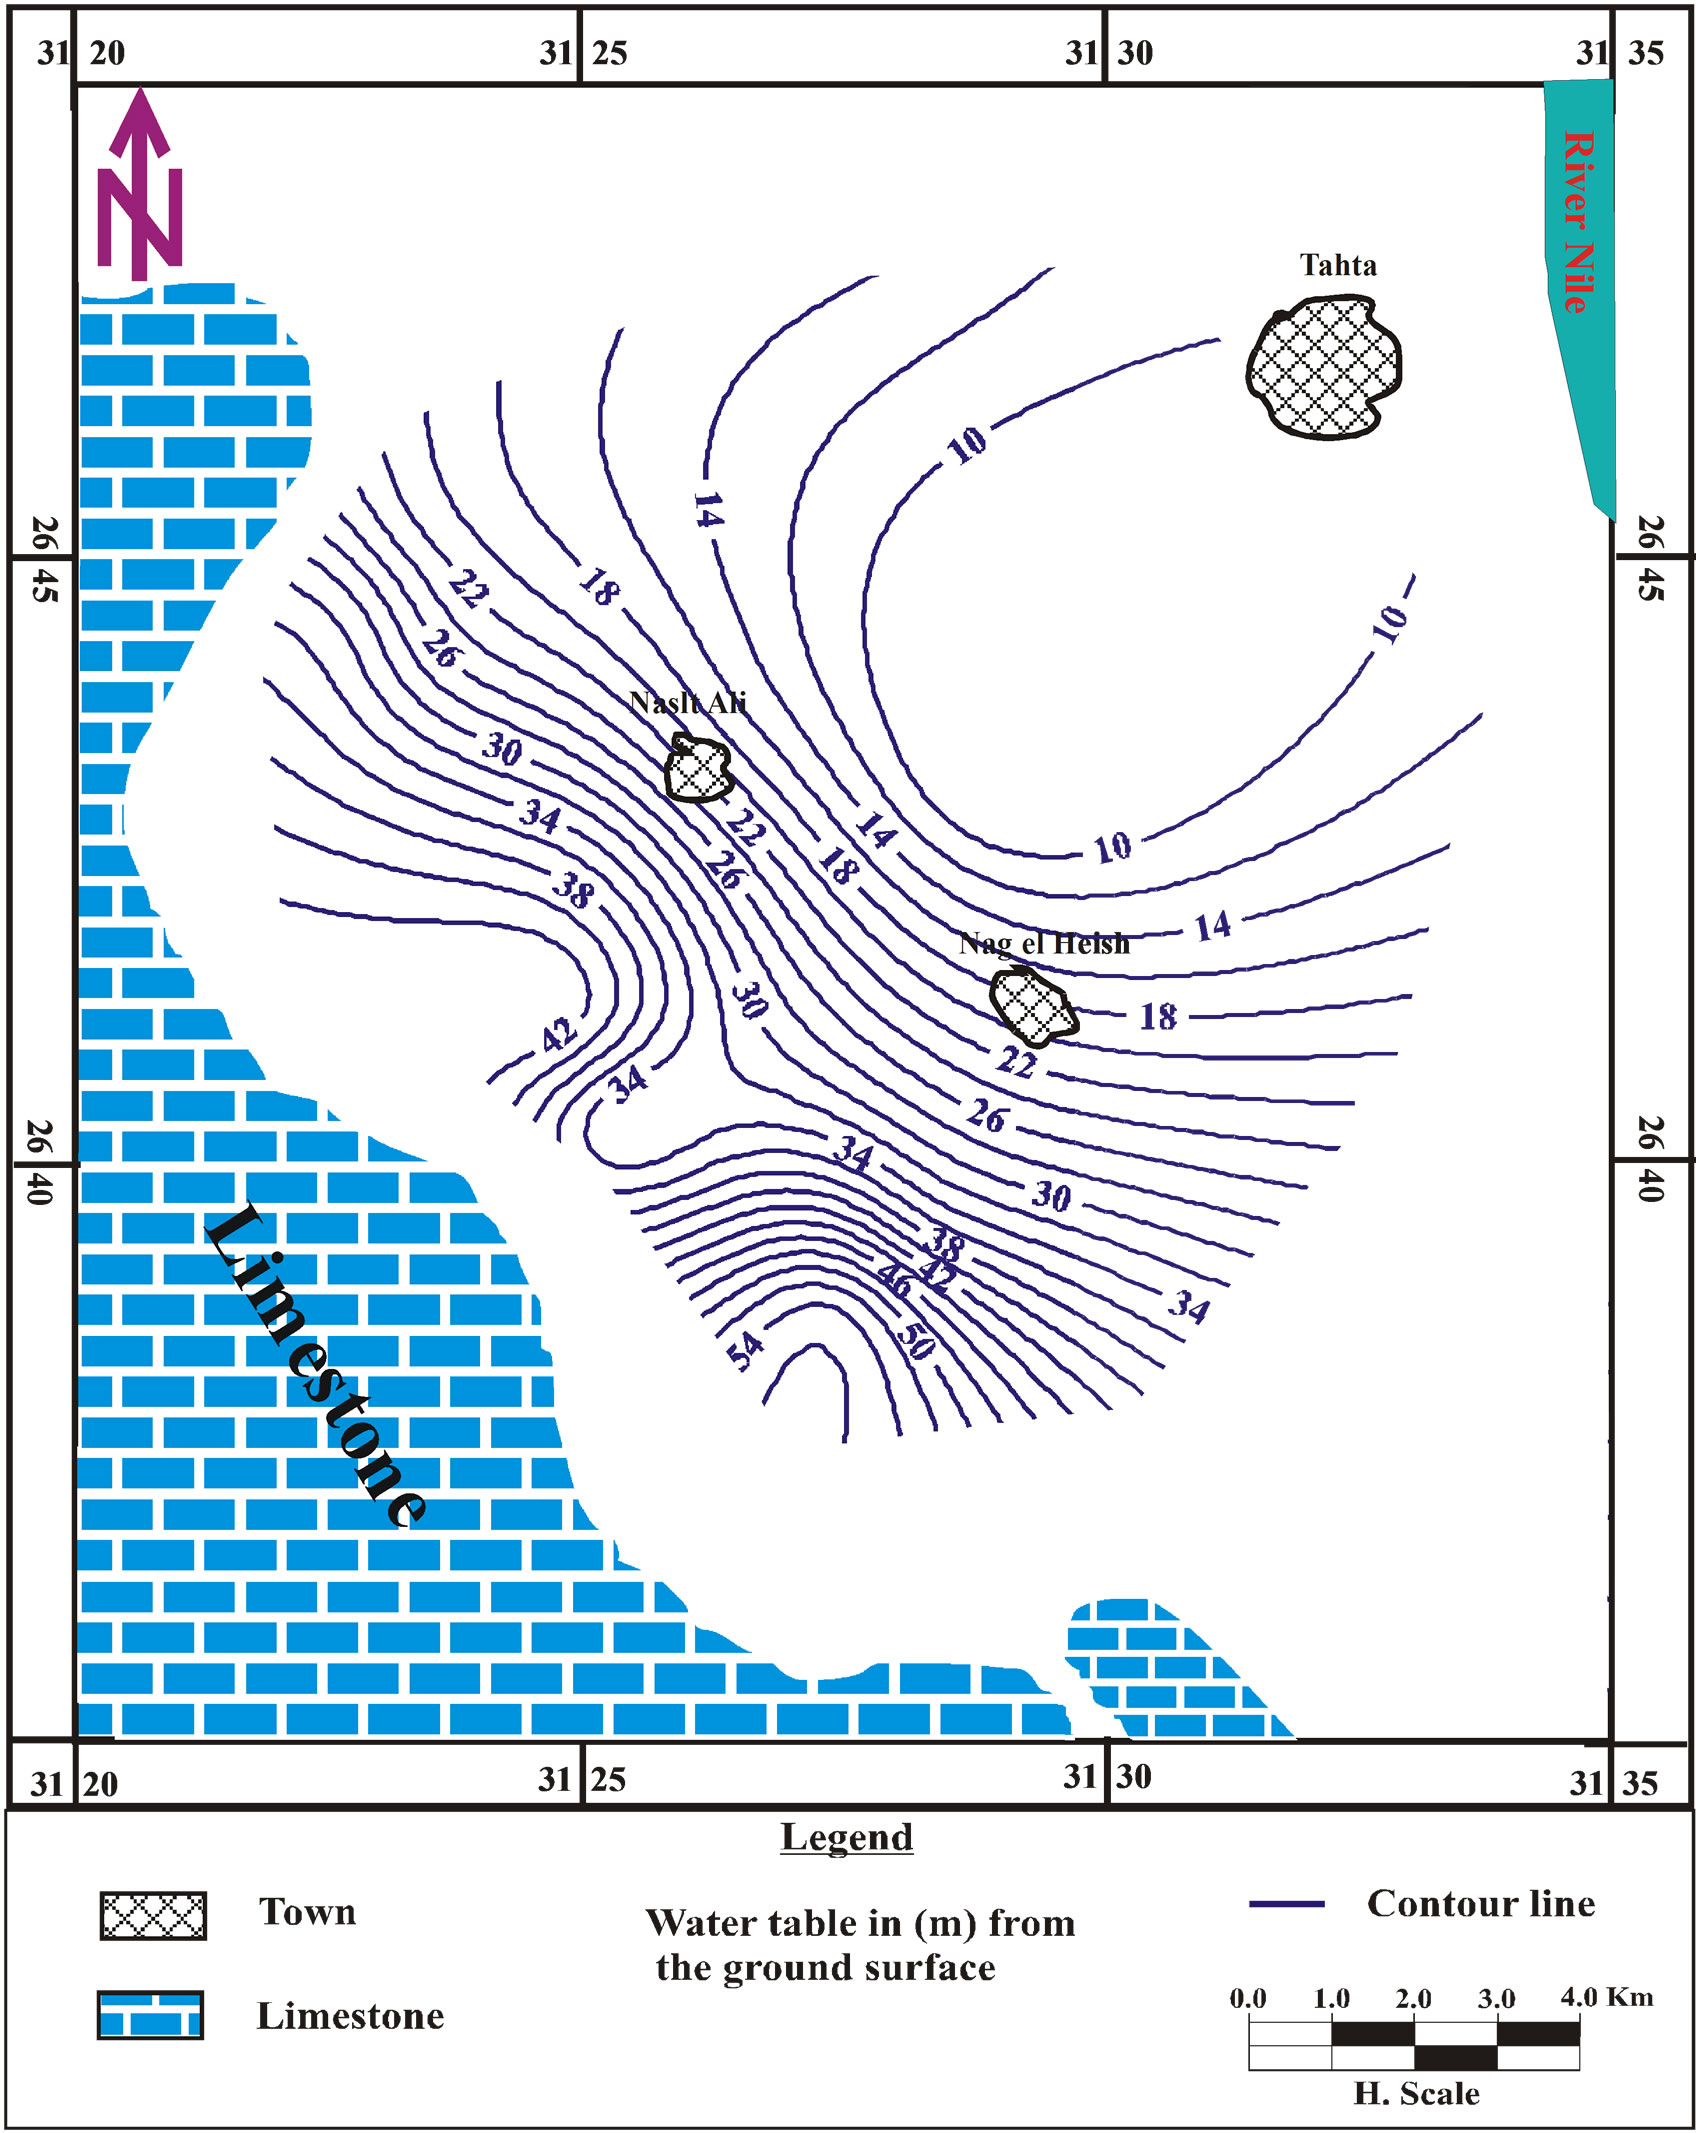
Figure 6. Water table contour map 2011.
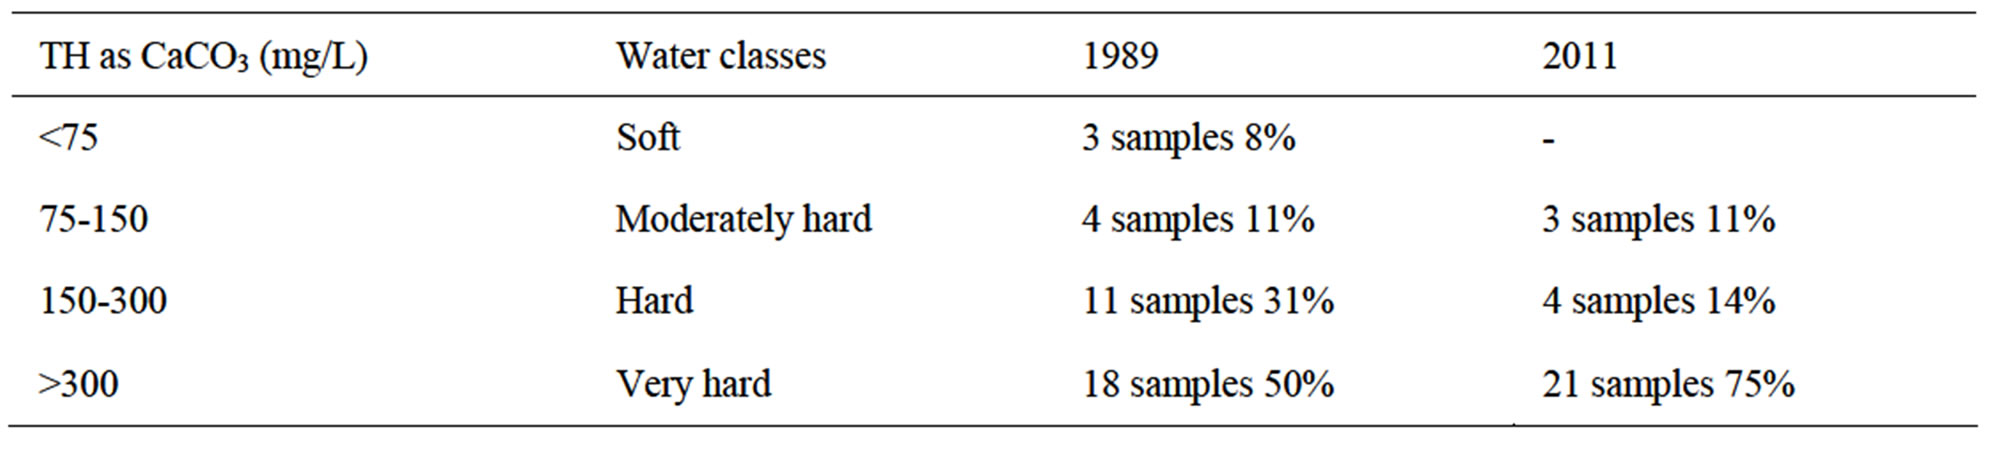
Table 3. Sawyer and McCarty’s classification of groundwater based on hardness.
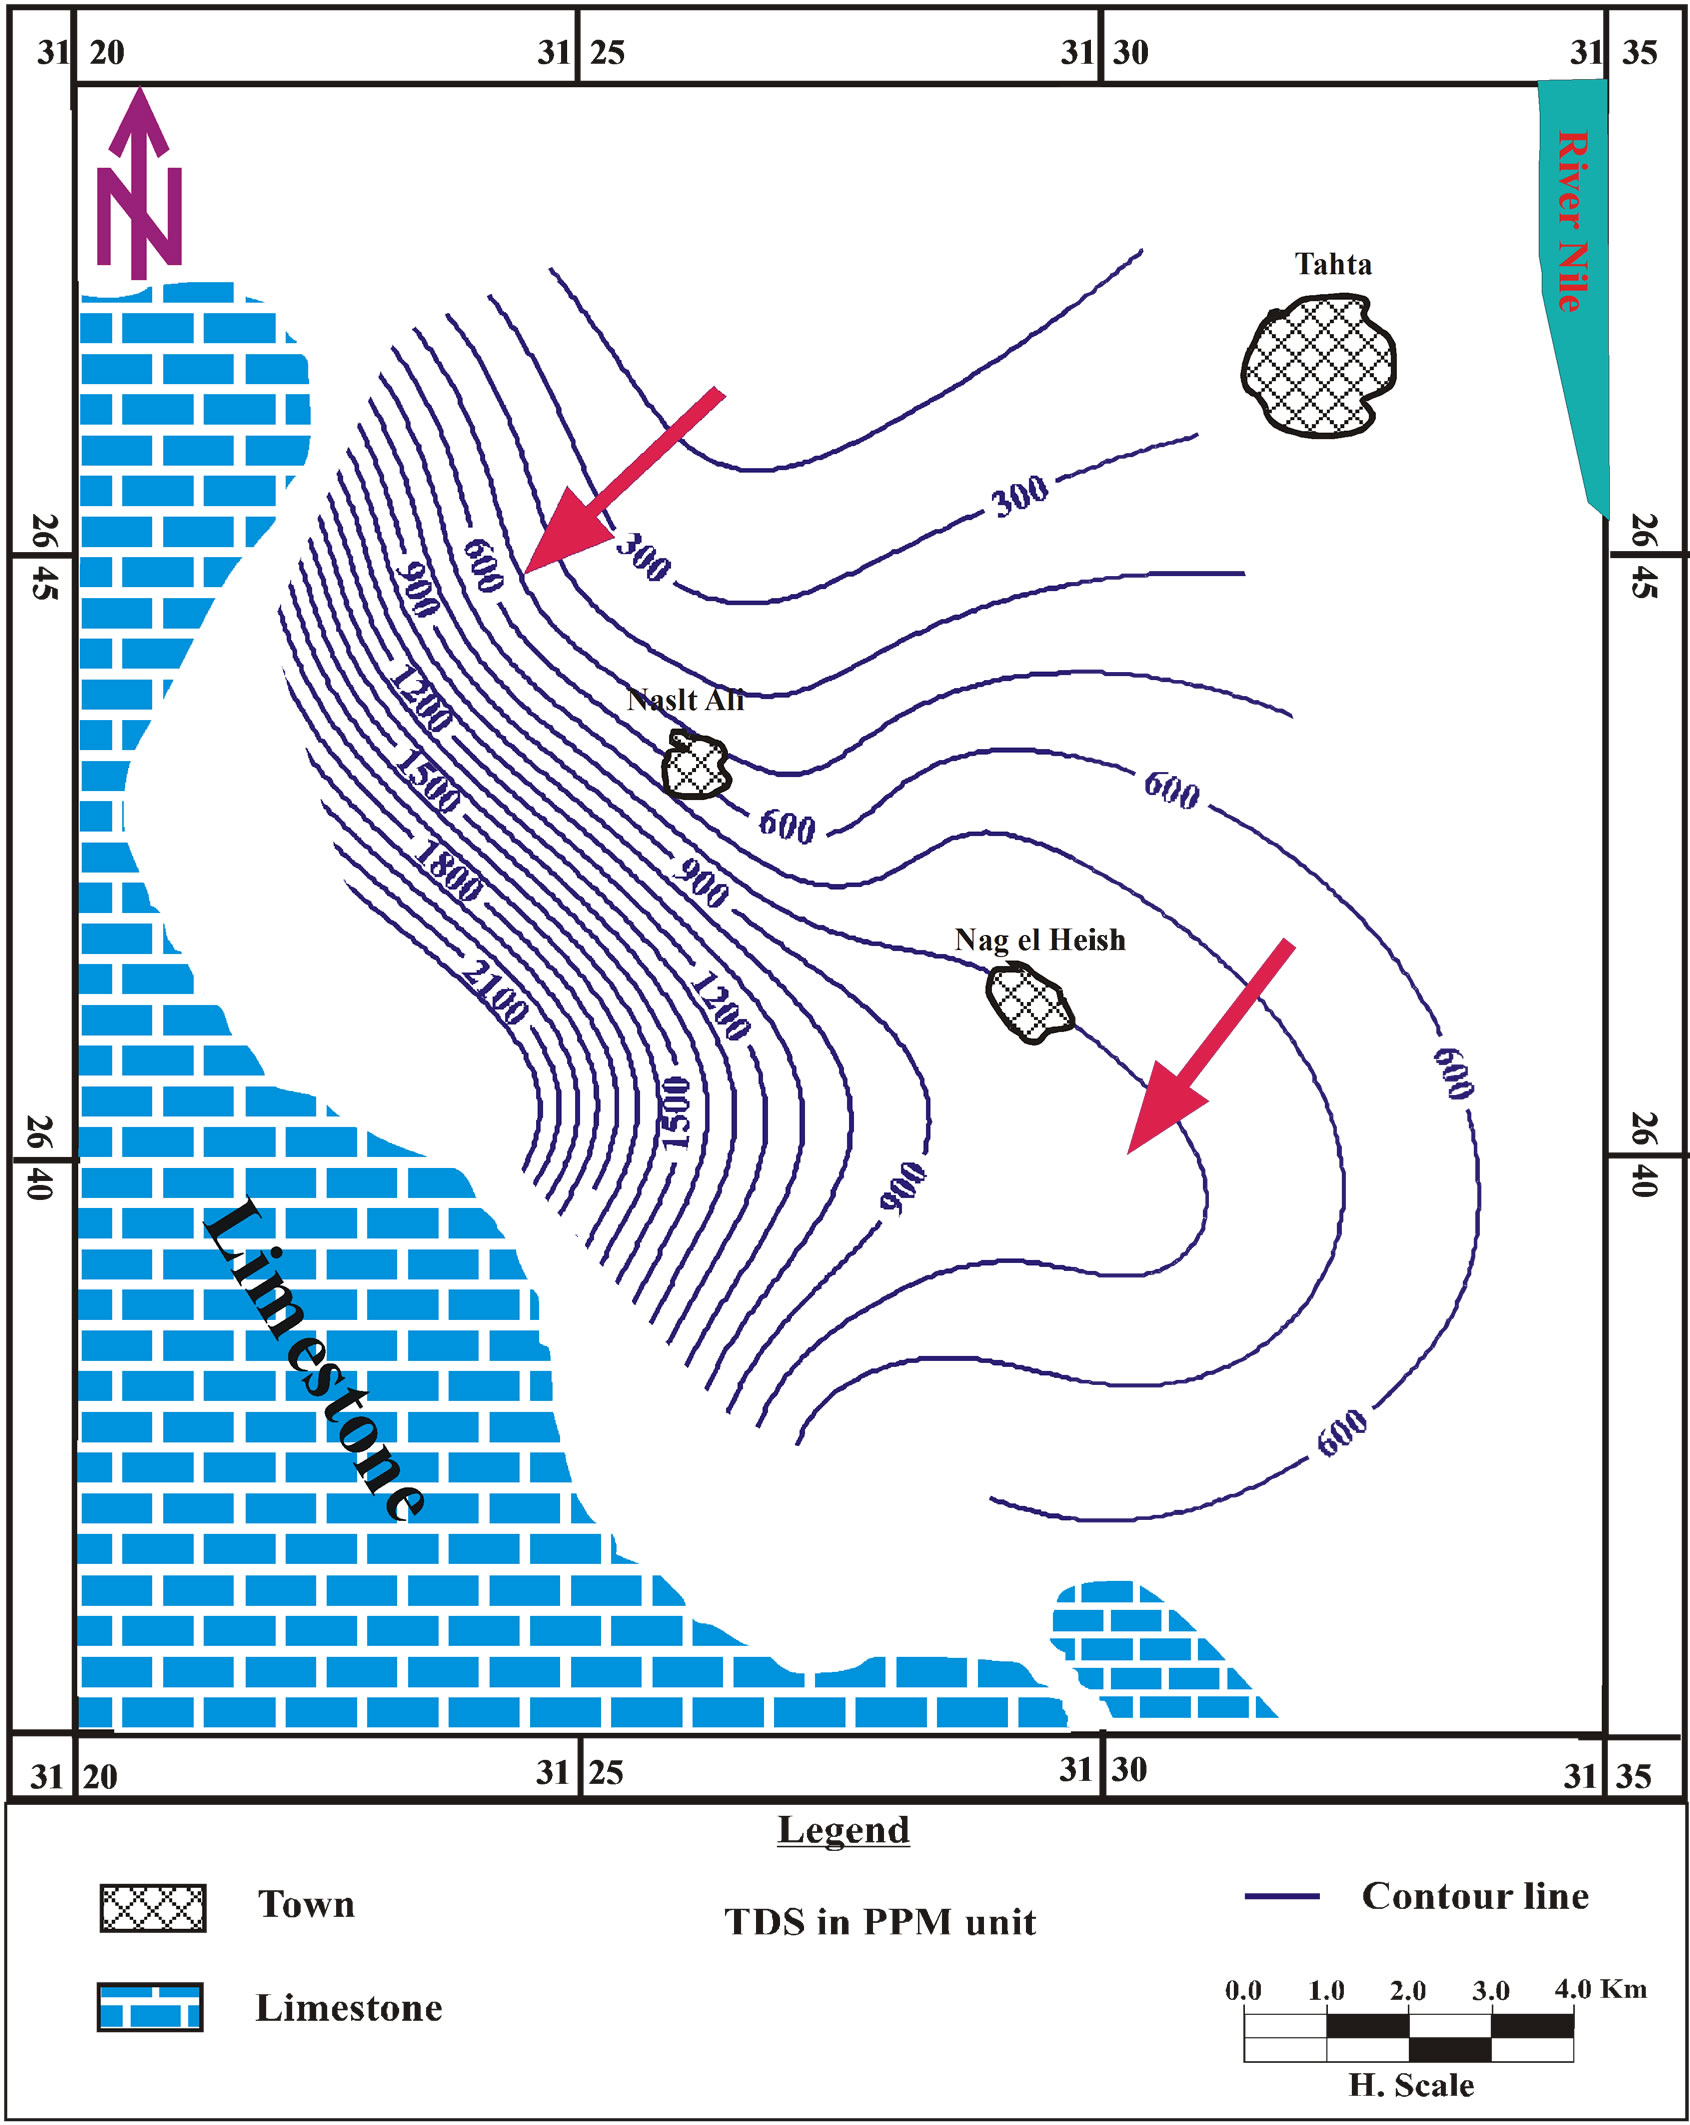
Figure 7. Iso-salinity contour map 1989.
According to the US Laboratory Staff’s diagram [16] (Figure 11), 84% of the groundwater samples collected in 1989 are suitable and 17 are bad or unsuitable for irrigation purposes in ordinary conditions. About 54% of the groundwater samples collected in 2011 is suitable and 46 % are bad or unsuitable for irrigation purposes due to its high salinity.
The chemical data of 1989 and 2011 groundwater samples are plotted in the [17] (Figure 12). The majority of the groundwater samples which collected in 1989 and 2011 suggest that, the chemical weathering of rock-forming minerals influencing the groundwater quality by dissolution of rock through which water is circulating.
4. Conclusions
The study area is subjected to extensive agriculture and urbanization project these projects are mainly depends on
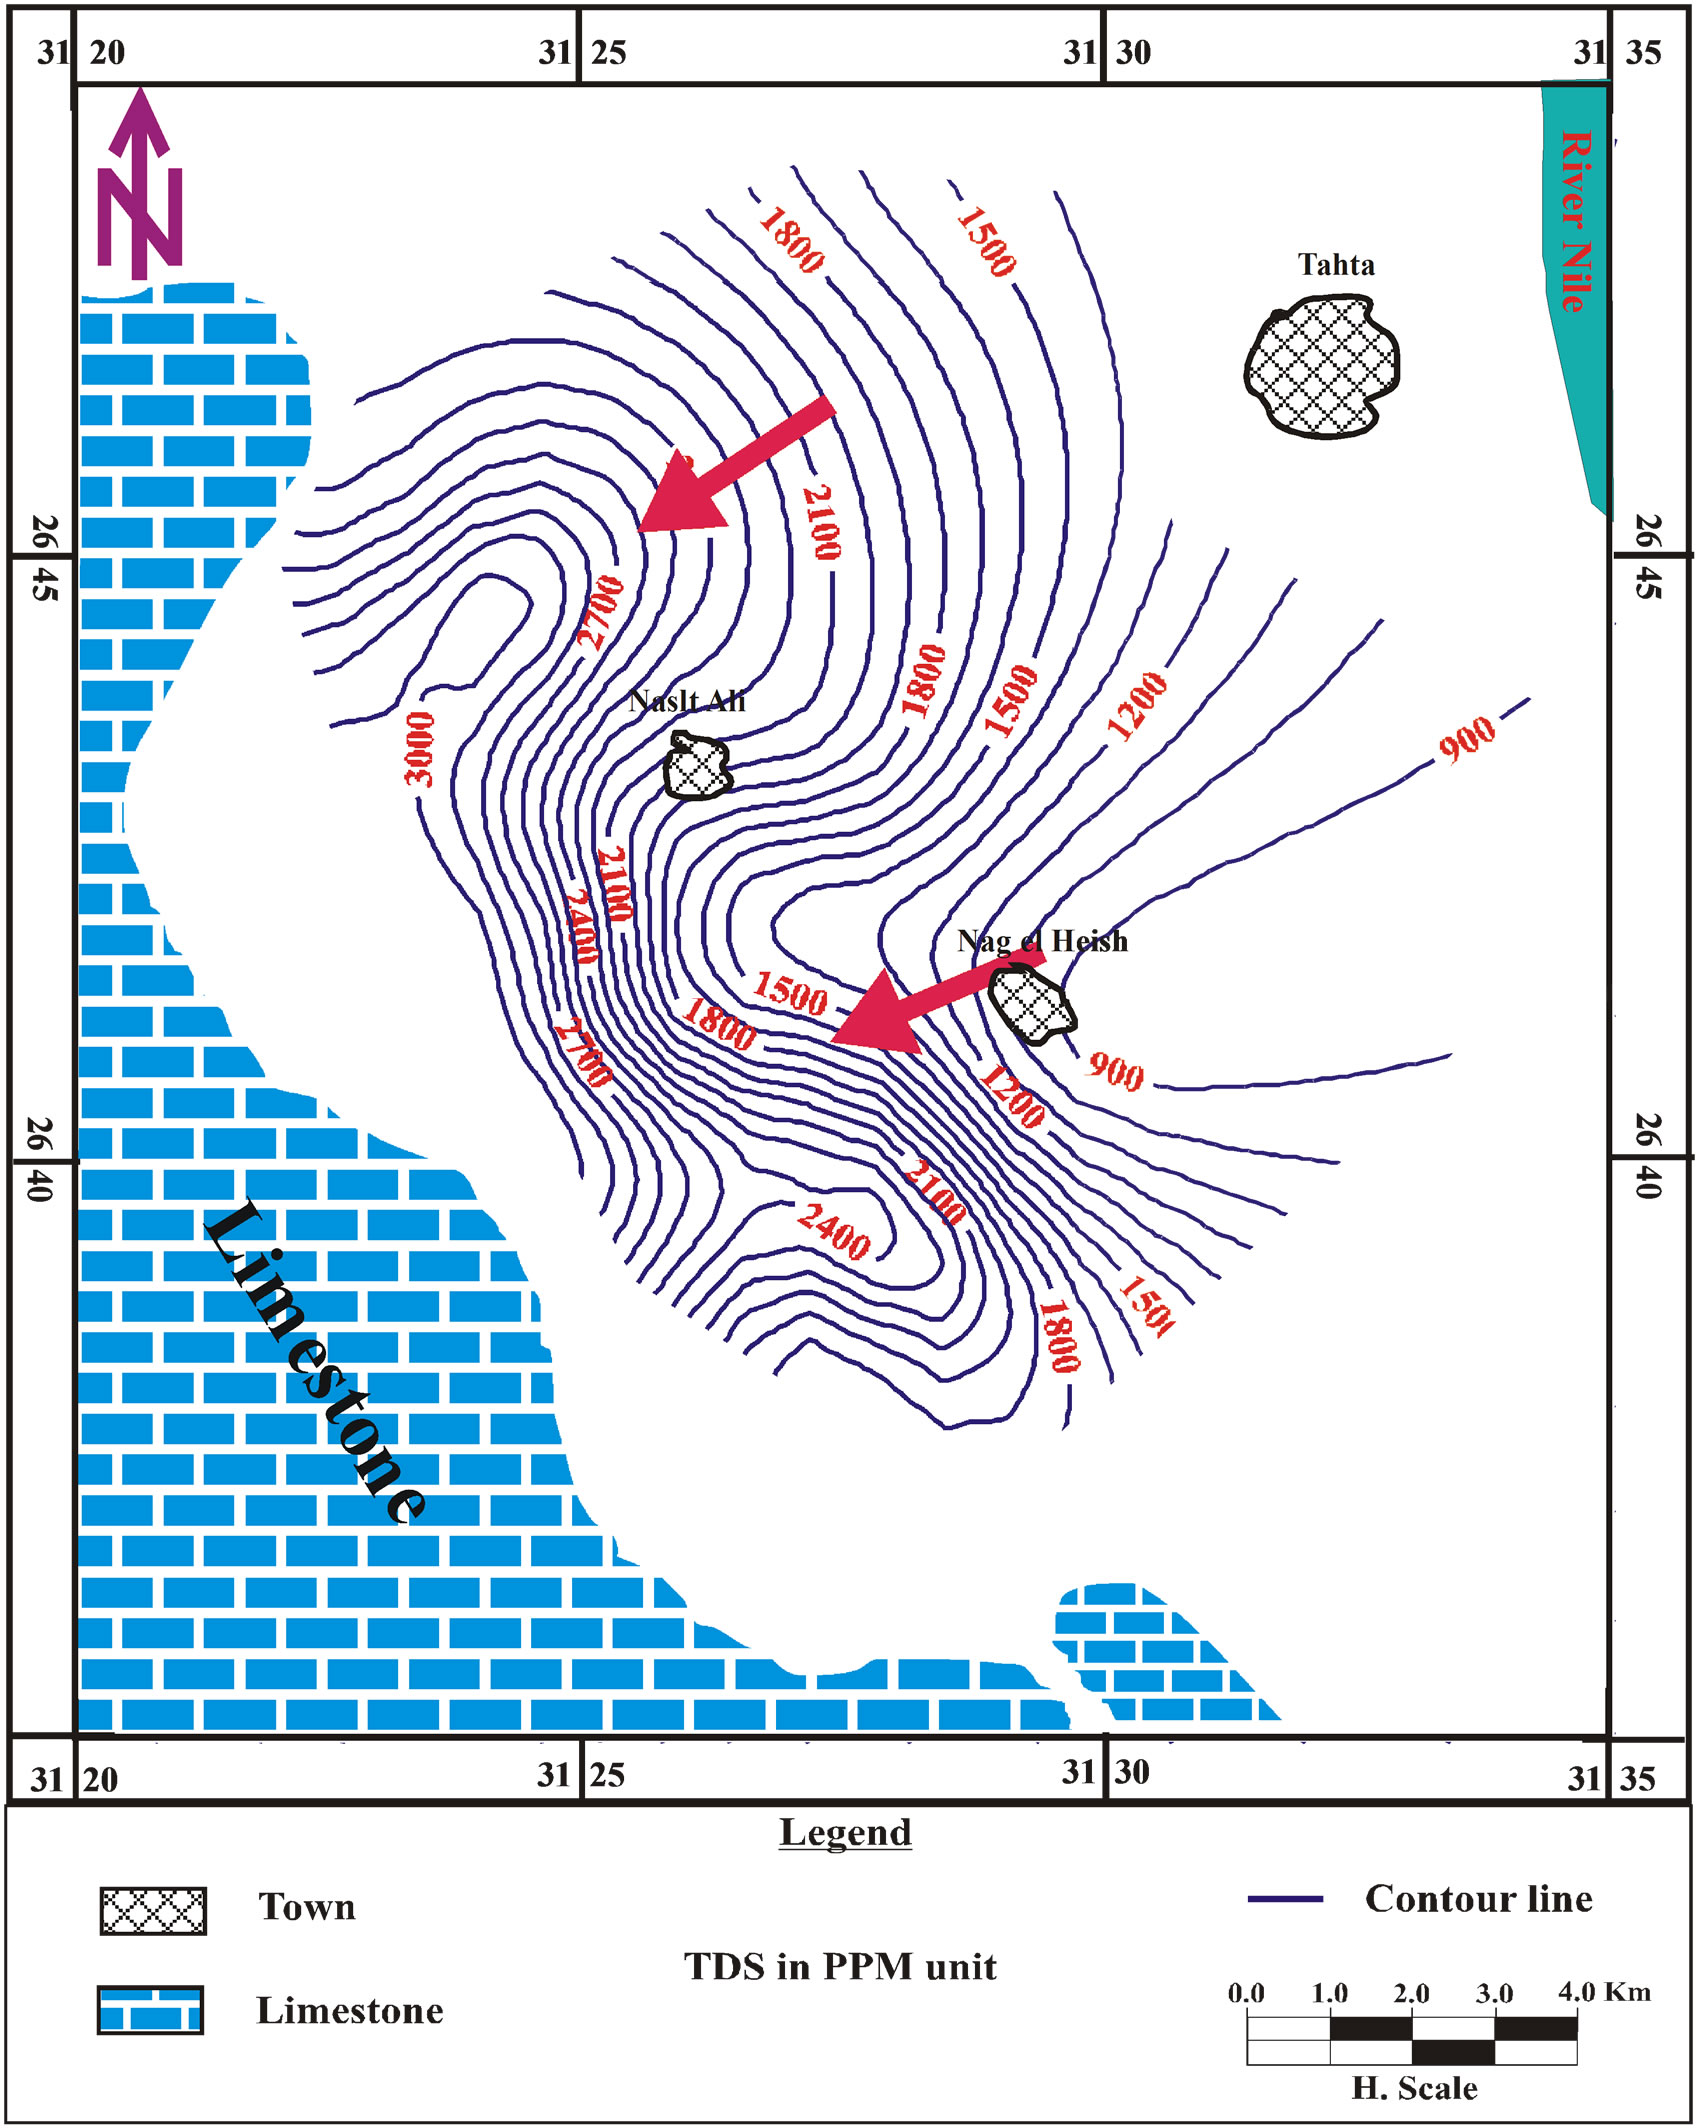
Figure 8. Iso-salinity contour map 2011.
the old methods for irrigation which leads to the following:
1) Increase the depth to water in the study area from 1989 (ranging between 1 to 48 m) to 2011 (ranging between 5 and 60 m).
2) The extensive withdrawal of groundwater with rare recharge as well as the dissolution of limestone leads to increase the water salinity; in 1989 it varies between 205 to 2880 ppm, while in 2011 it reached to 4448 ppm.
3) The water type is changed from NaHCO3 and NaCl in 1989 to Na2SO4 in 2011 due to the extensive use of fertilization.
4) The ground water quality are changed from 1989 to 2011, in 1989 most of groundwater are suitable for drinking, while the majority of groundwater collected in 2011 are unsuitable for human drinking 5) Most of the groundwater samples collected in 1989 suitable for irrigation purposes while, about half of the
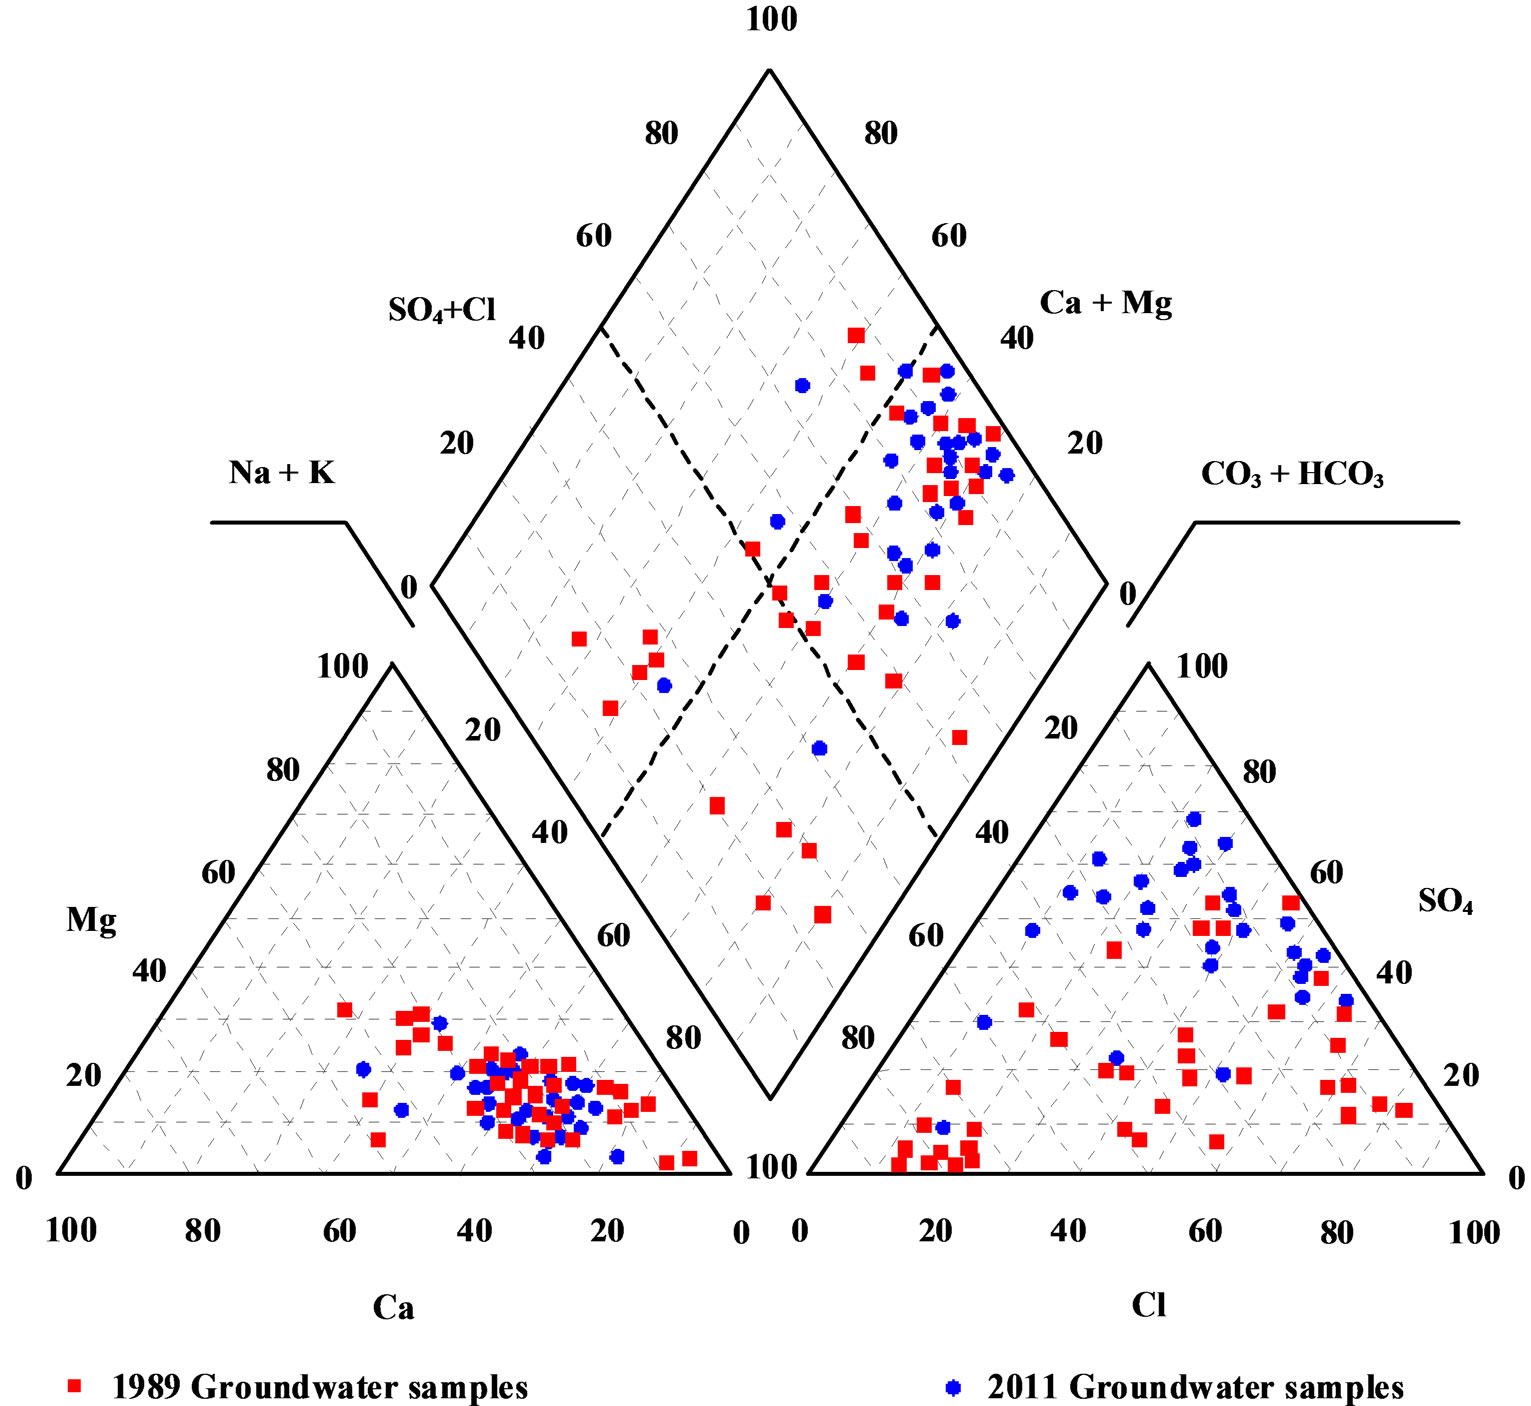
Figure 9. Piper diagram of the study water samples.
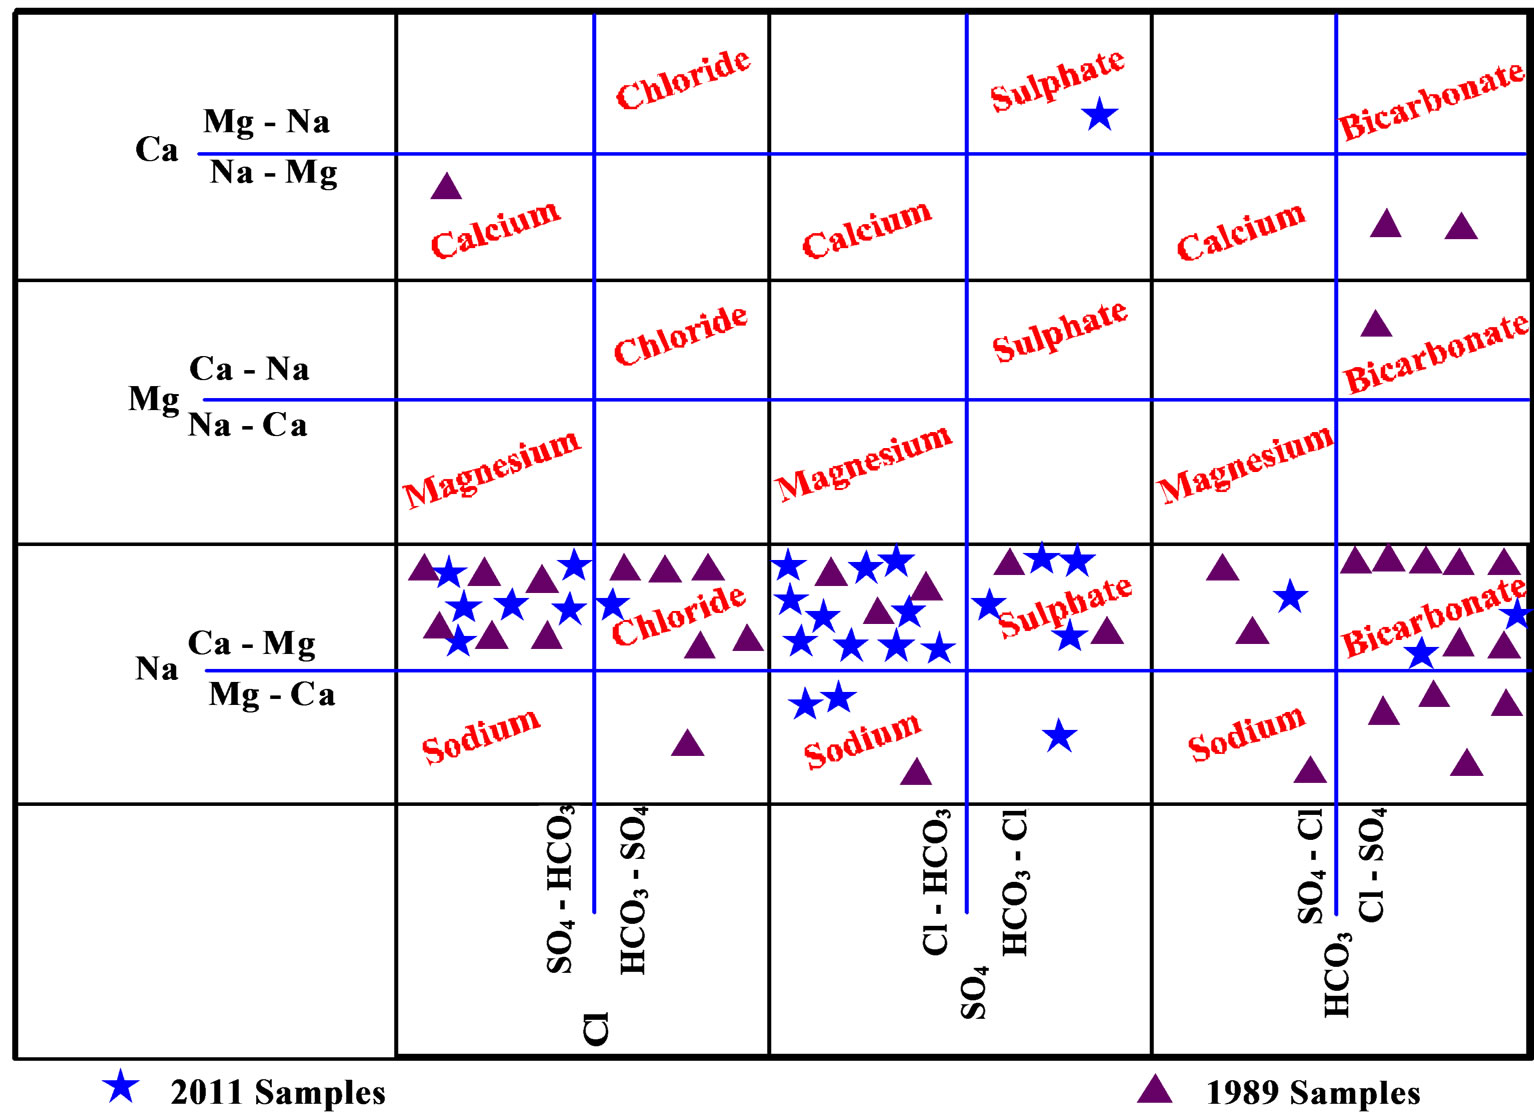
Figure 10. Grid system classification of the studied water samples.
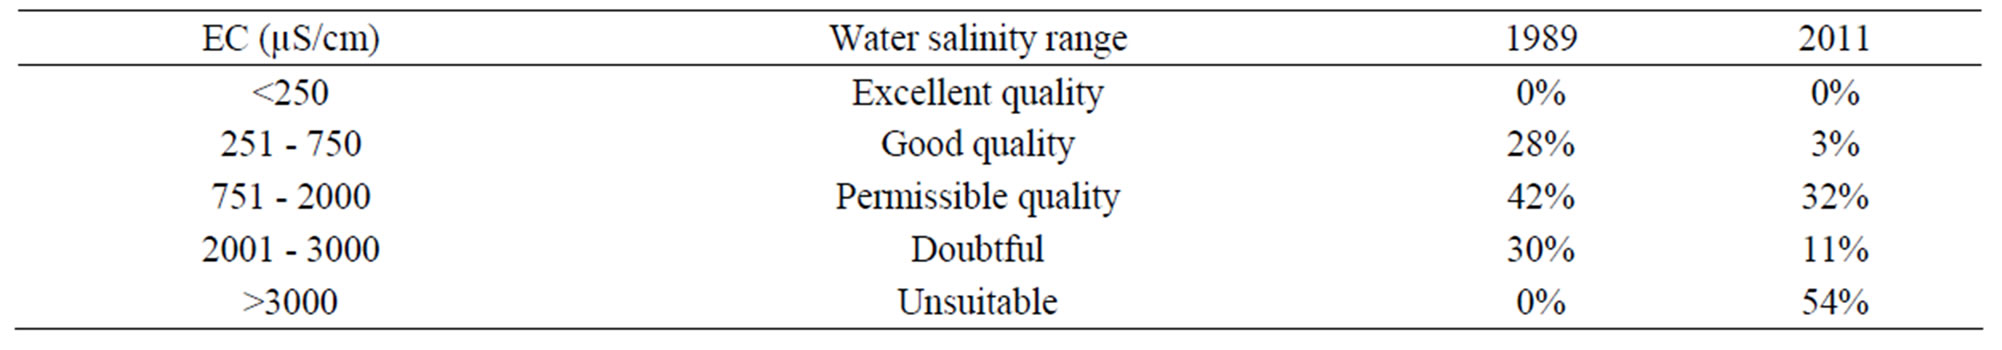
Table 4. Classification of water samples based on E.C.
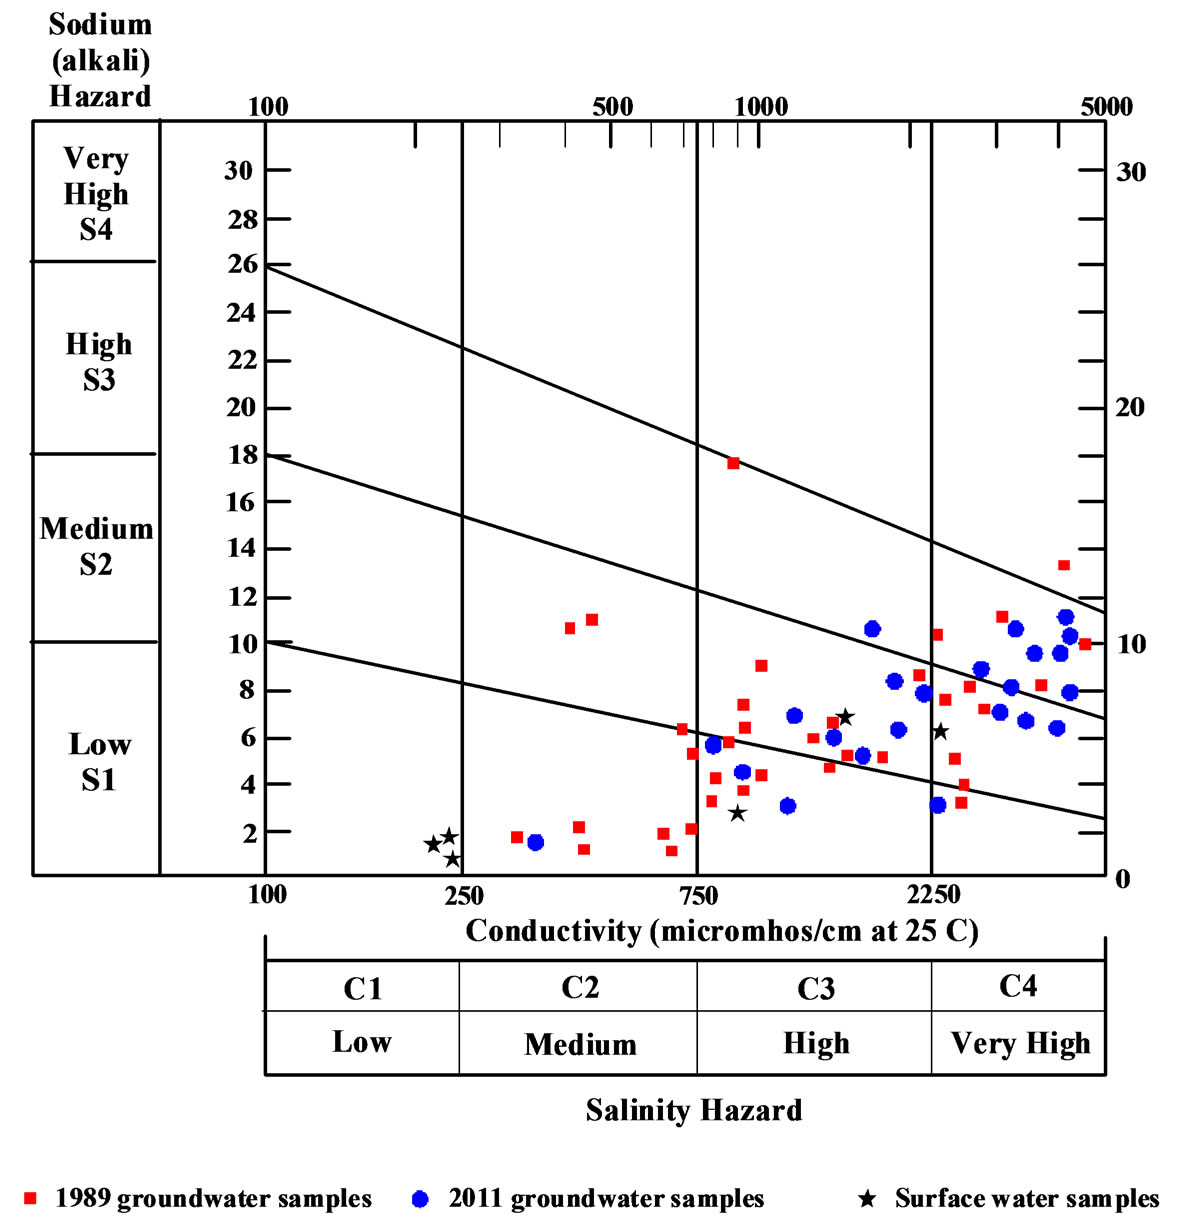
Figure 11. Wilcox diagram of the study water samples.
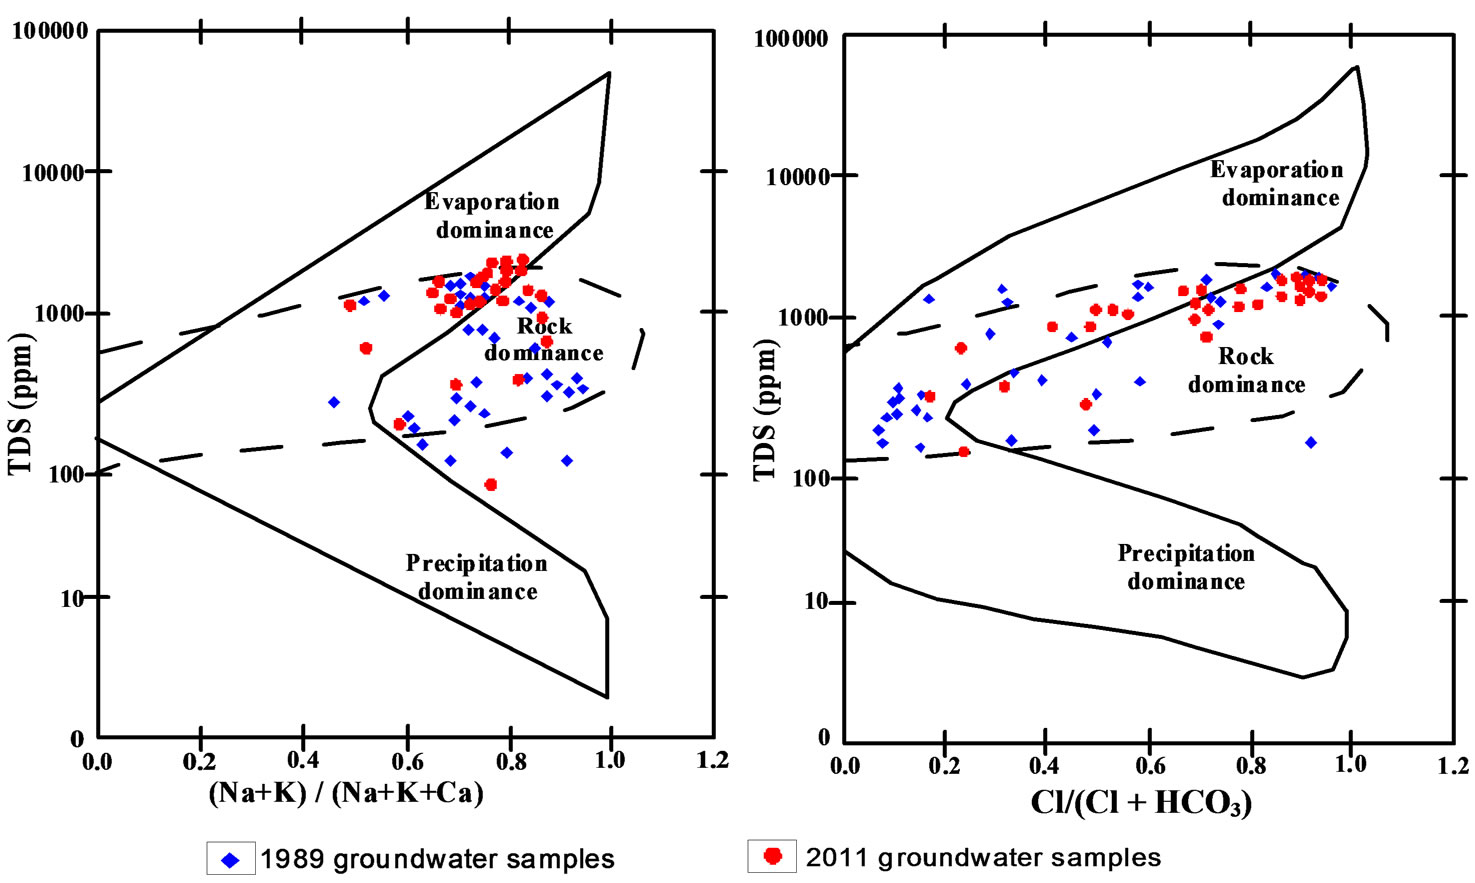
Figure 12. Gibbs diagram of the study water samples.
groundwater samples collected in 2011 is suitable and other half is bad or unsuitable for irrigation purposes due high salinity.
REFERENCES
- RIGW & IWACO, “Groundwater Development for Irrigation and Drainage in the Nile Valley,” Groundwater Development in the Area of West Tahta, Technical Note 70, Internal Report 124-89-05, 1989.
- R. Said, “The Geologic Evaluation of the River Nile,” Springer-Verlag, New York, 1981, p. 151.
- R. Said, “The Geology of Egypt,” Balkema Publisher, Rotterdam, 1990.
- Meteorological Authority of Egypt (MAE), “Meteorological Database, Cairo, Egypt,” 2000.
- A. A. Ayman, “Using Generic and Pesticide DRASTIC GIS-Based Models for Vulnerability Assessment of the Quaternary Aquifer at Sohag, Egypt,” Hydrogeology Journal, Vol. 17, No. 5, 2009, pp. 1203-1217. doi:10.1007/s10040-009-0433-3
- A. A. Omran, E. A. Korany and A. A. Abdel-Rahman, “An Integrated Approach to Evaluate Groundwater Potentiality—A Case Study,” Proceeding of the 3rd International Conference of Applied Geophysical, Cairo, 18- 20 March 2006.
- A. O. Awad, “Integration of Remote Sensing, Geophysics and GIS to Evaluate Groundwater Potentiality—A Case Study in Sohag Region,” Egypt, 2008. http://faculty.ksu.edu.sa/72005/Papers%20of%20Interest%20Remote%20Sensing/Integration%20of%20Remote%20Sensing,%20Geophysics%20and%20Gis.pdf
- J. D. Hem, “Study and Interpretation of the Chemical Characteristics of Natural Water,” US Geological Survey, Water Supply Paper 2254, 1989, p. 264. http://pubs.usgs.gov/wsp/wsp2254/
- J. D Hem, “Study and Interpretation of the Chemical Characteristics of Natural Water,” US Geological Survey, Water Supply Paper 2254, 1985, pp. 117,120,264.
- H. M. Ragunath, “Groundwater,” Geological Journal, Vol. 18, No. 3, 1987, pp. 279-280.
- D. K. Todd, “Groundwater Hydrology,” Wiley, New York, 1980, p. 315.
- G. N. Sawyer and D. L. McCarthy, “Chemistry of Sanitary Engineers,” McGraw Hill, New York, 1967, p. 518.
- A. M. Piper, “A Graphic Procedure in the Geochemical Interpretation and Analysis of Water Samples,” US Geological Survey, Water Supply Paper 1454, 1944.
- S. M. M. Atwa, “Hydrogeology and Hydrogeochemistery of the North Western Coast of Egypt,” Faculty of Science, 1979.
- T. A. Bauder, R. M. Waskom and J. G. Davis, “Irrigation Water Quality Criteria,” Extension Fact Sheet No. 0.506, 2007, pp. 1-5. http://www.ext.colostate.edu/pubs/crops/00506.html
- L. A. Richards, “Diagnosis and Improvement of Saline and Alkaline Soils,” US Department of Agriculture Hand Book, Vol. 64, No. 5, 1954, p. 432.
- R. J. Gibbs, “Mechanism Controlling World Water Chemistry,” Science, Vol. 170, No. 3962, 1970, pp. 1088- 1090. doi:10.1126/science.170.3962.1088