Smart Grid and Renewable Energy
Vol.4 No.7A(2013), Article ID:37483,11 pages DOI:10.4236/sgre.2013.47A003
Optimization of Thermal and Electrical Appliance Loads in Residential and Commercial Buildings with Demand Side Monitoring
![]()
Energhx Research Group, Department of Mechanical Engineering, Faculty of Engineering, University of Lagos, Lagos, Nigeria.
Email: ogedengbe@energhx.com
Copyright © 2013 Emmanuel O. B. Ogedengbe. This is an open access article distributed under the Creative Commons Attribu- tion License, which permits unrestricted use, distribution, and reproduction in any medium, provided the original work is properly cited.
Received February 5th, 2013; revised March 5th, 2013; accepted March 12th, 2013
Keywords: Optimization; Polynomial Regression; Electricity; Natural Gas; Energy Stocks; DSMonitorTM; Smart Grid
ABSTRACT
Energy demand-supply mechanism with the load shape for both residential and commercial buildings in the Province of Ontario and Nigeria is studied with demand side monitoring of energy consumption. Thermal and electrical loads are characterized by certain predictor variables, including the consumers’ behavioural pattern, power ratings of energy appliances and weather conditions. The proposed bottom-up approach is capable of providing low-volume electricity and natural gas consumers, in a fully deregulated energy market, with competitive energy saving advantage, based on corrective monitoring of independent users’ demand loads. Special application of the bottom-up model-based facility characterization of demands for thermal comfort and indoor air qualityin a developing energy sector like Nigeria enables the development of planning tool for the proposed integration of renewable power systems. The developed DSMonitorTM app is capable of deploying an effective smart grid technology tool towards an improved building energy demand-supply balance at the individual end-user level.
1. Introduction
Efficient control of the demand-supply mechanism has often enabled the effective monitoring of the baseload generation of power by all stakeholders in the energy sector. Surplus baseload generation of electricity affects the prices of electricity in Ontario, leading into negative prices during hours when Ontario sellers pay buyers in the US or Quebec to take the excess electricity [1]. Generally, electricity prices are determined by various demand-supply mechanisms, including conservation procurement, delivered comparison, generation/production procurement, global adjustment, and the Ontario Energy Board’s Regulated Price Plan (RPP). But with the new Feed-In-Tariff (FIT) programs of the Ontario Power Authority (OPA), the generation procurement mechanism is playing a prominent role in the determination of electricity price. As more green energy from wind and solar systems are procured, low-volume consumers seem left out from the attractive FIT programs, being at the receiving end of the hike in the effective electricity rates.
Since Ontario wholesale generators are guaranteed fixed payments under certain long-term contracts, the task of controlling the electrical grid system against surplus power becomes enormous for the province’s Independent Electrical System Operator (IESO). Top-bottom prediction of the demand-supply forecast, based on econometric models and weather scenarios, is utilized by the IESO to control the demand-supply balance. Although this approach is most effective and reliable in a fully deregulated energy market with appreciable control of the demand-supply balance, the increase in the cost of surplus power suggests the development and utilization of auxilliary technology at the buidling level. When energy demand is negative, an economic consideration implies that an effective model that is capable of limiting the generation of surplus electricity will be desirable. Lund et al. [2] argued that while the identification of the problem of mismatch between energy demand and production of zero energy building is feasible at the building level, compensation of this mismatch at the same level is complicated. However, recent advances in smart grid technologies [3,4], and the quest for effective compensation of this mismatch challenge, require the development of a robust demand side monitoring tool at the building level in addition to the aggregate treatment of distributed mismatches.
Apart from the IESO, baseload generators, being the significant Market Participants in the Ontario energy market, are also capable of managing the appropriate balance of supply when there is surplus baseload generation. In a fully deregulated energy sector like Ontario, where low-volume consumers of natural gas and electricity (for example, the Steamed Rice Express Restaurant in Figure 1) have choices of deciding their energy supplier, the proposed demand side monitoring of the performance of domestic and non-domestic energy stocks offers an economic saving advantage, based on smart monitoring of energy consumption. This methodology is useful for management of surplus baseload generation with the decentralized energy planning system. However, the decentralized energy planning system is popular only in a developing economy like Nigeria, where supply even in cities is always negative and erratic. Hiremath et al. [5] developed a Goal Programming (GP) model with a decentralized energy planning (DEP) of energy demands in Tumkur District, using a bottom-up approach. DEP method enables the optimization of multi-objective resource allocation problems. With the royal assent on the Green Energy Act in Ontario in 2009, energy supply from large-scale deployment of solar photovoltaic (PV) technology contributes significantly to the problem of surplus baseload generation. The pioneering works of Denholm and Margolis [6] examined the limits of large-scale deployment solar PV for any utility grid system. As reviewed by Solomon et al. [7], their work proposed various options to improved solar penetration, including energy storage, energy dumping, increasing load flexibility, and load shifting. Unfortunately, Ontario’s surplus electricity, sold to buyers in the US and the

Figure 1. Pictorial view of steamed rice express restaurant, a typical commercial energy system located in the city of Ottawa, Ontario.
Province of Quebec, had always resulted in negative prices. This penalty was up sharply from the same period in 2010, when there were only 10 hours of negative prices at a cost of $4.2 million to $35 million in 2011 during the 95 hours of negative prices [8]. Without prejudice to the incentives through the Feed-in-Tariff (FIT) and the Micro Feed-in-Tariff (microFIT) programs, clean energy practice starts with effective conservation of the available electricity in the local grid and current natural gas production. Stemming the drive towards the estimated increase in the demand of electricity and natural gas to residential and commercial facilities plays a significant role in their respective price determination mechanisms. A global effort towards demand side management, remodeled by Energhx® and referred to as demandside monitoring (DSM) in this paper, has been reported by the International Energy Agency [9]. Figure 2 shows three-mode energy contracting with Energhx® towards improvement in building energy efficiency, including Solar Energy Supply Contracting (Solar ESC), Energy Supply Contracting (ESC) and Energy Performance Contracting (EPC). Residential and commercial facilities across the Province of Ontario are adopted as the scope for the DSM study. Unlike the practice of most conventional developer of solar photovoltaic system, this paper demonstrates the importance of DSM in order to address the problem of grid flexibility and surplus baseload generation.
Second Law analysis [10], based on exergetic design of the residential and commercial energy systems, is adopted for the design of thermal comfort, indoor air quality (IAQ) and performance variables of renewable energy system within each unit of the energy model [11]. Considered as an open system, analytical tool from the Natural Resources Canada (NRCan), including HOT2000, is considered alongside the DSMonitorTM. As described by Filippi [12] and reported in Ref [13], there are four methodologies for assessing the primary energy demand
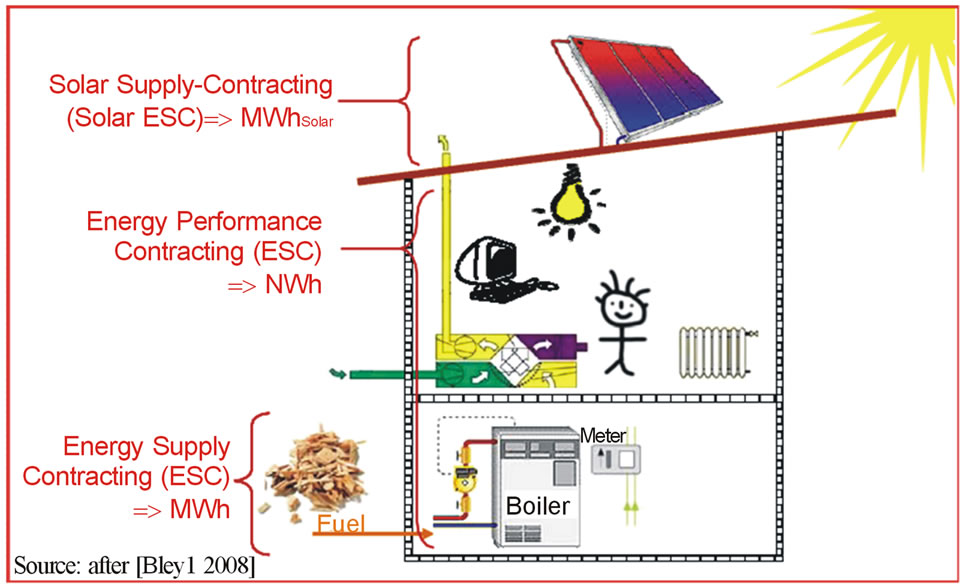
Figure 2. Schematic showing the two basic energy contracting models (Source: IEA).
in buildings. The first method involves the use of computational fluid dynamics tools, like the DSMonitorTM, BLAST, DOE-2, EnergyPlus, etc. Although this method is complex and time-consuming, realistic solutions to energy performance and indoor air quality problems would be indeterminate without this approach [14]. The second method is a simplified approach, where the energy demand is evaluated assuming the building operates in standard conditions. The third method involves the use of simplified evaluation of primary energy demand. The fourth method is only applicable to real buildings, involving the analysis of the historical consumption data; and corrective intervention in order to improve the system efficiency of the building. This paper proposes the integration of the first and the last methods, involving both energy supply contracting and energy performance contracting.
2. Description of an Energy Stock
In classical thermodynamics, every residential or commercial building facility for demand side monitoring and/or renewable energy project, like the engineering lecture theatre within the Faculty of Engineering, University of Lagos shown in Figure 3, are considered as an energy stock. The characterization of each of the energy stock based on thermal comfort, indoor air quality and the electrical appliances is grouped according to the type of facility (e.g., lecture theatres, offices, workshops/ laboratories, cafeteria, etc.).
The Second Law of Thermodynamics defines the concept of irreversibility, thereby necessitating the development of energy efficiency technology that can reduce the rate of exergy destruction in the energy stock [15]. Each of the components in this stock operates by drawing fuel, which is either natural gas or electricity commodities, in
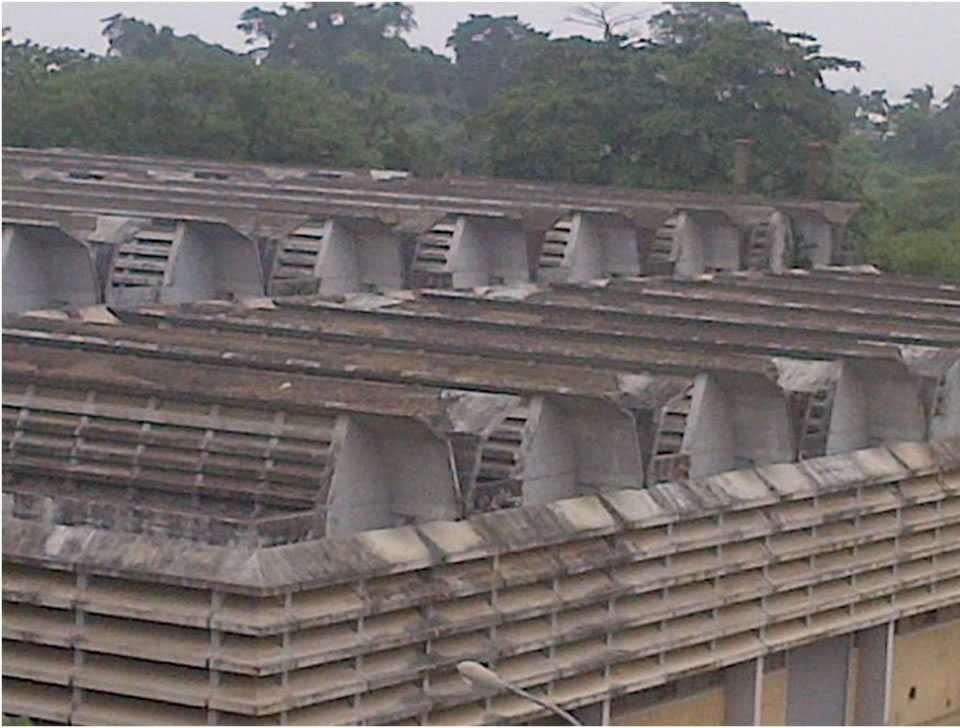
Figure 3. Roof-Top view of the faculty of engineering, university of Lagos.
an open system. For example, a domestic hot-water system can operate with either natural gas as fuel or electricity, in order to generate the desired heat energy required to heat up the water for domestic use. With many other components within an energy stock, exchanges of internal and kinetic energies constitute the flow of irreversibility and reduction of system efficiency. Ogedengbe et al. [16] had covered similar modeling of energy exchanges at the wall of a micro-fluidic device, where exergy losses are contributed to slip-flow irreversibility at the near-wall of the micro-channel. This DSM study corroborates the same statement of the Second Law approach that energy conversion, between two different levels of state, introduces irreversibility; and only sensitivity analysis can reveal the optimal energy system efficiency. It is capable of leading to an improvement in the thermal comfort and indoor air quality, reduction in the consumption of electricity and natural gas, and recommendation of efficient energy generation system [17].
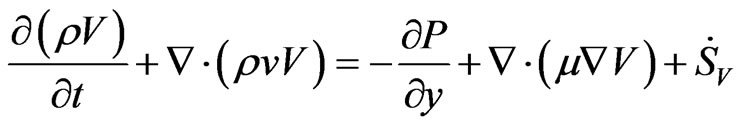
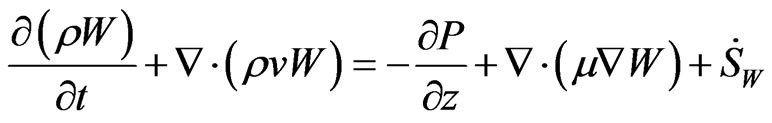
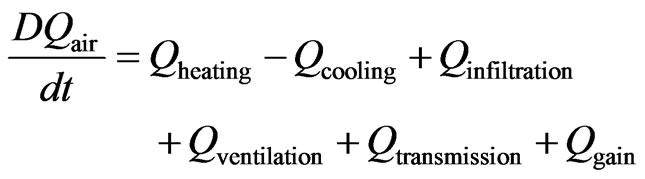
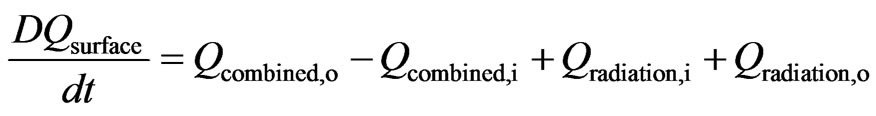
An energy stock’s control volume comprises the external boundary of a building envelope. Figure 4 shows a control volume based energy stock, modeled with threedimensional hexahedral finite elements. The boundary of this building envelope encloses a mass of fluid, representing transport of heat and fluid transport with significant energy conversion mechanisms. Assuming incompressible flows, these scalar transport variables can be predicted based on the following three-dimensional form of mass, momentum, indoor air concentration, and energy equations [18]
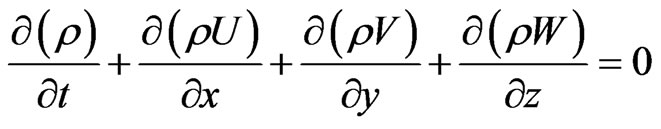 (1)
(1)
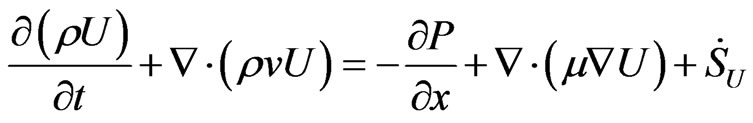 (2)
(2)
 (3)
(3)
 (4)
(4)
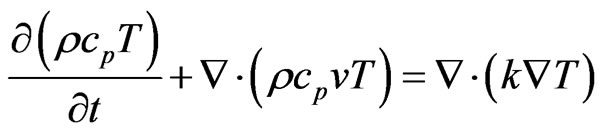 (5)
(5)
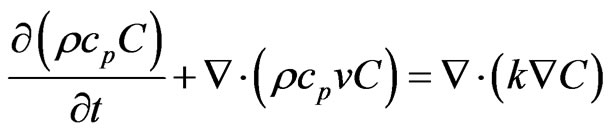 (6)
(6)
2.1. Demand-Supply Mechanism
The Ontario Electronic Business Transaction [19] (“EBT”) standard for electricity retailing and the EBT Data Transport Protocol [20] for natural gas marketing recommend the Public Key Infrastructure technology (“PKI”) as the key standard to adopt in ensuring EBT Internet security characteristics of Privacy, Authentication, Integrity, and Non-repudiation (“PAIN”). The Meter Data and Payments Transactions in Figure 5 represent the required information in order to capture the historical consumption of every ESCo Client. The inclusion of the historical usage data, for up to twenty four (24) months, represents the significant contribution of this paper to the monitoring of energy commodities supplied to the energy stock. Figure 6 shows the schematic of the energy system loads, including the energy building demand and the energy component supply. Without the analysis of the energy component supply, Sakulpipatsin et al. [21] had considered the application of exergy in the analysis of the thermal and electricity demands on the building and services that makes up the energy building system. A onezone model for the space energy balances was considered, assuming all walls are adjacent to the surrounding environment.
2.1.1. Energy Building Demand
Energy demand within every building facility is divided into two categories, including building demand and service demand. Figure 6 shows the schematic of the distributions and the component supplies. The building demand is utilized for thermal conditioning of the building envelope; while the service demand takes care of the indoor air conditioning, thermal comfort control, and the operation of all appliances. The building energy balance becomes
 (7)
(7)
 (8)
(8)
The limitation of one-zone model and other approaches where simplified evaluation of the primary energy demand is adopted is that they are not reliable for indoor quality analysis; and inadequate in region where the ranges of weather changes throughout the year play a significant role in the performance of energy systems.
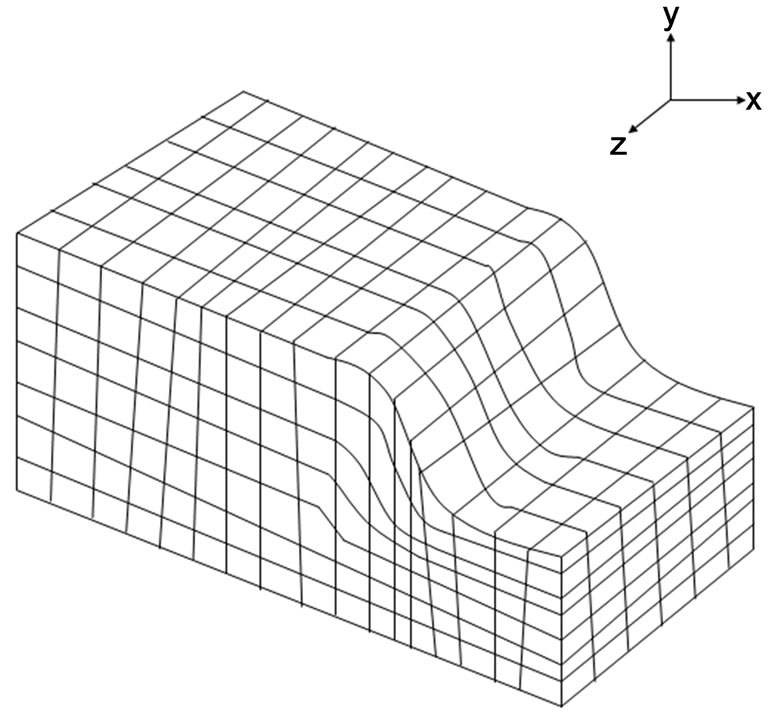
Figure 4. Control volume based energy stock, modeled with 3-D hexahedral finite elements.
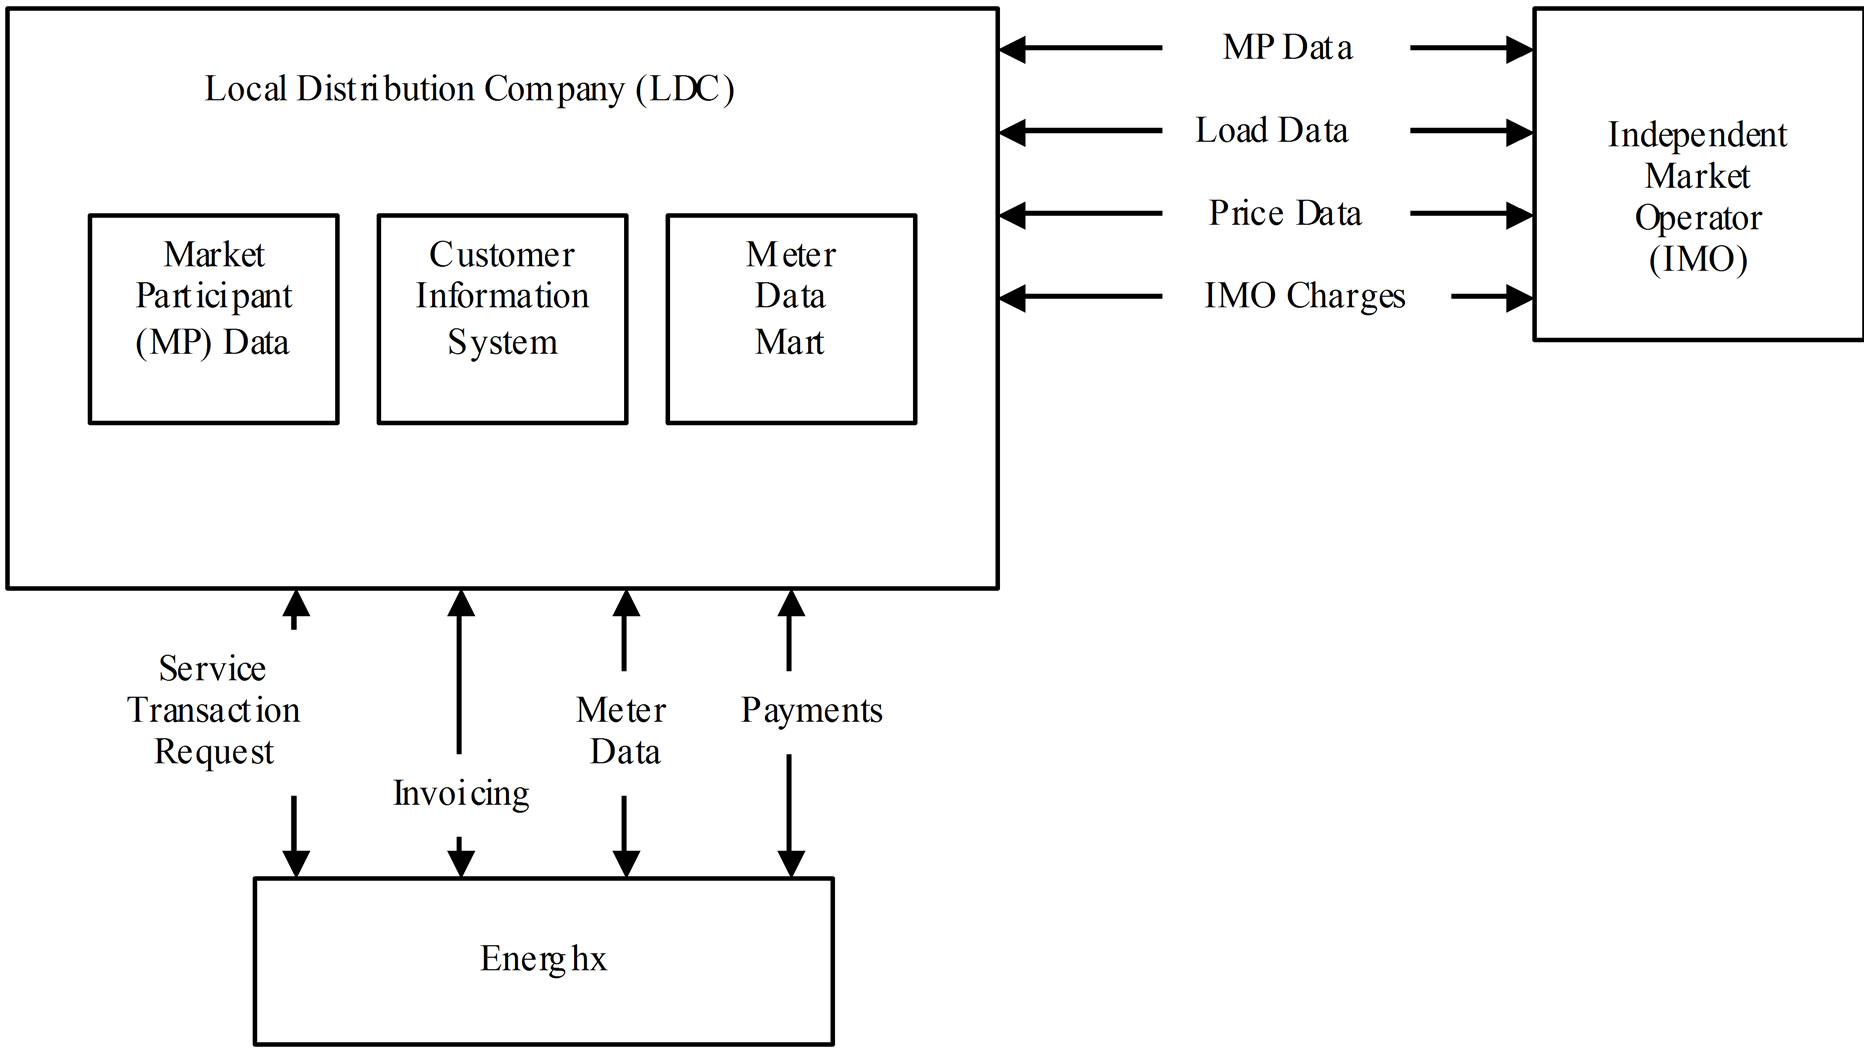
Figure 5. Ontario EBT standards for exchange of information between suppliers and LDC.
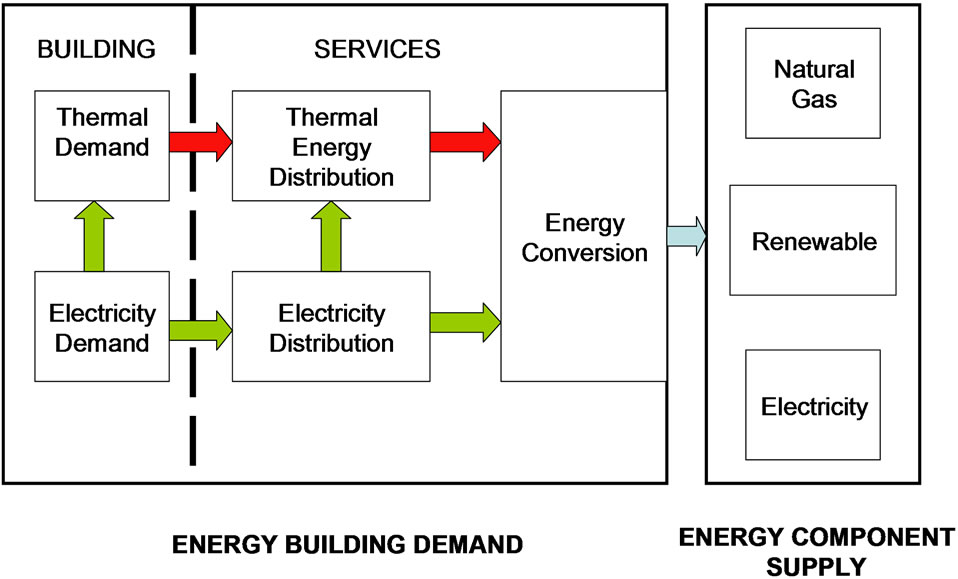
Figure 6. Schematic of the distribution of energy building demand and the energy component supply.
2.1.2. Energy Commodity Supply
The supply of electricity and natural gas in the Ontario energy market is fully deregulated. The deregulation of the electricity market, which removes the monopoly of the former Ontario Hydro, came into force in May, 2002; while the opening of the market for natural gas occured in 1986. Apart from the positive effect of deregulation on strengthening of the economic and the encouraging search for alternative sources of power, low-volume consumers have options of choosing their energy carrier from either the marketers or their local distribution companies (LDC). However, the service offers from most of the energy carriers have been limited to the marketing of price derivative supply of electricity and natural gas. Consumers merely have to choose between various marketers-determined fixed price protection plans for a maximum of five years term, or remain on the Ontario Energy Board (OEB)-determined regulated price plan, known as the standard supply service offered by their local distribution companies. While a price-derivative service offers protection against volatility of prices in the energy market, sustainablity of energy and the environment may strongly depend on alternative supply of energy based on consumption-derivative services.
2.2. Renewable Energy Supply and Integration
The concept of renewable energy supply as compensation factor at the building level represents a significant component of the bottom-up modelling approach. The compensation factor reflects the specific type of renewable energy conversion technology involved, among solar photovoltaic (solar PV), wind, biomass, etc. For example, solar PV cells/modules convert solar irradiation from the sun into direct current of electricity. With the proposeddemand side monitoring of energy stocks, the grouping of series of solar PV modules is designed to meet the expected system requirement and the available space for installation. Efficient harvest of the energy from sunlight is possible when the modules are oriented between southeast and south-west. For a typical distributed solar PV system designed for a rooftop installation in the City of Ottawa, Table 1 presents the required component descriptions for snow and wind loads calculation.
Conventional design consideration without the audit of the energy building demand leaves far too many uncertainties about the economic and sustainable viability of the proposed distributed generation project. Figure 6 shows a schematic of the energy demand and distribution within the system and proposed supply mix. The total design load calculated in Table 1 on the basis of roof zone, external wind and snow loads do not consider the demand loads of the consumer. Its capacity is beyond the consideration of independent, power generation and consumption.
3. Demand Side Monitoring
The commercial building (“C1-Ottawa”) is located in the City of Ottawa, while the residential buildings, i.e., R1- Guelph and R1-Ottawa, are located in the City of Guelph and the City of Ottawa, respectively. Energy supplies to these buildings, including electricity and natural gas, are from Energhx®. Tables 2, 3 and 4 show the physical properties of these energy stocks.
Energy consumption values were simulated for each of the components within the three energy stocks [22]. The results of the simulation are summarized in Tables 5, 6, and 7. Due diligence was exercised to obtain input data for the HOT2000 simulation software, using one or more of: a nominal power rating in the appliance’s manual; an Energuide energy consumption per year rating; and the use of a Kill-A-Watt device. The Kill-A-Watt electricity usage monitor (P3 International, Model P4400) is actually utilized to capture the consumption data for the R1-Guelph stock as shown in Table 6. By plugging any appliance into the Kill-A-Watt, the instantaneous readout
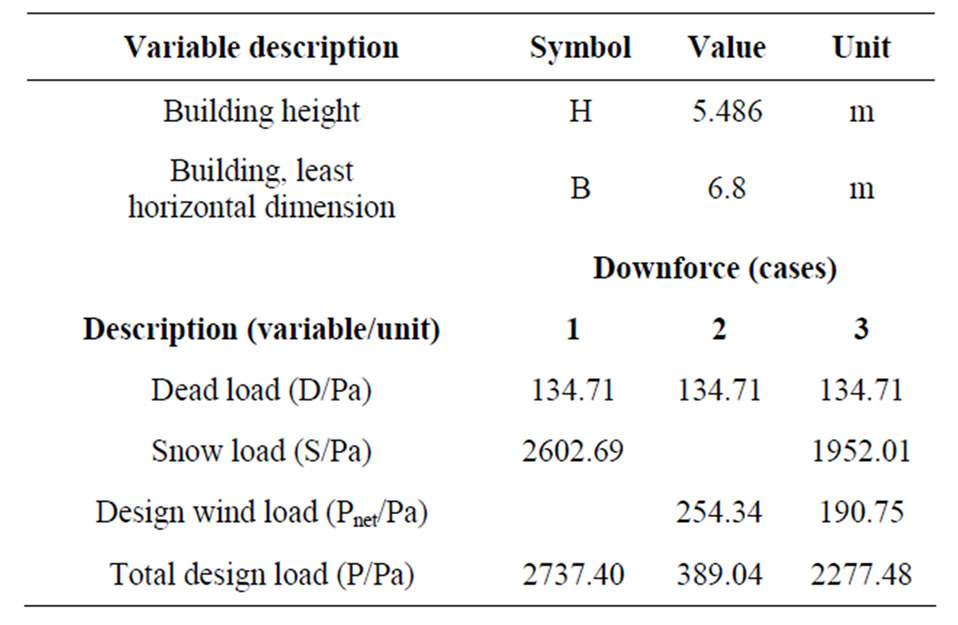
Table 1. Component considerations for design loads calculation.
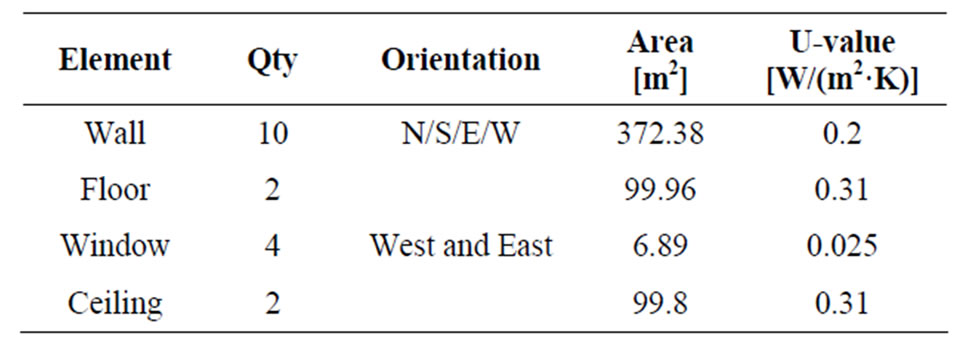
Table 2. Physical properties of C1-Ottawa building envelope elements.
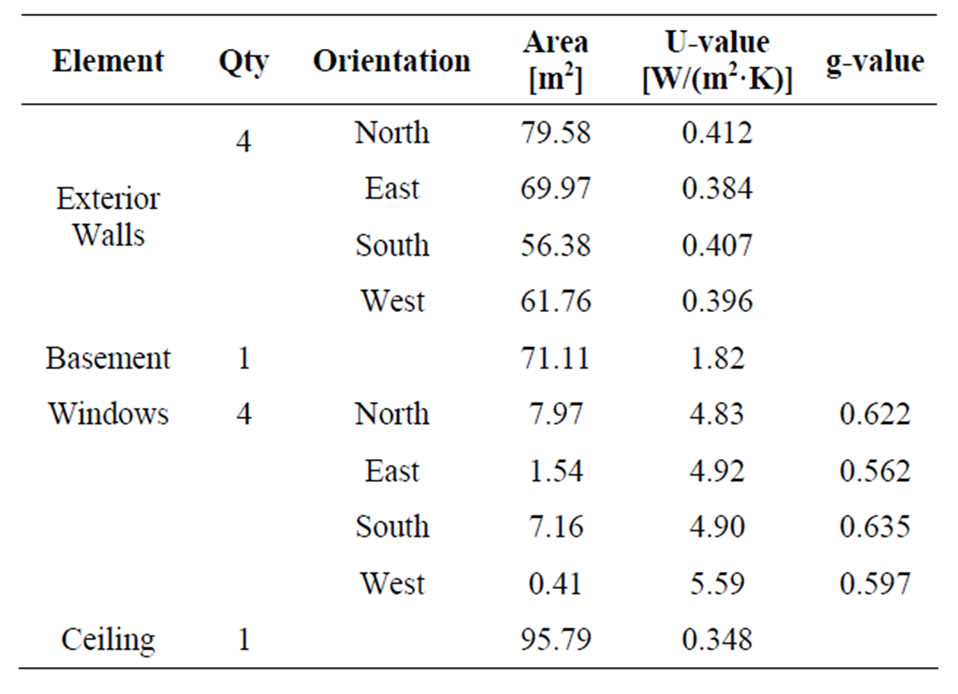
Table 3. Physical properties of R1-Guelph building envelope elements.
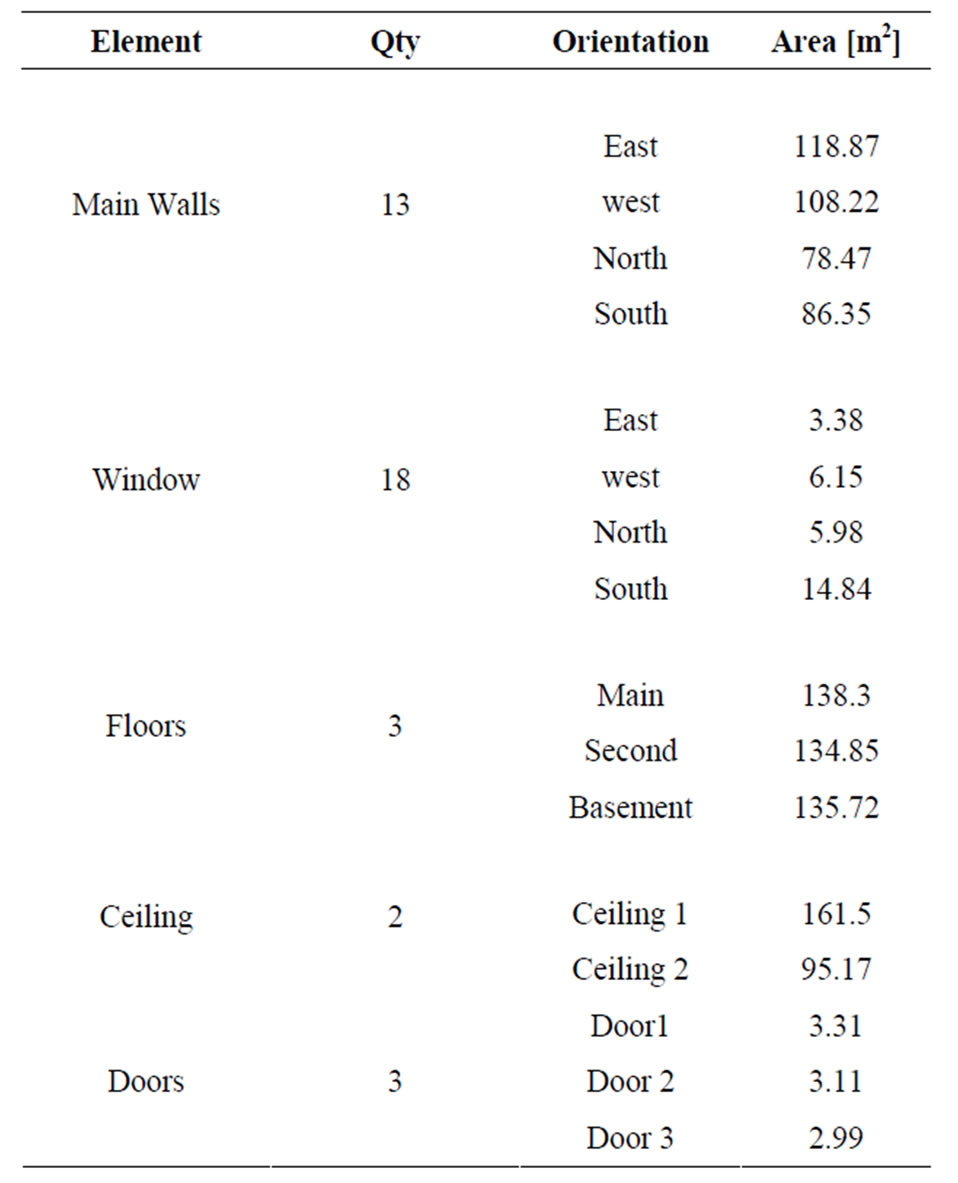
Table 4. Physical properties of R1-Ottawa building envelope elements.
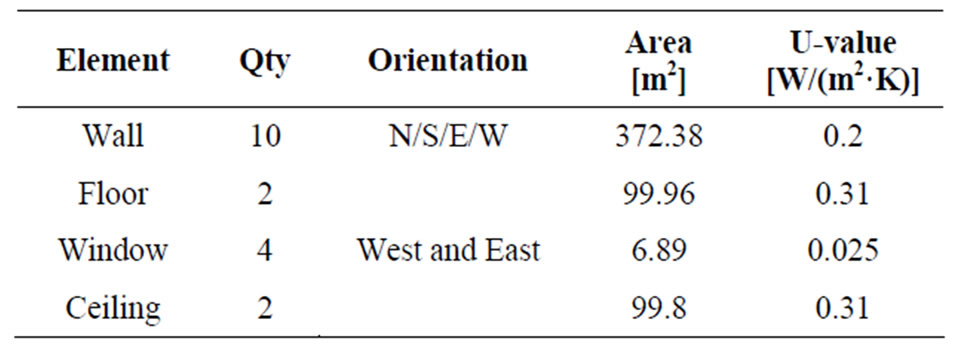
Table 5. Annual energy consumption for C1-Ottawa.
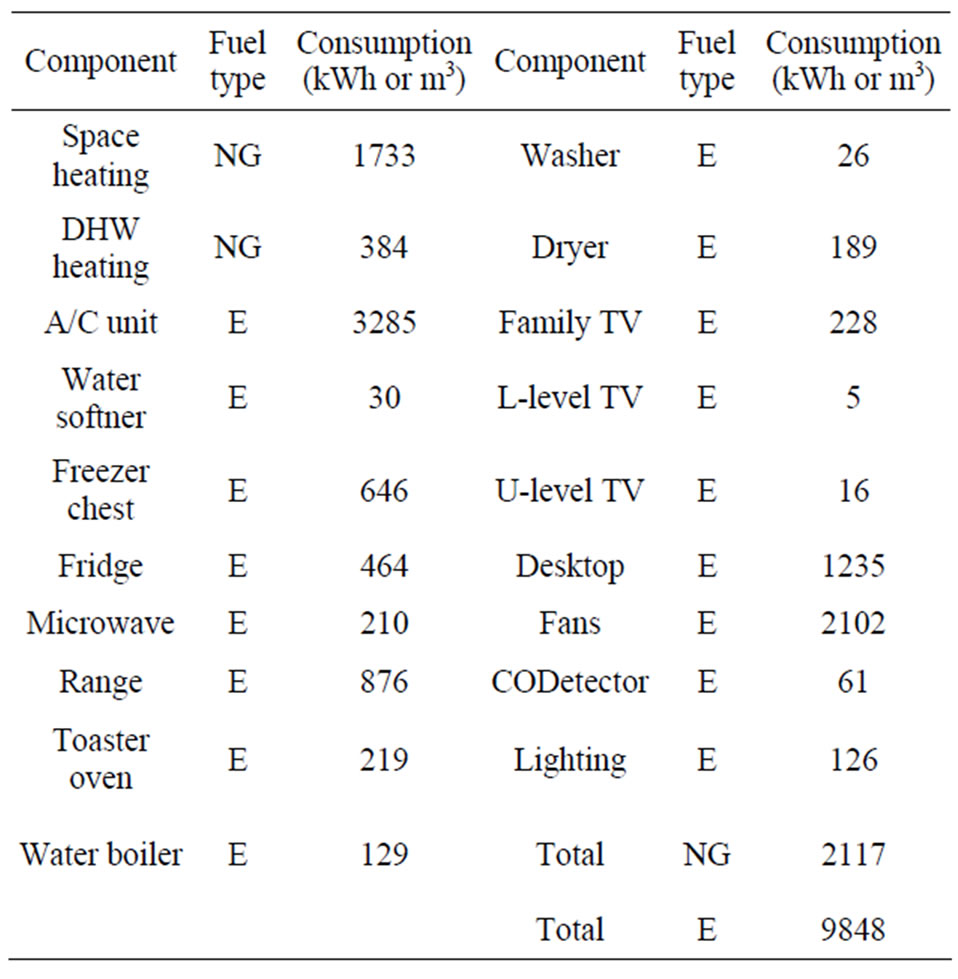
Table 6. Annual energy consumption for R1-Guelph (E = electricity; NG = natural gas).
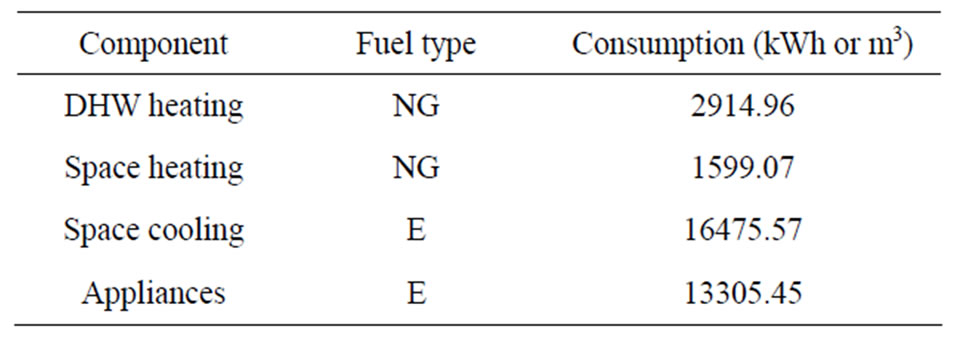
Table 7. Annual energy consumption for R1-Ottawa (E = electricity; NG = natural gas).
of its power rating, as well as a running total of energy consumed, are displayed.
HOT2000 presents the energy consumption profiles, based on behavioural pattern, weather condition, and the distribution of energy appliances, not only at an instance but along a time distribution throughout the time of year. The models of energy consumption by device are shown in Figures 7, 8, and 9. Comparison of these distributions with historical consumption profiles can provide a useful analytical tool for the development of an independent energy demand model. The simulation predicted a consistent, near-parabolic profile for the energy demand for
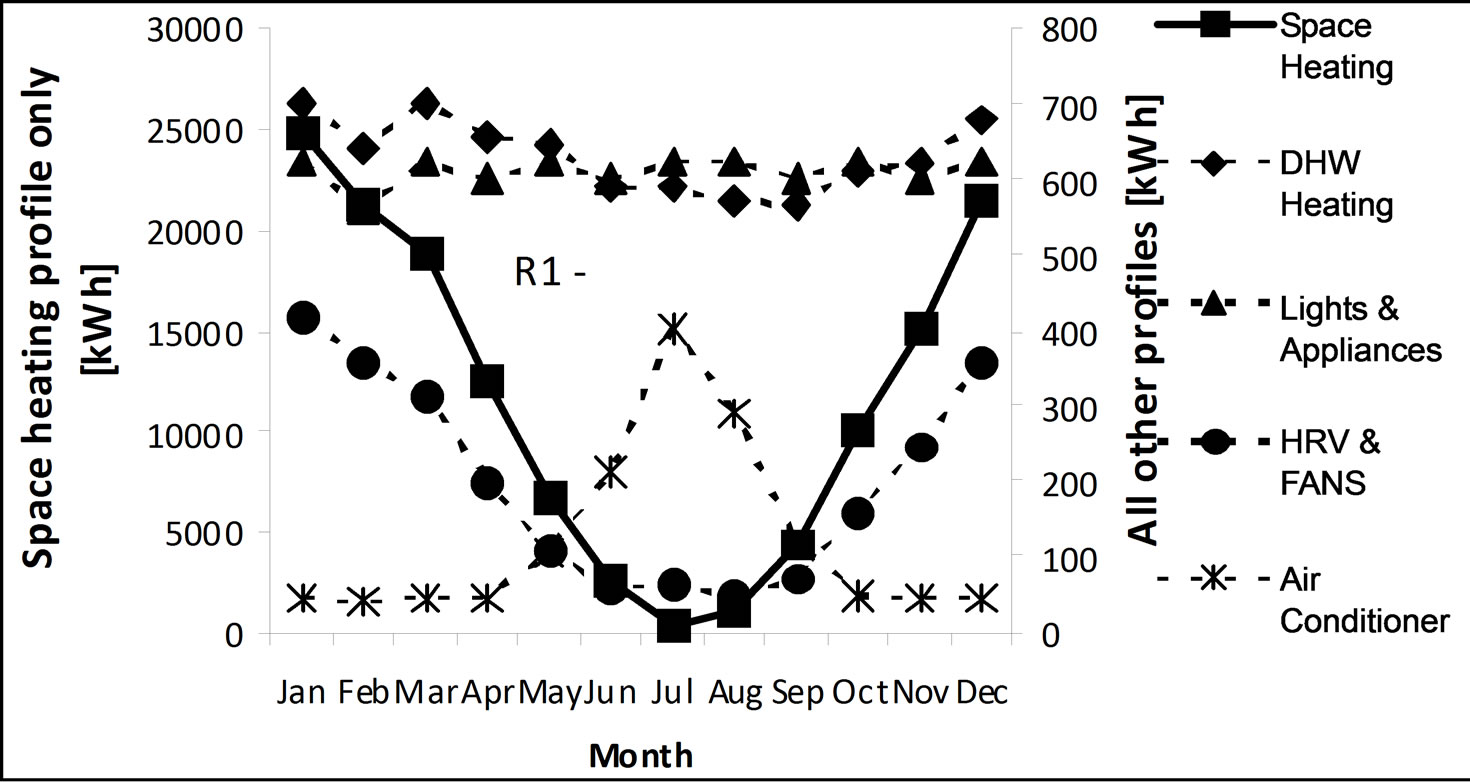
Figure 7. The monthly estimated energy consumption (by device) for the R1-Guelph stock.
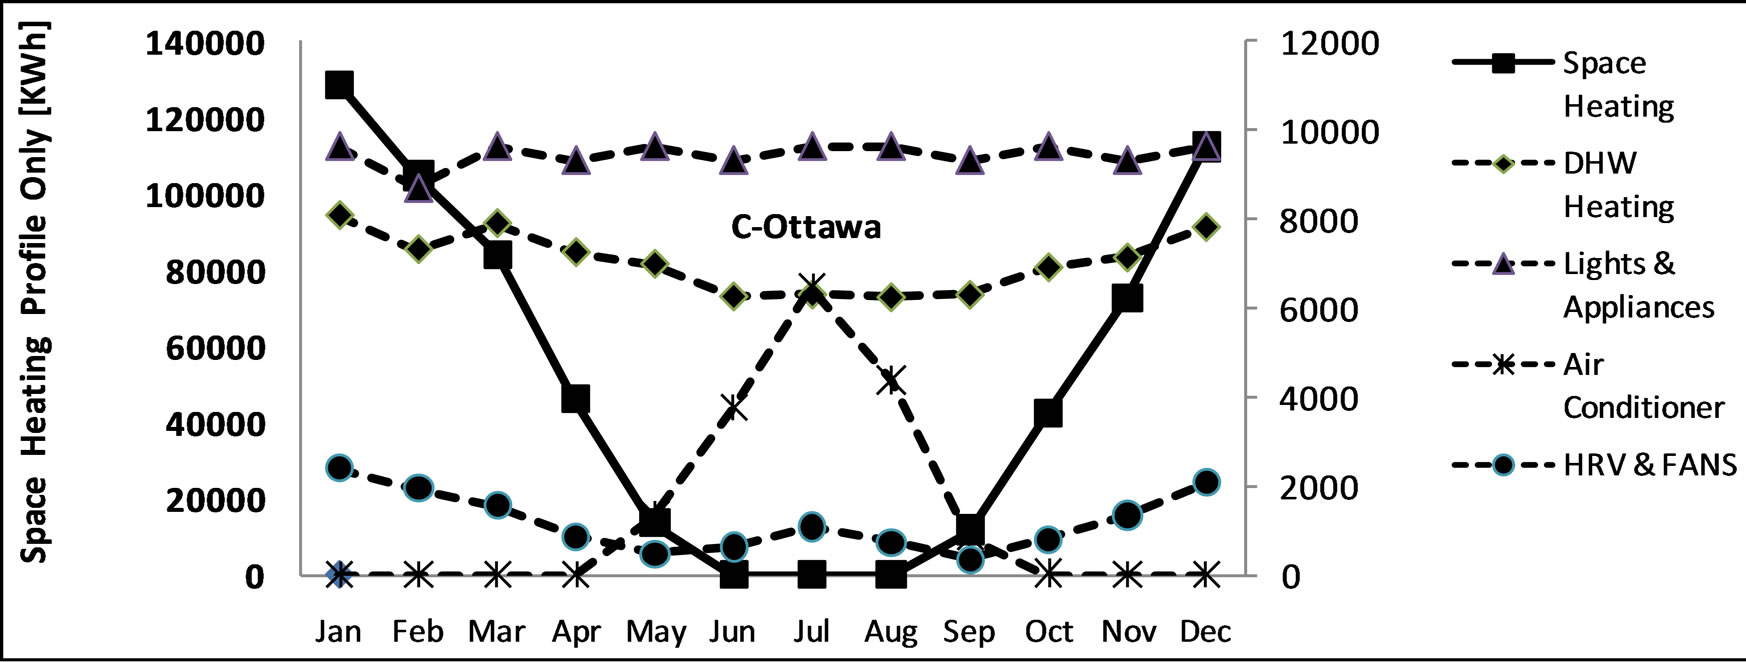
Figure 8. The monthly estimated energy consumption (by device) for the C1-Ottawa stock.
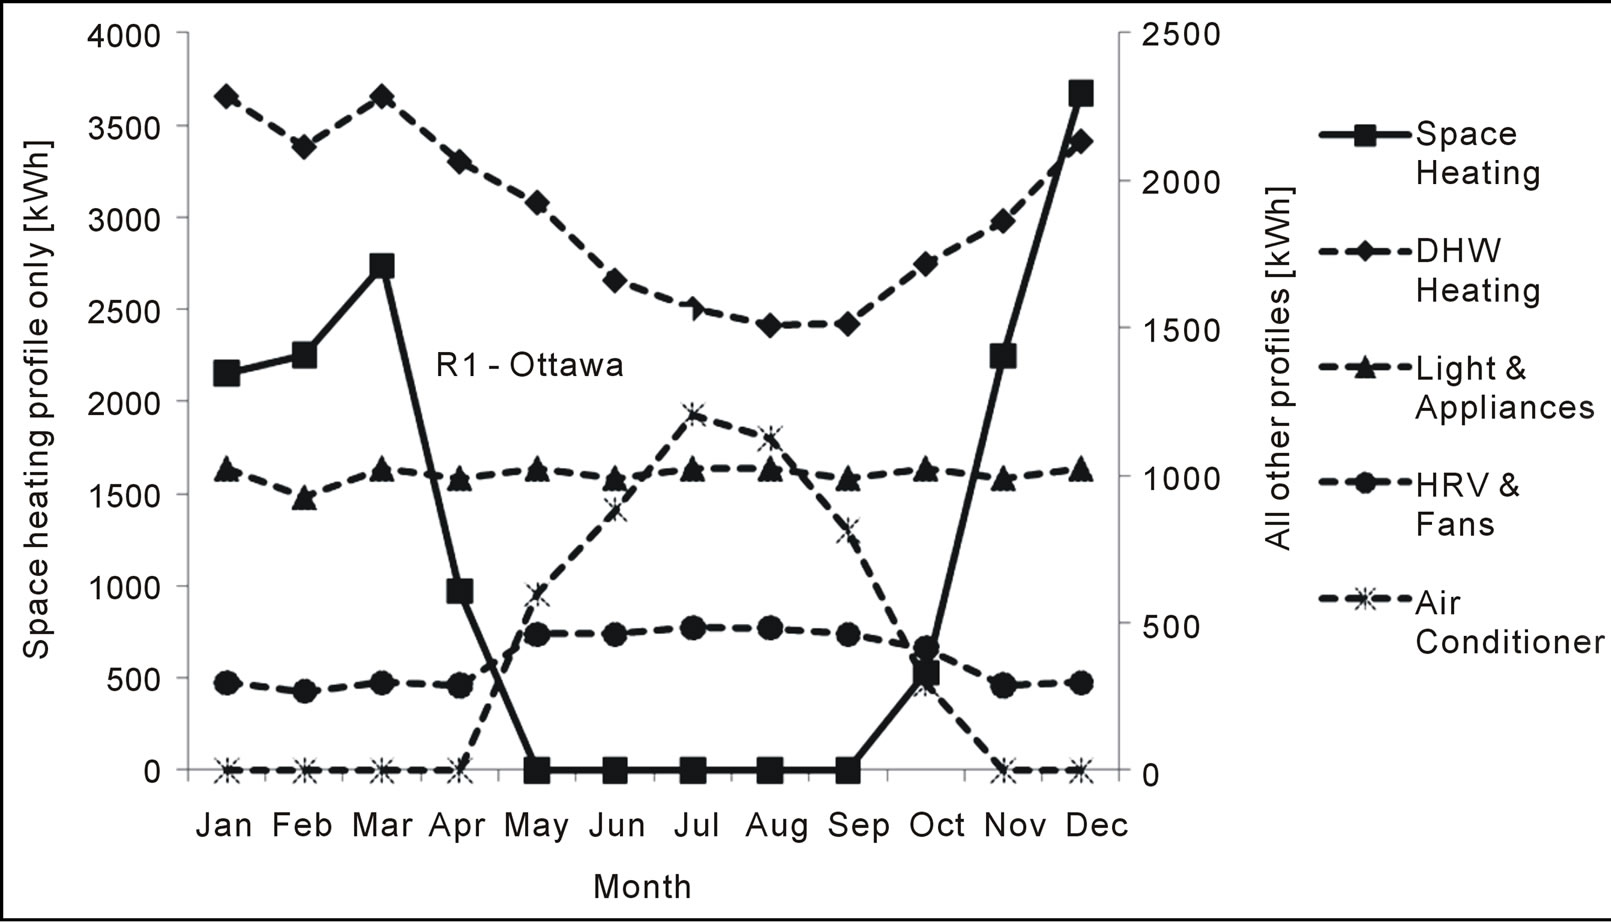
Figure 9. The monthly estimated energy consumption (by device) for the R1-Ottawa stock.
space heating for the three energy stocks. This shows a convergence in the behavioral response to the demand for space heating, and about the same weather condition prevailing in both the City of Ottawa and the City of Guelph during the period of this study. Since the fuel for space heating for these stocks is natural gas, difference in the consumption profile for natural gas would depend of the DHW Heating. Coincidentally, and unlike the DHW Heating demand for R1-Guelph, the DHW Heating demand profiles for both R1-Ottawa and C1-Ottawa appear identical.
Energy demand for space cooling peaks uniformly around the month of July for the three energy stocks considered in this study. However, a significant decrease in the gradient of the peak is noticed for the R1-Ottawa, showing more in the consumption of electricity for space cooling (see Figure 9 and Table 7). Since the proposed corrective measures toward the proposed energy saving recommendations of this study are not aimed at building retrofit services, default values in HOT2000 are used for the wall configuration, ceiling configuration, and floor configuration.
3.1. Facility Characterization
The historical consumption data for 24 months, providing a significant study of the repetition of the seasonal influence, is assessed from the local distribution companies. Figures 10, 11 and 12 show the historical consumption of natural gas and electricity for the three energy stocks. Significant peak in the consumption of natural gas duringthe winter period underscores the increase in demand for space heating and hot-water heating. Caldera et al. [9] studied the influence of the building age on the space heating demand of residential building in Torino. Both linear and power interpolations were used to obtain the statistical correlations of the building stocks. With visual inspection of the profiles over two consecutive seasons, this DSM study shows that the pattern of the consumption of natural gasis consistent for both R1-Ottawa and R1-Guelph. However, it appears that there is a significant behavioural change within this period of study that affects only the consumption of electricity. While a peak in demand for electricity both the summer and winter for R1-Guelph is attributed to space cooling and HRV & Fan respectively, both the domestic and non-domestic energy stocks in the City of Ottawa show different profiles. For example, occupancy pattern is a strong factor that influences the consumption of electricity for HRV & Fans, and lighting & appliance demands. Widen et al. [23] uses Markov chain model to generate the occupancy patterns and daylight availability in Swedish households.
Seeing that the distribution of the energy needed in a building includes heating, cooling, ventilation, hot water, lighting, and various electric appliances [24]; the complexity of the distribution demands independent modeling of individual energy stock.
3.2. Bottom-Up Modelling Approach
The major difference between cost-based model and consumption-based model is that the former depends on the conventional model for price forecasting of energy commodity, which is tied to the top-down or aggregate analysis of the market; while the consumption-based model depend on the characteristics of the end-users’facilities. Significant among the top-down models are the time series and simulation models, including the market assssment and portfolio strategies (MAPS) algorithm and the UPLAN software [25]. However, the proposed bottom-up modelling approach is strictly a
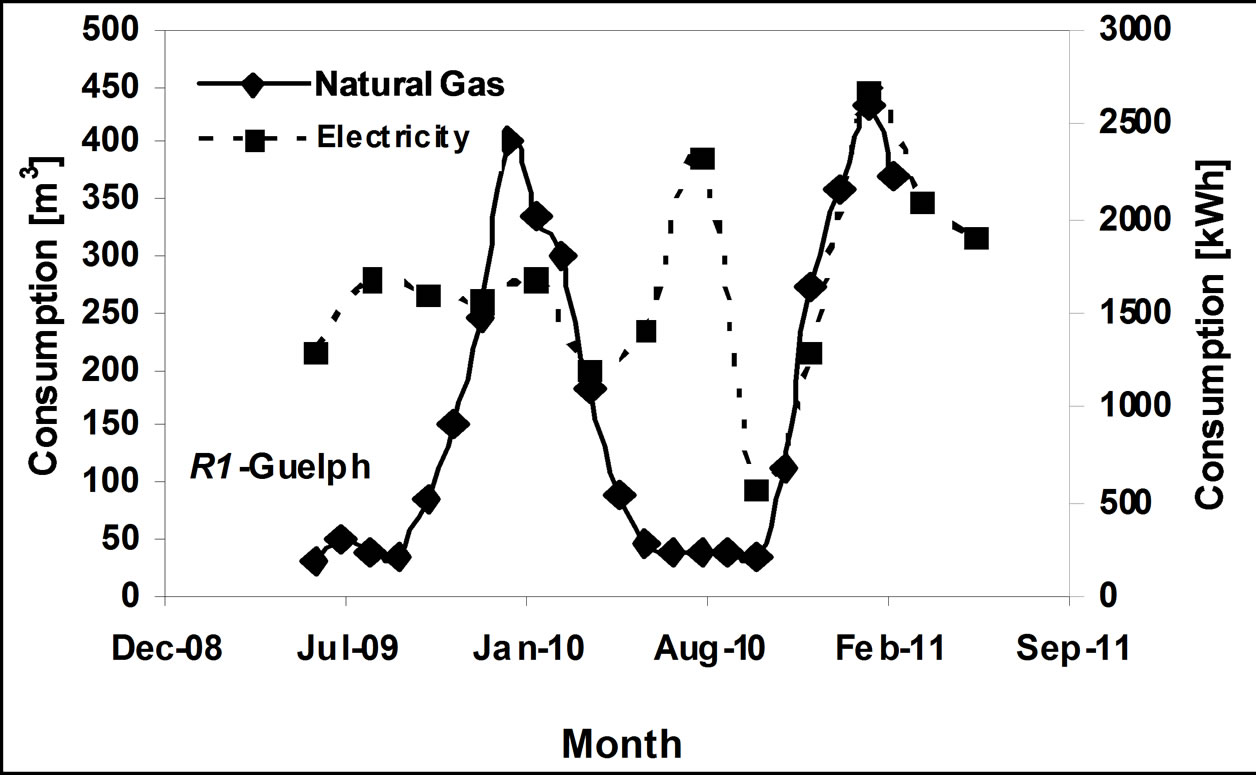
Figure 10. Electricity and natural gas load shape for R1-Guelph stock.
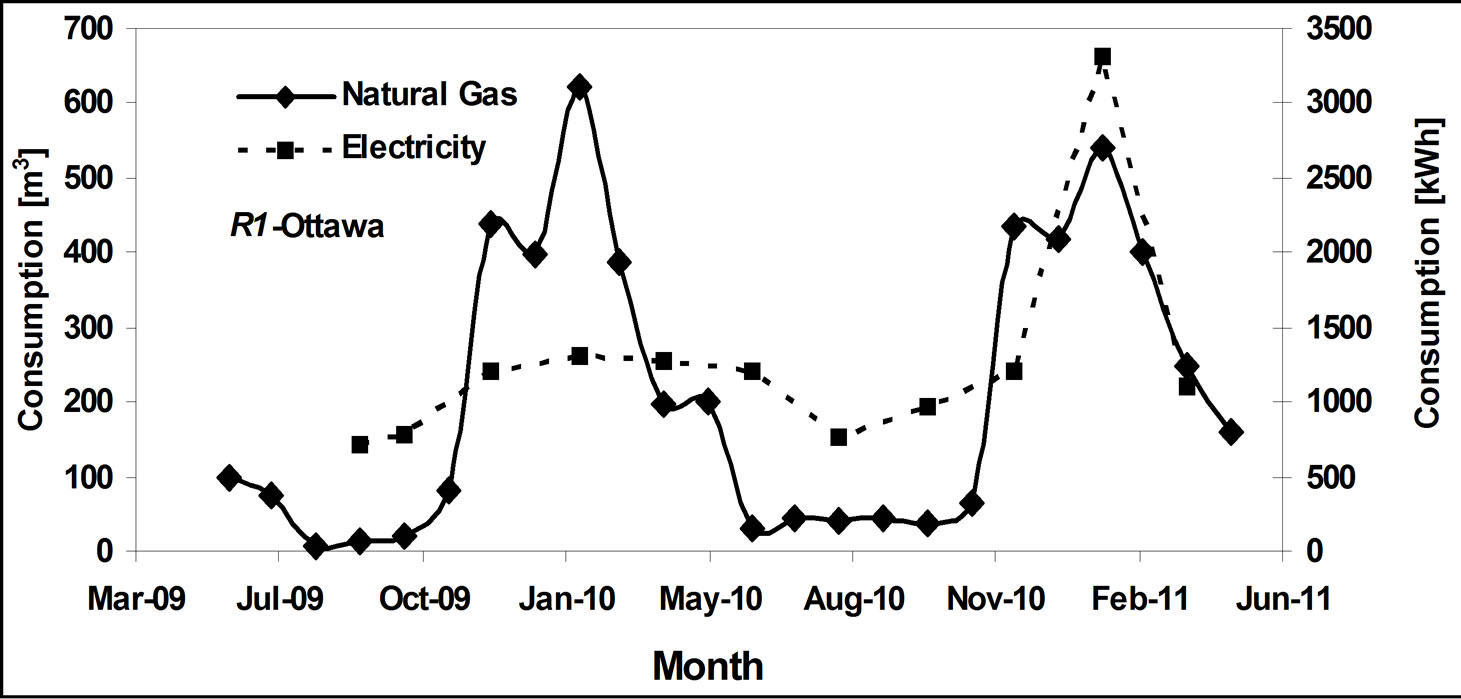
Figure 11. Electricity and natural gas load shape for R1-Ottawa stock.
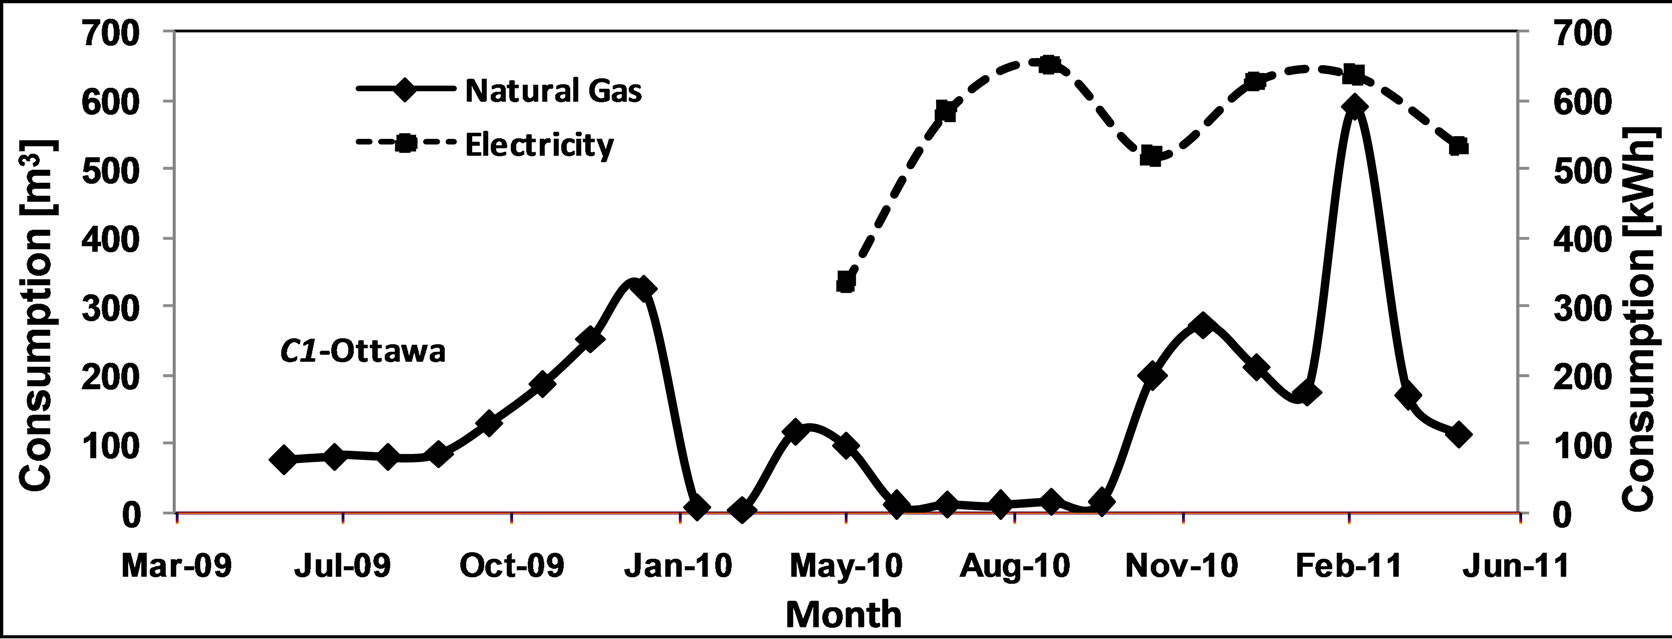
Figure 12. Electricity and natural gas load shape for C1-Ottawa stock.
time-series model, based on the characterization of the facility demands for thermal comfort, indoor air quality and electrical appliance loads. Aggrawal et al. [24] identified three types of time-series models, including the parsimonious stochastic model, artificial intelligence model and the regression model. While the stochastic model is characterized by univariate discrete analysis with autoregressive modelling of energy price spikes and mean reversion, the artificial intelligence models are non-parametric models that map the input-output relationships without exploring the underlying process. Although, the regression model is adopted in this study, the predictor variables are characterized with the thermal comfort, indoor air quality and electrical appliance load at the individual energy stock or building level.
Proposing a m-predictor-variable regression analysis, including the indoor concentration of CO2, occupancy, weather, wattage and usage frequency of electrical appliances, and indoor temperature, the consumption of electricity and natural gas within each energy stock can be modelled. The forecast of electricity and natural gas consumption represents a significant planning tool for the demand side monitoring of in order to provide a consumption-saving offering of energy supply to clients.The generalized polynomial regression based DSMonitorTM app characterizes the facility of individual consumer in order tocapture consumption as criterion variable,  (see Equation (9)) for each of the energy commodity.
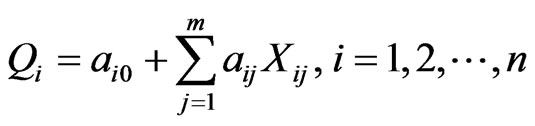 (9)
(9)
where n represents total number of energy commodities, Xij denotes the predictor variables, and the regression coefficients are denoted by aij The regression coefficients are characterized with the thermal comfort and indoor air quality at the Engineering Lecture Theatre (ELT) of the Faculty of Engineering, University of Lagos (Figure 13).
4. Conclusion
Demand side monitoring of residential and commercial facilities in the City of Ottawa, the City of Guelph, and Nigeria is conducted. Characteristics of energy components within each facility, in addition to time-series
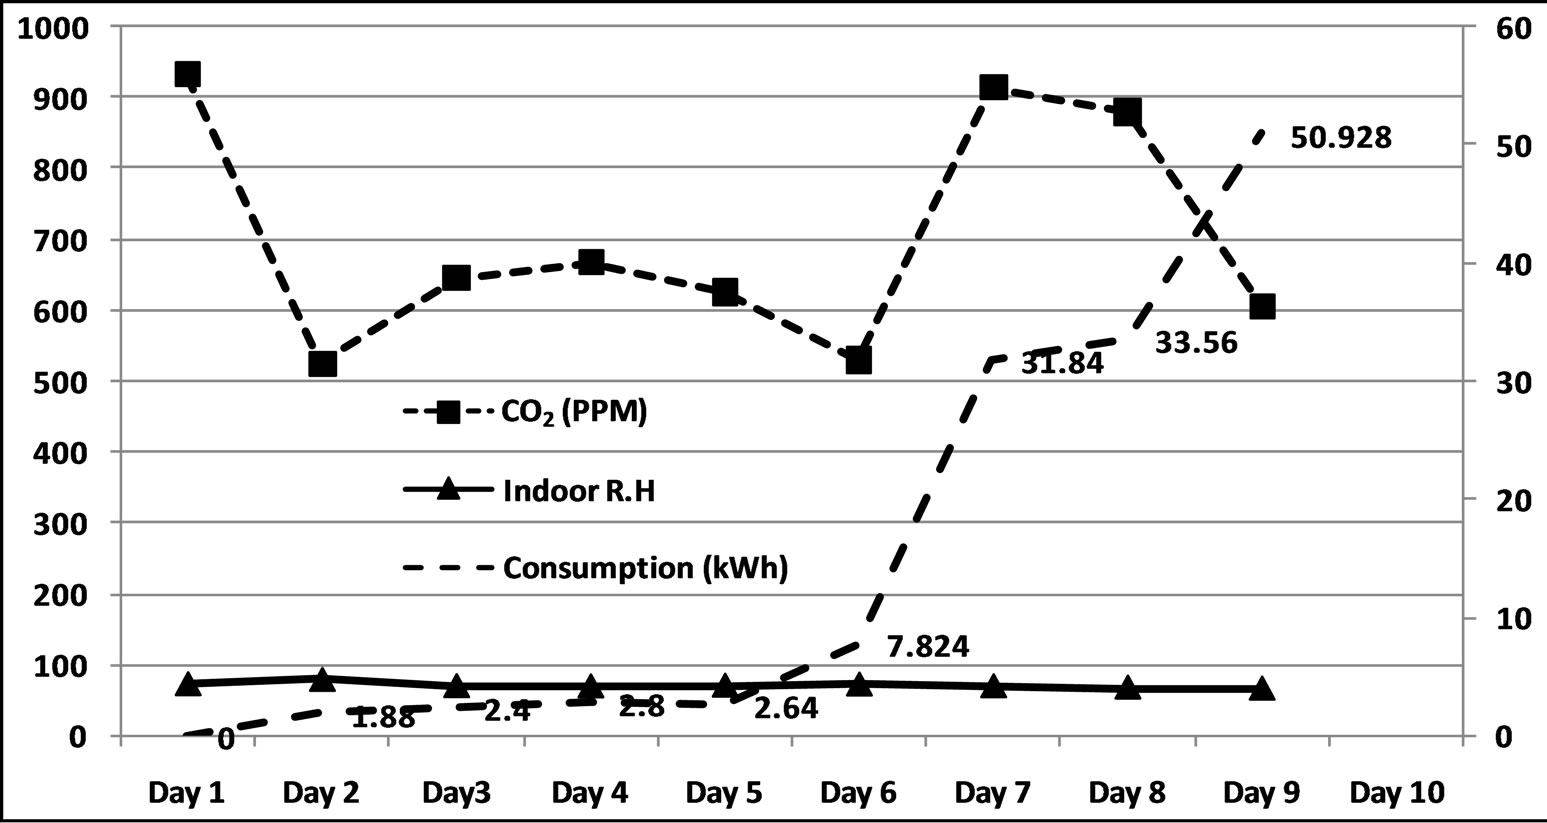
Figure 13. Bottom-up model based on thermal comfort and IAQ for the ELT stock.
modelling and data-mining, are captured. Analysis of these data results in an independent forecasting model for each energy stock, thereby generating an effective tool for engineering service recommendations and designs, which is recommended. In addition, exergetic analysis of the developed energy models led to recommendation of specific iterative service intervention; and path to possible enhanced energy system efficiency. The system efficiency of the proposed high efficiency homes and businesses is projected to lead to economic and environmental saving advantages.
5. Acknowledgements
The efforts of Green Energy Associates of Energhx and research students at the University of Lagos are appreciated. Also, the co-operation of Energhx ESCo clients, whose residences and businesses were used for this study, is greatly acknowledged.
REFERENCES
- E. O. B. Ogedengbe, Z. A. Adem, D. Kraehling and A. Mathur, “Demand Side Monitoring with Solar PV-Based Renewable Energy Supply to Commercial Sectors,” 26th European Photovoltaic Solar Energy Conference and Exhibition, 6CV.1.16, PV Taking-Off: Large Scale Deployment, Hamburg, 5-9 September 2011.
- H. Lund, A. Marszal and P. Heiselberg, “Zero Energy Buildings and Mismatch Compensation Factors,” Energy and Buildings, Vol. 43, No. 7, 2011, pp. 1646-1654. http://dx.doi.org/10.1016/j.enbuild.2011.03.006
- W. Wang, Y. Xu and M. Khanna, “A Survey on the Communication Architecture in Smart Grid,” Computer Networks, Vol. 55, No. 15, 2011, pp. 3604-3629. http://dx.doi.org/10.1016/j.comnet.2011.07.010
- N. C. Nair and L. Zhang, “SmartGrid: Future Networks for New Zealand Power Systems Incorporating Distributed Generation,” Energy Policy, Vol. 37, No. 9, 2009, pp. 3418-3427. http://dx.doi.org/10.1016/j.enpol.2009.03.025
- R. B. Hiremath, B. Kumar, P. Balachandra and N. H. Ravindranath, “Bottom-Up Approach for Decentralised Energy Planning: Case Study of Tumkur District in India,” Energy Policy, Vol. 38, No. 2, 2010, pp. 862-874. http://dx.doi.org/10.1016/j.enpol.2009.10.037
- P. Denholm and R. M. Margolis, “Evaluating the Limits of Solar Photovoltaics (PV) in Traditional Electric Power Systems,” Energy Policy, Vol. 35, No. 5, 2007, pp. 2852- 2861. http://dx.doi.org/10.1016/j.enpol.2006.10.014
- A. A. Solomon, D. Faiman and G. Meron, “An EnergyBased Evaluation of the Matching Possibilities of Very Large Photovoltaic Plants to the Electric Grid: Israel as a Case Study,” Energy Policy, Vol. 38, No. 10, 2010, pp. 5457-5468. http://dx.doi.org/10.1016/j.enpol.2009.12.024
- D. Butler, “Surplus Power Costs Ontarians $35M,” Ottawa Citizen, Monday, A1, 25 July 2011.
- IEA DSM Task XVI, “Competitive Energy Services (Energy-Contracting, ESCo Services),” Final Task Report, Phase 1, 2006-2009, Graz, 2010.
- E. O. B. Ogedengbe and G. F. Naterer, “Finite Volume Computations of Convective Exergy Losses in Microfluidic Devices,” International Journal of Exergy, Vol. 5, No. 2, 2008, pp. 117-131. http://dx.doi.org/10.1504/IJEX.2008.016670
- E. O. B. Ogedengbe and M. A. Rosen, “Electro-Kinetic Pumping with Slip Irreversibility in Heat Exchange of CSP-Powered Bio-Digester Assemblies,” Entropy 2012, Special Issues of Exergy: Analysis and Applications, Vol. 14, No. 12, 2012, pp. 2439-2455.
- M. Filippi, “Linee di Ricerca per una Procedura Finalizzata alla Certificazione Energetica Degli Edifici,” Ingegneri Torino, Technical Review of the Engineer Association of the District of Torino, Vol. 1, 2005, p. 47.
- M. Caldera, S. P Corgnati and M Filippi, “Energy Demand for Space Heating through a Statistical Approach: Application to Residential Buildings,” Energy and Buildings, Vol. 40, 2008, pp. 1972-1983.
- S. Schiavon and A. K. Melicov, “Energy Saving and Improved Comfort by Increased Air Movement,” Energy and Buildings, Vol. 40, No. 10, 2008, pp. 1954-1960. http://dx.doi.org/10.1016/j.enbuild.2008.05.001
- E. O. B. Ogedengbe, “Thermal Management with SolidFluid Slip Irreversibility Treatment in Conjugate Devices,” Journal of Thermodynamics, Vol. 2009, 2009, Article ID: 176495. http://dx.doi.org/10.1155/2009/176495
- E. O. B Ogedengbe, M. A. Rosen and G. F. Naterer, “Slip-Flow Irreversibility of Dissipative Kinetic and Internal Energy Exchange in Microchannels,” Journal of Micromechanics and Microengineering, Vol. 16, No. 10, 2006, pp. 2167-2176. http://dx.doi.org/10.1088/0960-1317/16/10/033
- E. O. B. Ogedengbe, R. U. Eteure and M. A. Rosen, “A Modified PMV Model for Indoor Thermal Comfort Analysis: Case Study of a University Cafeteria,” The Open Renewable Energy Journal, 2013, under review.
- E. O. B. Ogedengbe and G. F. Naterer, “Convective Flux Dependence on Upstream Flow Directionality in Finite Volume Computations,” Numerical Heat Transfer A, Vol. 51, No. 7, 2007, pp. 617-633. http://dx.doi.org/10.1080/10407780600939651
- Ontario EBT Working Group, “Electronic Business Transaction Standard Document for Retail Settlement in the Electric Retail Open Access Industry,” Version 3, February 2005.
- Ontario EBT Working Group, “EBT Data Transport Protocol,” Version 3, February 2005.
- P. Sakulpipatsin, L. C. M. Itard, H. J. Van der Kooi, E. C. Boelman and P. G. Luscuere, “An Exergy Application for Analysis of Buildings and HVAC Systems,” Energy and Buildings, Vol. 42, No. 1, 2010, pp. 90-99. http://dx.doi.org/10.1016/j.enbuild.2009.07.015
- E. O. B. Ogedengbe, D. Kraehling and Z. A. Adem, “Demand Side Monitoring of Energy Systems in Ontario’s Residential and Commercial Sectors,” 9th Annual International Energy Conversion Engineering Conference, AIAA 2011-5871, San Diego, 31 July-3 August 2011.
- J. Widen, A. M. Nilsson and E. Wackelgard, “A Combined Markov-Chain and Bottom-Up Approach to Modelling of Domestic Lighting Demand,” Energy and Buildings, Vol. 41, No. 10, 2009, pp. 1001-1012.
- I. Sartori, B. J. Wachenfeldt and H. G. Hestnes, “Energy Demand in the Norwegian Building Stock: Scenarios of Potential Reduction,” Energy Policy, Vol. 37, No. 5, 2009, pp. 1614-1627. http://dx.doi.org/10.1016/j.enpol.2008.12.031
- S. K. Aggarwal, L. M. Saini and A. Kumar, “Electricity Price Forecasting in Deregulated Markets: A Review and Evaluation,” Electrical Power and Energy Systems, Vol. 31, No. 1, 2009, pp. 13-22.