Open Journal of Urology
Vol.3 No.1(2013), Article ID:28008,9 pages DOI:10.4236/oju.2012.31003
Structure and Composition of Non-Infectious Phosphate Calculi Formed in Patients with Low and High Urinary Phosphate Concentrations
1Laboratory of Renal Lithiasis Research, University Institute of Health Sciences Research (IUNICS), University of Balearic Islands, Palma de Mallorca, Spain
2University of Jan Evangelista Purkyně, Faculty of Environmental Studies, Ústí nad Labem, Czech Republic
Email: *fgrases@uib.es
Received December 14, 2012; revised January 19, 2013; accepted January 28, 2013
Keywords: Non-Infectious Phosphate Renal Calculi; Phosphaturia; Calciuria; Etiological Factors
ABSTRACT
Objective: The aim of this paper was to assess the relationships among chemical, phase and structural composition and etiopathogenic factors of non-infectious phosphate calculi formed in patients with low and high urinary phosphate concentrations, and to characterize the mechanism of their formation related on biochemical results. Material and Methods: Twelve samples of phosphate renal calculi were obtained, 4 from patients with low phosphaturia and 6 from patients with high urinary phosphate concentrations. Their chemical composition was determined qualitatively by energy dispersive X-ray analysis and quantitatively by spectrophotometric and thermal analysis; and their phase composition was determined by Fourier transform infrared transmission spectroscopy and X-ray diffraction. The structure of the calculi was assessed by scanning electron microscopy. Results: Non-infectious phosphate renal calculi of patients with low phosphaturia consist of poorly crystalline carbonate hydroxyapatite, whereas those of patients with high urinary phosphate concentrations consist of poorly crystalline hydroxyapatite with some amount of calcium oxalate crystals. Calculi of patients with high urinary phosphate concentrations are formed at urinary supersaturation with respect to hydroxyapatite and calcium oxalate about 4 times higher than in patients with low phosphaturia. Conclusion: In patients with low phosphaturia, the non-infectious phosphate renal calculi are formed in urine near pH 7 and contain only poorly crystalline carbonate hydroxyapatite. In patients with high urinary phosphate concentrations and hypercalciuria, the calculi are formed in urine near pH 6 and consist of both poorly crystalline hydroxyapatite and some amount of calcium oxalate crystals.
1. Introduction
Non-infectious calcium phosphate renal calculi, representing around 10% of all renal stones [1], are composed of either biological hydroxyapatite (BHAP) alone (i.e., poorly crystalline calcium-deficient hydroxylapatite containing magnesium as a minor element), or also contain calcium oxalate monohydrate and/or dihydrate as a second minor constituent [2]. However, the relationship between the type of stone and the biochemical conditions under which stones form is not yet fully understood.
All stones containing calcium phosphate form in urine at higher pH [3-6]. In addition, hypercalciuria and hyperphosphaturia are often associated with phosphate stones [4,7]. Elevated urinary pH may be associated in some patients with renal tubular acidosis [8], but usually occurs in women without any clinical alterations [7]. Recently a large study of all types of calcium phosphate calculi, including those associated with urinary tract infection that also contain struvite, showed that hypercalciuria was present in 87% of patients with brushite-containing calculi and in 60% of those with hydroxyapatite stones, whereas renal tubular acidosis was associated with hydroxyapatite stones showing a peculiar morphology [9]. That study, however, did not fully assess the characteristics of stones in patients with high urinary phosphate concentrations. To identify the etiopathogenic factors of non-infectious phosphate renal calculi, we therefore examined the structural characteristics and chemical composition of calculi formed in patients with low and high values of urinary biochemical parameters considered as potentially lithogenic (P > 30 mM, Ca > 4.25 mM).
2. Material and Methods
2.1. Material
Twelve spontaneously passed non-infectious phosphate renal calculi were obtained, 6 from patients with low phosphaturia (group I) and 6 from patients with high urinary phosphate concentrations (group II; Table 1). Calculi 3, 4 and 5 were obtained at different times from the same patient, who had been diagnosed with recurrent lithiasis. Group I calculi were of a darker greyish beige color than group II calculi.
Following passage from a patient, the outer surface of each calculus was dried with cotton wool, placed in a tightly closed test tube and kept at ambient temperature. Each calculus was divided into several parts which were viewed by scanning electron microscopy followed by semi-quantitative assessment of Ca, Mg, P and carbon (C) content by energy dispersive X-ray (EDX) analysis. Selected samples were then used for wet analysis to determine calcium, phosphorus and magnesium content, thermal analysis and X-ray diffraction and Fourier transform infrared spectroscopy (FTIR) for phase identification.
2.2. Electron Microscopy
Samples were glued to a metallic support and viewed with a Hitachi S 3400N scanning electron microscope (SEM) and a Bruker EDX analyzer. The samples were not covered with gold as the spectral line of gold interferes with that of phosphorus and distorts the results of EDX analyses. Several randomly selected sites approximately 0.25 mm2 in area (large areas) on each sample and several of approximately 0.25 mm2 in each large area (small area) were subjected to EDX analysis. Due to the non-destructive nature of SEM analysis, all fragments with different morphology of a same calculus were observed to get a general feature of its composition and structure and also to select representative samples for further investigation.
2.3. Chemical Wet Analysis
Calculus samples were dried for 2 hours in a desiccator over silica gel and dissolved in 12 M HCl at ambient temperature for 24 h. Each sample was diluted in deionized water to 10 ml and filtered to remove undissolved organic matter. The concentrations of calcium, magnesium and phosphorus in each solution were determined spectrophotometrically using a Microplate Spectrophotometer PowerWave XS (Biotek Instruments, Inc., Winoosk, VT), as described [10]. Each spectrophotometric determination of each solution was repeated 3 times. The filters containing undissolved organic matter were dried at 40˚C in a laboratory drier to constant weight, usually for 2 hours, and then weighed.
2.4. X-Ray Diffraction and FTIR
Approximately 10 mg of each sample were pulverized and used for X-ray powder diffractometry using an XRD diffractometer (Bruker-Siemens D5000, Bruker AX GmbH Karlsruhe, Germany). About 5 mg of pulverized calculus was mixed with 200 mg of dry KBr, homogenized and pressed to prepare a disc, which was used for recording FTIR transmission spectrum with a Bruker IFS66 infrared spectroscope (Bruker AXS GmbH, Karlsruhe, Germany).
2.5. Thermal Analysis
Thermal analysis was performed by heating pulverized samples, weighing 7 - 13 mg, at a rate of 10˚C per minute from ambient temperature of 25˚C to 1000˚C in a nitrogen atmosphere using an SDT 2960 Simultaneous DSC-TGA (TA Instruments, New Castle, DE, USA). For each run, we obtained 3 curves, one each for weight loss (TG), derivative weight loss (DTG) and differential temperature (DTA).
3. Results
Table 1 shows the total (analytical) concentration of elements and organic anions in the urine of stone formers. Urinary supersaturation with hydroxyapatite and calcium oxalate for each group could be evaluated using the mean concentrations of each. For example, the concentration of (free) calcium ions was calculated by subtracting the amount of calcium bound in strong complexes with citrate, using the dissociation constants for citric acid [11] and the stability constant of the CaCitr- complex (7 × 10⁴ L/mol [12]), from its analytical concentration. Using this method, we found that the mean concentrations of (free) calcium ions in group I and group II calculi were 0.24 mmol/L and 0.35 mmol/L, respectively. The percentages of total phosphorus at the given pH, calculated from the dissociation constants of phosphoric acid [13] and reported as  ions, were 31% and 4.6% in groups I and II calculi, respectively. Using the procedure described previously [14], we calculated that the supersaturation of urine with respect to carbonate hydroxyapatite was 6.0 for group I (the solubility product of hydroxyapatite containing 2.2 wt% carbonate was 1.17 × 10−57 mol9/L9 [15]) and 23.6 for group II (the solubility product of stoichiometric hydroxyapatite was 2.03 × 10−59 mol9/L9 [13]). We did not correct supersaturation for particle size because it changes the absolute values by the same numerical factor for the same particle size and has no effect on the supersaturation ratio, i.e. 23.6/6 ~ 4.
Speciation of oxalate, using the dissociation constants for oxalic acid [16], showed that most of the oxalate in urine of both groups was present only as the anion Ox2−. Using the concentrations of free calcium ions and the solubility product of calcium oxalate monohydrate (8.65 mol2/L2 [17]), we found that the supersaturation of urine with calcium oxalate monohydrate (COM) was 1.8 for group I and 8.0 for group II.
The chemical composition of the 12 calculi, based on wet analysis of single fragments, is shown in Table 2. Repeated determinations of each element using the same solution were found to deviate in absolute values by less than 5% each for Ca and P and less than 3% for Mg.
To evaluate the reliability of the generally accepted practice of reporting the chemical composition of a calculus based on analysis of single fragment, six fragments from two calculi (three from each) were randomly selected, dissolved and analyzed by the wet method. The Ca, Mg and P contents of each calculus fragment are shown in Table 3. All analyzed calculi contained organic
Table 1. Urinary biochemical data in patients producing studied calculi*.
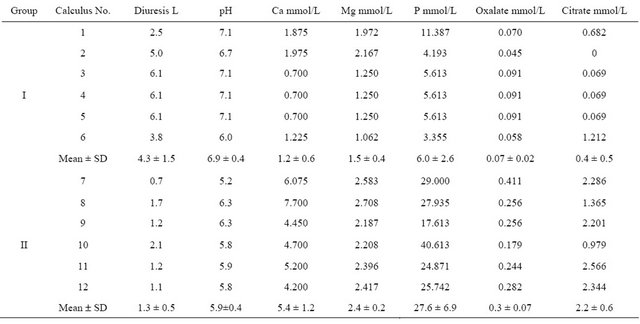
*(N = 4 Group I, N = 6 Group II).
Table 2. Chemical composition of studied calculi.
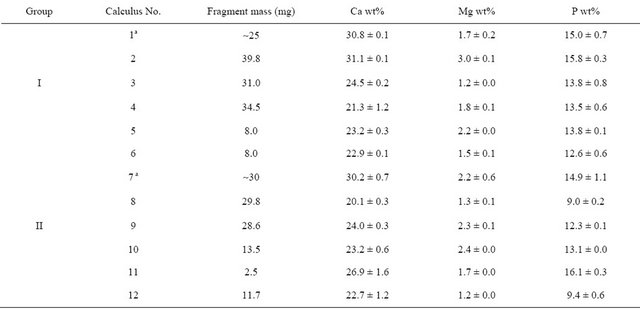
aAverage from Table 3.
Table 3. Chemical composition of 3 fragments of the same calculus.
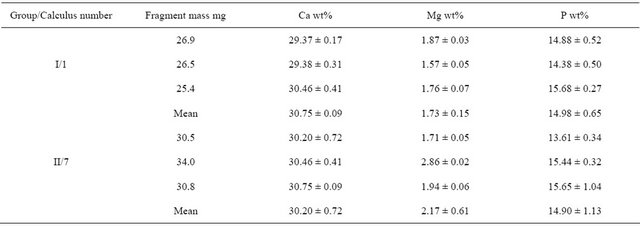
Values expressed as mean ± SD, N = 3.
matter, which was observed on the filter, but in a quantity insufficient for reliable gravimetric determination. The content of organic matter was gravimetrically determined in one sample, when a sufficient amount of calculus (0.2 g) was used; this calculus (No. 1) contained 5.1 wt% organic matter.
Each calculus yielded several larger fragments, as well as crushed sand-like material or individual round objects approximately 4 mm long and 2 mm wide. The calculi forming these round objects exhibited an uneven compact surface composed of closely connected rounded structures. The interior of these calculi was either hollow or completely filled by slightly porous matter. The inner structures of group I calculi (Figure 1) were highly non-uniform, consisting of a seemingly amorphous compact phosphatic phase, often containing intergrown ellipsoidal objects of up to 100 mm in diameter (Figure 1(d)) and small spheres with diameters of approximately 5 mm (Figure 1(c)). The phosphatic phase is present as separated featureless large blocks or undulated irregular layers compounded into large pieces. Ellipsoidal objects and small spheres are either disseminated throughout the calculus or occur in large assemblies. The surfaces of the ellipsoidal objects were always smooth, but the surfaces of the small spheres were either smooth or spiky with small leaves oriented perpendicularly to the sphere surface. Each calculus, however, contained spheres of only one type, i.e., either all smooth or all spiky. Group I and II calculi had similar structural features, but group II calculi (Figure 2) always contained pyramidal crystals typical of calcium oxalate dihydrate (COD) irregularly scattered throughout the interior (Figure 2(d)), as well as small spheres with spiky surfaces and a minimum number of round intergrown objects. The structure of sample 7 differed from that of the other calculi classified as group II. This calculus consisted of white fragments composed exclusively of smooth regular spheres and
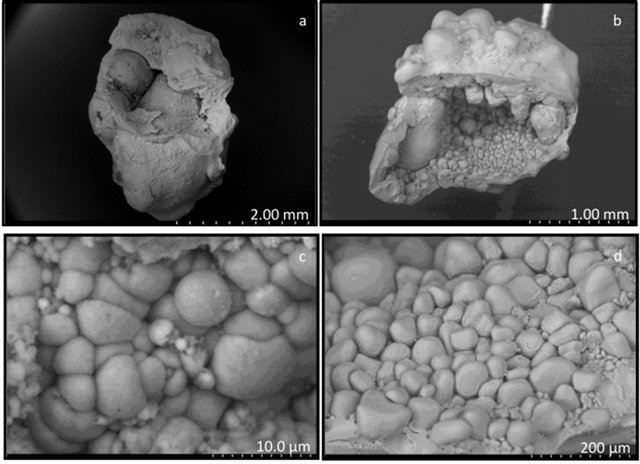
Figure 1. Scanning electron microscope images of type I caculi. (a), (b) General view of calculi sections; (c) Partially intergrown small spheres (<10 µm) with smooth surface; (d) Relatively large (50 - 200 µm) round elliptical objects.
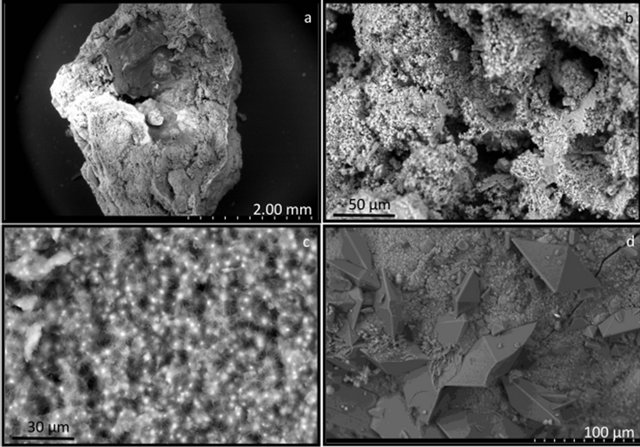
Figure 2. Scanning electron microscope images of type II calculi. (a) General view of a calculus section; (b) Irregular layers and small spheres; (c) Small spheres spiky with small leaves oriented perpendicularly to the sphere surface; (d) Hydroxyapatite and COD crystals.
irregularly shaped ellipsoidal objects with smooth sur faces, both of diameters less than 10 mm, as well as beige fragments containing significant amounts of flat and columnar crystals of COM.
The X-ray diffraction spectra of all six group I calculi were identical and consisted of a high background and wide peaks of hydroxyapatite, indicating poor crystallinity of the solid phase. The X-ray diffraction spectra of group II calculi contained, in addition to the peaks corresponding to hydroxyapatite (with the exception of sample No. 7, which showed peaks corresponding to Ca3(PO4)2, known as whitlockite), very narrow peaks, nearly lines, characteristic of crystalline COM. Peaks characteristic of COD were not present. No peaks of struvite were identified.
The IR spectra of all samples exhibited several common features, including a mostly featureless broad absorbance band with a sharp maximum between 900 and 1200 cm−1, an indistinct peak at 960 cm−1 and a high frequency shoulder typical of poorly crystalline hydroxyapatite [18], although this band in sample 7 was broader, with 5 sharp maxima (Figures 3(a) and (b)). These IR spectra also showed absorptions at 565, 604 and 873 cm−1 characteristic of crystalline hydroxyapatite [19] and a broad band from 3700 to 2800 cm−1 and a weak band at 1645 cm−1 indicating structural water in the molecular form [20]. Group I calculi showed absorptions in the vicinity of 1420 and 1460 cm−1 characteristic of carbonate hydroxyapatite [21]. The IR spectra of group II calculi showed strong absorption bands characteristic of COM at 780, 1315 and 1620 cm−1 [22,23] (although sample 10 only showed an absorption band at 1620 cm−1), bands missing from group I spectra, with a band at 1420 but not at 1460 cm−1, except for sample number 8, which contained both.
The thermal analysis results (TG, DTG and DTA curves) were similar for calculi of the same group, but there were differences between group I and II calculi (Figure 4). All calculi showed continuous loss of weight during heating, up to the upper limit of the temperature range, i.e. 1000˚C. In specific temperature regions, however, accelerated weight loss resulted in the appearance of peaks or concave regions (signifying a maximum rate of weight loss) on the corresponding DTG curve. The width of the temperature range corresponding to a similar thermal event differed slightly for individual samples. The upper limiting temperature of the preceding thermal event signified by the appearance of a peak (or convex region) on the DTG curve was only occasionally equal to the lower limiting temperature of the following event.
The DTG curves of group I calculi displayed a sharp maximum around 75˚C, a wide flat maximum between 200˚C and 500˚C and a final peak at 700˚C to 900˚C. DTA curves showed two indistinct exothermic peaks at
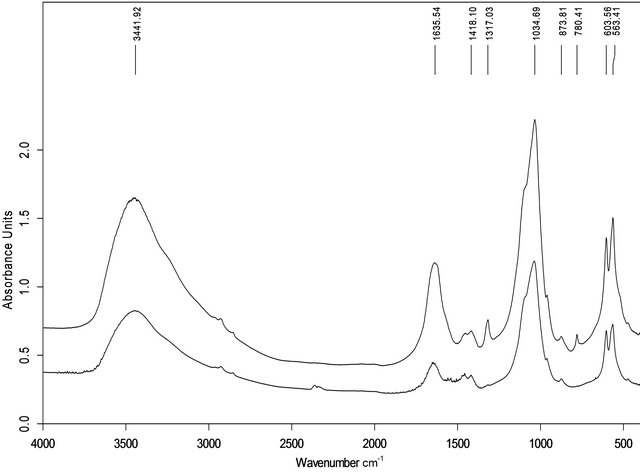
Figure 3. FTIR spectra of sample of group I (a, No. 3) and II (b, No.9).
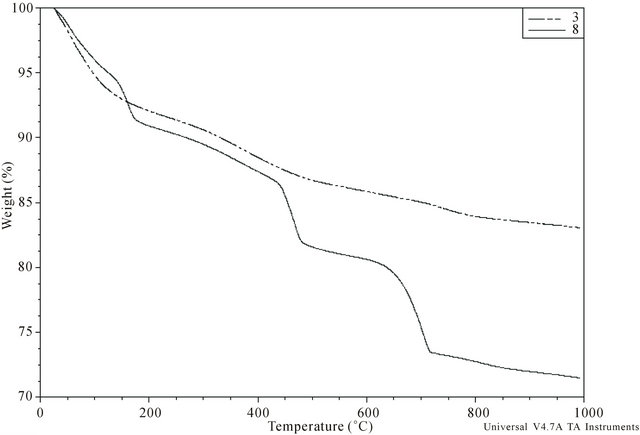
Figure 4. Typical TG curve of sample belonging to the group I (No. 3) and II (No. 8).
550˚C and 700˚C, with the former not associated with any significant weight loss. There were no maxima on either the DTA or DTG curves between 500˚C and 700˚C.
The DTG curves of the group II calculi showed sharp maxima around 75˚C and 130˚C, with 4 of the 6 also showing a wide maximum between 200˚C and 400˚C. Further well pronounced sharp maxima appeared at 450˚C and 700˚C in all 6 samples, with three also showing a minor wide maximum around 800˚C. Weight loss causing sharp maxima on the DTG curves resulted from endothermic processes, as shown by the minima on DTA curves at these temperatures.
The loss of mass of each calculus during heating was determined, including loss due to adsorbed water and organic matter. Weight loss at temperatures below 75˚C was regarded as due to adsorbed water in both groups. For calculi in group I, the amount of organic matter was calculated from loss of mass between 500˚C and 700˚C and the amount of carbonate in dry carbonate hydroxyapatite was calculated from the loss of mass between approximately 700˚C and 950˚C [24,25]. For calculi in group II, the content of COM was calculated from loss of mass at approximately 450˚C due to the release of CO accompanying the decomposition of anhydrous calcium oxalate (CaOx) to yield calcium carbonate [26,27], with results expressed as the percent weight of COM in dry calculus, i.e., the initial mass of the calculus minus adsorbed water. Loss of mass around 700˚C is caused by the release of CO2 due to the decomposition of carbonate and by the pyrolysis of organic matter. Assuming that all water (adsorbed, crystalline and lattice) and organic matter are completely removed at 700˚C, group I calculi consist of 79.0 wt% - 86.2 wt% (median, 84.4 wt%) of inorganic compounds.
The molar ratio of Ca/P in group I calculi can be directly calculated from the results shown in Table 3. For group II calculi, this molar ratio must be corrected for calcium bound in CaOx (Table 4). The mean ± SD corrected molar Ca/P ratios in group I and II calculi were 1.38 ± 0.11 and 1.26 ± 0.11, respectively; if, however, there is no correction for Ca bound to COM in group II calculi, the mean ratio is 1.55 ± 0.22. The mean ± SD Ca/Mg molar ratios in group I and II calculi were 8.54 ± 2.31 and 7.94 ± 2.26, respectively, and the mean ± SD Mg/P molar ratios were 0.17 ± 0.04 and 0.19 ± 0.04, respectively. None of these ratios in individual calculi corresponded to similar ratios calculated from biochemical data.
EDX analysis of the chemical composition of calculi showed that calcium, phosphorus, oxygen and carbon were major elements, whereas magnesium and sodium
Table 4. Results of thermal analysis.
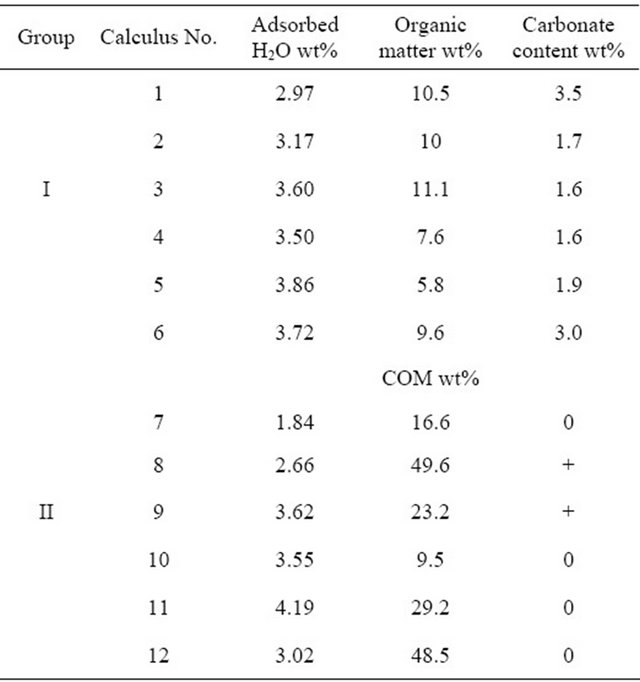
+ = weakly carbonated hydroxyapatite.
were minor elements in all calculi. Calculi numbers 9 and 12 also contained small amounts of potassium. Within each sample, there were substantial variations in the Ca and P contents and the molar Ca/P ratios of individual large and small areas. In contrast, the chemical composition of the phosphatic phase was remarkably constant. Magnesium and sodium contents were roughly constant in different areas of the same calculus, but differed among calculi.
Calcium content in calculi is a linear function of urinary calcium concentration, with similar slopes but different intercepts for groups I and II calculi. These linear correlations were statistically significant at the 95% confidence level for groups I (R2 = 0.81,  = 0.66) and II (excluding sample No. 8, R2 = 0.92,
  = 0.77) calculi. Similar correlations, however, were not observed for magnesium and phosphorus.
The content of total carbon, both inorganic and organic, varied widely within samples, between 6 and 35 wt%, with wide variations even within the same large area. Because of neither struvite crystals nor bacterial imprints were detected in any studied calculi, this demonstrating the non-infective origin of these calculi.
4. Discussion
Used methods of quantitative wet chemical analysis provide consistent results during repeated determinations, with standard deviations less than 5% of the mean value, and therefore can be regarded as reliable methods for analyzing inorganic components (Ca, Mg, P) of renal calculi. The chemical composition of different fragments of the same calculus did not differ significantly, with calcium, magnesium and phosphorus varying in reasonable limits (SD ~ 2%, 4% and 8% of the mean value, respectively). Therefore determining the composition of a renal calculus based on analysis of a single fragment weighing approximately 30 mg satisfactorily reflects the chemical composition of the entire calculus. However, Ca/P ratios calculated using data from repeated determinations varied considerably, indicating that these ratios are not reliable determinants of actual type of phosphate in renal calculi.
The considerable structural and compositional nonhomogeneity of all 12 calculi indicates that the urinary composition in which they were formed differed considerably. At urinary pH ~ 7, non-infectious calculi consist of hydroxyapatite containing around 2 wt% of carbonate groups. At urinary pH ~ 6, however, the calculi contain hydroxyapatite (except for sample number 7, which contained whitlockite), all of them without carbonate. These findings are in agreement with results showing that bicarbonate ions are not present in urine below pH 6, but their concentration increases exponentially at higher pH as pH increases [28].
The composition of urine varies widely over time, as also shown by spatial variations in stone composition. Thus, biochemical findings in individual patients are only loosely connected to conditions under which the actual stone is formed. However, supersaturation of average urine may provide general information on the tendency to form a particular solid phase. The urine of both groups of calculi was highly supersaturated with hydroxyapatite, making this the major component of each stone. Although the average urine in groups I and II was supersaturated with both COM and COD, since the solubility product of these compounds is very similar [17], CaOx was present only in group II calculi. This may be due to fractional precipitation, in that the less soluble compound, hydroxyapatite, precipitates prior to the more soluble compounds, COM and COD. When urine becomes saturated, or slightly supersaturated, with hydroxyapatite, the formation of Posner’s clusters Ca9(PO4)6 [29] decreases the concentration of ionic calcium, and hence decreasing supersaturation with CaOx. In patients who form group I calculi, with neither hypercalciuria nor high urinary phosphate concentrations, the urine may become even undersaturated with CaOx, preventing the formation of COM or COD nuclei. Even if COM or COD nuclei could form, their growth rate and the amount of formed solid, which are governed by an excess of the actual concentration of crystallizing compound over its equilibrium value and not by supersaturation in the case of non-stoichiometric composition of any liquid medium (in our case urine), would be negligible. This is supported by findings showing that, despite the urine of all people being supersaturated with CaOx [30], idiopathic stone formers represent a minority of the population.
Very different conditions occur in group II; the urine in these patients is not only highly supersaturated with respect to both COM and COD, but CaOx concentration in urine is about 5 times higher than in group I patients. Therefore, CaOx nuclei form easily; once formed, they grow rapidly enough to attain macroscopic size and develop a typical crystal shape. In accordance with the Ostwald’s law of stages the metastable phase—COD—is formed preferentially. However, under favourable conditions during the calculi development it can be transformed, due to its thermodynamic instability, into the stable phase—COM—through a gradual non-solution mediated phase transitioning. This means that the inner structure of the crystal corresponds to COM crystal but the external shape, characteristic of COD crystals, remains unchanged. This is justified because the X-ray diffraction studies only detected COM crystals and no COD crystals.
Our findings are in good agreement with previous results [9], which showed that the formation of group I calculi is associated with renal tubular acidosis, whereas the formation of group II calculi is associated with hypercalciuria and low urinary pH. In addition, we also showed that high urinary phosphate concentration is a characteristic of group II calculi, with all of these samples containing some amount of COM and COD.
Different processes, such as the simultaneous loss of absorbed water, the crystalline water of CaOx and the lattice water of hydroxyapatite, occur at partially or fully overlapping temperatures [31-33], making the total weight loss a superposition of weight losses associated with individual processes. Quantification of the underlying processes is therefore imprecise or even impossible, depending on the extent of overlap. This is especially applicable to absorbed water content; due to the overlapping processes of loss of absorbed and hydroxyapatite lattice water [34] and crystalline water of COM at temperatures over 100˚C, we considered only losses below this temperature that result in underestimation of adsorbed water content. The content of organic matter quoted, determined as mass lost between 500˚C and 700˚C, can serve as a rough estimate only since pyrolysis can occur at about 300˚C [33], but dehydration of hydroxyapatite [32] and decomposition of CaOx [26], if present, can occur simultaneously at temperatures up to 500˚C.
Our evaluation of COM in calculi was based on ascribing the weight loss on TG curves between 450˚C and 700˚C solely to the decomposition of calcium oxalate and calcium carbonate. If weight loss is converted to loss of moles of CO and CO2, then both would be equal to the number of moles in CaOx. Since these values in all samples differed by less than 5%, the proposed assignment of these losses is justified and the COM content in calculi, ranging from 9.5 to 45.5 wt%, can be regarded as reasonably close to reality.
The overall average calculus composition based on chemical and thermal analyses can be determined only for group I calculi, as 84.4 wt% of hydroxyapatite containing 2.2 wt% of carbonate, 3.7 wt% of adsorbed water and 9.6 wt% of organic matter, totaling 97.7 wt%. This result is reasonably accurate considering the extent of inaccuracies of thermal analysis.
5. Conclusion
Non-infectious phosphate renal calculi of patients with high urinary phosphate and calcium concentrations are formed at urinary supersaturation with respect to hydroxyapatite and CaOx about 4 times higher than in case of patients with low phosphaturia. The wide variations in stone composition are indicators of a high degree of variation in urinary composition during stone development. The concentration of calcium in calculi is directly proportional to its concentration in urine in both groups I and II. The solid phase of calculi formed in patients with low phosphaturia at urinary pH ~ 7 consists solely of poorly crystalline carbonate hydroxyapatite. Patients with high urinary phosphate and calcium concentrations and urinary pH ~ 6 form calculi consisting of poorly crystalline hydroxyapatite and some CaOx crystals.
6. Acknowledgements
This work was supported by the project grant CTQ2010- 18271/PPQ from the Ministerio de Ciencia e Innovación (Gobierno de España), FEDER founds (European Union) and the project grant 9/2011 from the Conselleria d’Educació, Cultura i Universitats (Govern de les Illes Balears).
REFERENCES
- D. B. Lusmann, “A Classification of Urinary Calculi with Respect to Their Composition and Micromorphology,” Scandinavian Journal of Urology and Nephrology, Vol. 25, No. 2, 1991, pp.141-150. doi:10.3109/00365599109024549
- F. Grases, A. Costa-Bauzá, M. Ramis, V. Montesinos and A. Conte, “Simple Classification of Renal Calculi Closely Related to Their Micromorphology and Etiology,” Clinica Chimica Acta, Vol. 322, No. 1-2, 2002, pp. 29-36. doi:10.1016/S0009-8981(02)00063-3
- J. H. Parks, F. L. Coe, A. P. Evan and E. M. Worcester, “Urine pH in Renal Calcium Stone Formers Who Do and Do Not Increase Stone Phosphate Content with Time,” Nephrology Dialysis Transplantation, Vol. 24, No. 1, 2009, pp. 130-136. doi:10.1093/ndt/gfn420
- D. Vega, N. M. Maalouf and K. Sakhaee, “Increased Propensity for Calcium Phosphate Kidney Stones with Topiramate Use,” Expert Opinion on Drug Safety, Vol. 6, No. 5, 2007, pp. 547-557. doi:10.1517/14740338.6.5.547
- F. Grases, O. Sohnel, A. I. Vilacampa and J. G. March, “Phosphates Precipitating from Artificial Urine and Fine Structure of Phosphate Renal Calculi,” Clinica Chimica Acta. Vol. 244, No. 1, 1996, pp. 45-67. doi:10.1016/0009-8981(95)06179-7
- F. Grases, A. Costa-Bauzá, I. Gomila, M. Ramis, A. García-Raja and R. M. Prieto, “Urinary pH and Renal Lithiasis,” Urological Research, Vol. 40, No. 1, 2012, pp. 41-46. doi:10.1007/s00240-011-0389-3
- A. E. Ross, S. Handa, J. E. Lingeman and B. R. Matlaga, “Kidney Stones during Pregnancy: An Investigation into Stone Composition,” Urological Research, Vol. 36, No. 2, 2008, pp. 99-102. doi:10.1007/s00240-008-0138-4
- S. Arampatzis, B. Röpke-Rieben, K. Lippuner and B. Hess, “Prevalence and Densitometric Characteristics of Incomplete Distal Renal Tubular Acidosis in Men with Recurrent Calcium Nephrolithiasis,” Urological Research, Vol. 40, No. 1, 2012, pp. 53-59. doi:10.1007/s00240-011-0397-3
- M. Daudon, H. Bouzidi and D. Bazin, “Composition and Morphology of Phosphate Stones and Their Relation with Etiology,” Urological Research, Vol. 38, No. 6, 2010, pp. 459-467. doi:10.1007/s00240-010-0320-3
- R. M. Prieto, I. Gomila , O. Sohnel , A. Costa-Bauza, O. Bonnin O and F. Grases, “Study on the Structure and Composition of Aortic Valve Calcific Deposits: Etiological Aspects,” Journal of Biophysical Chemistry, Vol. 2, No. 1, 2011, pp. 19-25. doi:10.4236/jbpc.2011.21003
- R. G. Bates and G. D. Pinching, “Resolution of the Dissociation Constants of Citric Acid at 0˚ to 50˚, and Determination of Certain Related Thermodynamic Functions,” Journal of the American Chemical Society, Vol. 71, No. 4, 1949, pp. 1274-1283. doi:10.1021/ja01172a039
- R. P. Singh, Y. D. Yeboah, E. R. Pambid and P. Debayle, “Stabiliy Constant of the Calcium-Citrate(3-)ion Pair Complex,” Journal of Chemical & Engineering Data, Vol. 36, No. 1, 1991, pp. 52-54. doi:10.1021/je00001a015
- National Institute of Standards & Technology, “SRN 2910,” Gaithersburg, 1997, pp. 1-8.
- O. Sohnel and F. Grases, “Supersaturaton of Body Fluids, Plasma and Urine, with Respect to Biological Hydroxyapatite,” Urological Research, Vol. 39, No. 6, 2011, pp. 429-436. doi:10.1007/s00240-011-0387-5
- A. Ito, K. Maekawa, S. Tsutsumi, F. Ikazaki and T. Tateishi, “Solubility Product of OH-Carbonated Hydroxyapatite,” Journal of Biomedical Materials Research, Vol. 36, No. 4, 1997, pp. 522-528. doi:10.1002/(SICI)1097-4636(19970915)36:4<522::AID-JBM10>3.0.CO;2-C
- J. I. Partanen, P. M. Juusola and A. K. Covington, “Re-Evaluation of the First and Second Stoichiometric Dissociation Constants of Oxalic Acid at Temperatures from 0℃ To 60℃ in Aqueous Oxalate Buffer Solutions with or without Sodium or Potassium Chloride,” Journal of Solution Chemistry, Vol. 38, No. 11, 2009, pp. 1385- 1416. doi:10.1007/s10953-009-9443-y
- J. Streit, L. Ch. Tran-Ho and E. Konigsberger, “Solubility of the Three Calcium Oxalate Hydrates in Sodium Solutions and Urine-Like Liquors,” Monatshefte für Chemie, Vol. 129, No. 12, 1998, pp. 1255-1236. doi:10.1007/PL00010134
- N. Pleshko, A. Boskey and R. Mendelsohn, “Novel Infrared Spectroscopic Method for the Determination of Crystallinity of Hydroxyapatite Minerals,” Biophysical Journal, Vol. 60, No. 4, 1991, pp. 786-793. doi:10.1016/S0006-3495(91)82113-0
- F. U. Khand, M. Y. Khumawar, S. Memon and A. F. Ansari, “Use of Infrared Spectroscopy for the Identification of Urinary Tract Calculi,” Vol. 13, 1991, pp. 19-24.
- L. G. Gilinskaya, T. N. Grigorieva, G. N. Okuneva and A. Y. Vlasov, “Investigation of Phatogenic Mineralization on Human Heart Valves. 1. Chemical and Phase Composition,” Journal of Structural Chemistry, Vol. 44, No. 4, 2003, pp. 622-631. doi:10.1023/B:JORY.0000017938.42883.9f
- J. Kapolos and P. G. Koutsoukos, “Formation of Calcium Phosphate in Aqueous Solutions in the Presence of Carbonate Ions,” Langmuir, Vol. 15, No. 19, 1999, pp. 6557- 6562. doi:10.1021/la981285k
- P. Carmona, J. Bellanato and E. Escolar, “Infrared and Raman Spectroscopy of Urinary Calculi: A Review,” Biospectroscopy, Vol. 3, No. 5, 1997, pp. 331-346. doi:10.1002/(SICI)1520-6343(1997)3:5<331::AID-BSPY2>3.0.CO;2-5
- D. Valarmathi, L. Abaham and S. Gunesakaran, “Growth of Calcium Oxalate Monohydrate Crystal by Gel Method Its Spectroscopic Analysis,” Indian Journal of Pure & Applied Physics, Vol. 48, No. 1, 2010, pp.36-38.
- F. Peters, K. Schwarz and M. Eppie, “The Structure of Bone Studied with Synchrotron X-Ray Diffraction, XRay Absorption Spectroscopy and Thermal Analysis,” Thermochimica Acta, Vol. 361, No. 1-2, 2000, pp. 131- 138. doi:10.1016/S0040-6031(00)00554-2
- Z. Zyman, D. Rokhmistrov, I. Ivanov and M. Epple, “The Influence of Foreign Ions on the Crystal Lattice of Hydroxyapatite upon Heating,” Materialwissenschaft und Werkstofftechnik, Vol. 37, No. 6, 2006, pp. 530-532. doi:10.1002/mawe.200600032
- A. Ficai, E. Andronescu, G. Voicu and S. Pall, “Mothodology of in Vitro Characterization of Human Uroliths,” Universitatea Politehnica din Bucuresti Science Bulletin, Series B, Vol. 72, No. 1, 2010, pp. 1454-2331.
- T. Hatakeyama and L. Zhenhai, “Handbook of Thermal Analysis,” J. Wiley, New York, 1998, pp.309-364.
- R. F. Pitts, J. L. Ayer, W. A. Schiess and P. Miner, “The Renal Regulation of Acid-Base Balance in Man. III. The Reabsorption and Excretion of Bicarbonate,” The Journal of Clinical Investigation, Vol. 28, No. 1, 1949, pp. 35-44. doi:10.1172/JCI102050
- A. Oyane, K. Onuma, T. Kokubo and A. Ito, “Clustering of Calcium Phosphate in the System CaCl2-H3PO4-KClH2O,” The Journal of Physical Chemistry B, Vol. 103, No. 39, 1999, pp. 8230-8235. doi:10.1021/jp9910340
- B. Finlayson, “Physicochemical Aspects of Urolithiasis,” Kidney International, Vol. 13, No. 5, 1978, pp. 344-360. doi:10.1038/ki.1978.53
- L. F. Lozanto, M. A. Pena-Rico, A. Heredia, J. OctolanFlores, R. Velazquez, I. A. Belio and L. Bucia, “Thermal Analysis Study of Human Bone,” Journal of Materials Science, Vol. 38, No. 23, pp. 4777-4782. doi:10.1023/A:1027483220584
- A. Kohutova, P. Honcova , V. Podzemna, P. Bezdicka, E. Vecernikova , M. Louda and J. Seidel, “Thermal Analysis of Kidney Stones and Their Characterization,” Journal of Thermal Analysis and Calorimetry, Vol. 101, No. 2, 2010, pp. 695-699. doi:10.1007/s10973-010-0914-6
- B. Strates and C. Georgacopoulou, “Derivatographic Thermal Analysis of Renal Tract Calculi,” Clinical Chemistry, Vol. 15, No. 4, 1969, pp. 307-311.
- R. Z. LeGeros, G. Bonel and R. Legros, “Types of H2O in Human Enamel and in Precipitated Apatites,” Calcified Tissue Research, Vol. 26, No. 1, 1978, pp. 111-118. doi:10.1007/BF02013245
NOTES
*Corresponding author