World Journal of Mechanics
Vol.08 No.06(2018), Article ID:85529,6 pages
10.4236/wjm.2018.86019
Drag Coefficients of Golf Balls
Peter E. Jenkins*, Joseph Arellano, Mark Ross, Matthew Snell
Mechanical Engineering Department, University of Colorado, Denver, USA

Copyright © 2018 by authors and Scientific Research Publishing Inc.
This work is licensed under the Creative Commons Attribution International License (CC BY 4.0).
http://creativecommons.org/licenses/by/4.0/


Received: May 14, 2018; Accepted: June 23, 2018; Published: June 26, 2018
ABSTRACT
Drag across a golf ball can affect distance traveled when hitting a ball. An average golf ball will have a drag coefficient of, 0.24 < CD < 0.7, in a Reynolds number range of 30,000 < ReD < 108,000. This paper investigates the effect of dimple patterns on the boundary layer around a ball. Changing the depth of the dimple will cause a change to the drag coefficient. A deeper dimple pattern will cause a larger drag coefficient at higher velocities, u > 35 m/s. This research found that a significantly deeper dimple pattern will greatly affect the boundary layer, thus changing the drag coefficient and boundary layer.
Keywords:
Drag Coefficient, Golf Balls, Flow Simulation

1. Introduction
Six golf balls were tested in a wind tunnel and Star CCM+ was used to simulate how the golf balls drag coefficients, CD, varied with Reynolds numbers, ReD, in relation to the flow around the balls. The six golf balls were chosen, each with different surface configurations, to determine the effect of surface finishing on the drag coefficient of the ball. Two of the golf balls were 3-D printed from models created using Fusion 360 and four golf balls were commercially manufactured. The six golf balls were tested to determine how the drag coefficient varied with Reynolds number and also, to determine the consistency of the relationship between experimental data and the numerical modeling. Testing in the wind tunnel began using smooth spheres to validate against published data to ensure that the data was accurate. Data from the CAD modeled golf balls that were run in the wind tunnel were compared to the results from Star CCM+ to verify that the numerical models were correlating to the experimental data. Reynolds numbers were computed using the diameter, D, as the characteristic size of the golf ball, and the testing produced results for Reynold numbers between 3.0 × 10⁴ and 1.6 × 10⁵ and 2.9 × 10⁴ to 2.3 × 10⁵ in the wind tunnel and Star CCM+, respectively.
2. Materials and Methods
A 3D printer was used to create the modeled golf balls; one with shallow dimples and one with deep dimples. A hole to accommodate a shaft to attach the balls to a drag-beam dynamometer was made using a drill press. The shafts used were 1/4 20-UNC shoulder bolts and modeling clay was used to secure the shaft to the balls. The University of Colorado at Denver’s wind tunnel was used in this experiment as shown in Figure 1.
Commercial golf balls were tested alongside the printed balls. This data was compared to analysis from Star +CCM for a smooth golf ball, the model for the shallow dimple golf ball, and the deep dimple golf ball. The experimental data was used to verify that the flow simulation in the numerical model was correlating correctly, making it possible to test, numerically, in conditions that couldn’t be created in the wind tunnel. Secondarily, the commercial balls did not have a solid model to run in the software, and the only source of data for these was from semiempirical testing in the wind tunnel.
The two 3-D printed models of the golf ball had diameters of 63.55 mm. The commercial golf balls that were tested had diameters of 42.7 mm. The printed golf balls had 1.5 times larger diameters to improve the resolution of the results. All the golf balls were tested in the wind tunnel in the laboratory where a drag-beam dynamometer was used to measure the drag force, FD, on each golf ball. The input frequency to the wind tunnel’s synchronous motor was varied from 20 Hz to 60 Hz. A pitot-static tube was used to determine the speed of the air flowing in the wind tunnel. The tube was connected to an inclined manometer that measured the air’s dynamic pressure, q. The speed, V, of the air in the wind tunnel was computed from the dynamic pressure using Equation (1).
(1)
ρ, was the density of the air in the wind tunnel and was computed using the ideal gas equation of state. The resulting speeds ranged from 13.4 m/s to 47 m/s. The Reynolds numbers and drag coefficients were computed using Equations (2) and (3), respectively [1] [2] .

Figure 1. Schematic of wind tunnel with test ball.
(2)
(3)
D was the diameter of the golf ball, ν was the viscosity of the air, and A was the frontal area of the golf ball. The vacuum in the wind tunnel was measured using a u-tube manometer, the ambient pressure was measured with a mercury barometer, and the ambient temperature was measured with a mercury thermometer [3] .
3. Results
The wind tunnel results for the commercial golf balls were consistent at higher Reynolds numbers, 8.0 × 10⁴ and had a drag coefficient range of CD = 0.275 ± 0.0225 [4] . Larger variations occur at lower Reynolds numbers, <5.0 × 10⁴, for the commercial golf balls. The drag coefficient of the commercial golf balls appeared to drop in the Reynolds number range of 60,000 < ReD < 70,000. The deep dimple 3-D printed ball had a slight increase in drag coefficient but had a drag consistent coefficient range of CD = 0.3605 ± 0.0385 for all Reynolds numbers tested in the wind tunnel. The shallow dimple 3-D printed golf ball had a consistent drag coefficient in the range of CD = 0.510 ± 0.028 in the Reynolds number range of 48,000 < ReD < 125,000 and had a decline between the Reynolds number range of 125,000 < ReD < 150,000. Figure 2 displays these results that were taken from wind tunnel data.
The 3-D printed golf ball models and a smooth sphere were analyzed in Star CCM+. The smooth sphere had a consistent drag coefficient in the range of CD = 0.525 ± 0.025 for the range of Reynolds numbers tested. The deep dimple golf ball had an increase in drag coefficient across the Reynold number range tested but was consistent in the range of CD = 0.389 ± 0.0425. The shallow dimple golf ball had a steady shallow decline in the drag coefficient in the Reynolds number range of 29,000 < ReD < 126,000, then a steep decline in drag coefficient in the

Figure 2. Drag coefficients for golf balls tested in the wind tunnel.
Reynolds number range of 126,000 < ReD < 145,000, finally ends with a shallow incline of drag coefficient for the larger Reynolds numbers tested. Figure 3 displays these results [4] .
The boundary layer for flow going at 80 m/s around the deep dimple ball is displayed in Figure 4.
The boundary layer flow going at 80 m/s around the smooth golf ball is shown in Figure 5. The flow at 80 m/s around a shallow dimple golf ball is shown in Figure 6.

Figure 3. Drag coefficients for golf balls tested in star CCM+.

Figure 4. Speed vectors around the deep dimple golf ball from Star CCM+.

Figure 5. Speed vectors around the smooth golf ball from Star CCM+.
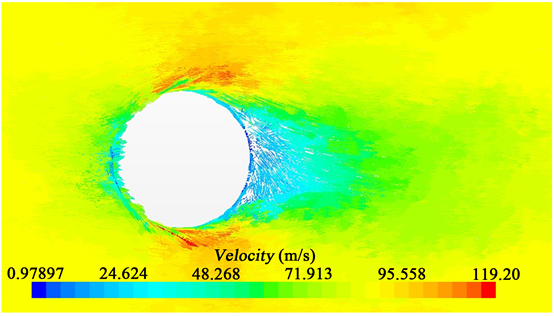
Figure 6. Larger speed vectors around the shallow dimple golf ball from star CCM+.
4. Discussion
If a dimple pattern was varied among different golf balls, how will it affect the drag coefficient of the golf ball? The data shows that commercial golf balls have a consistent drag coefficient at higher Reynolds numbers and have a large drop in a similar Reynolds number range. The deep dimple 3-D printed model golf ball showed a consistent pattern for both the wind tunnel and Star CCM+ data. The lack of a drop in the drag coefficient was due to it flowing in a lower Reynolds number range than those that were tested. The smooth sphere wasn’t tested at a high enough Reynolds number to see that drop in drag coefficient, that typically happens in the range of ReD = 40,000.
Using the data from both the wind tunnel and Star CCM+ gave multiple layers of analysis which strengthens the results. The limitations of this analysis are the resolution of the golf balls dimples not being as clear as for the larger diameter sphere in the wind tunnel.
However, it was determined that the depth of dimple does influence the drag coefficient on a golf ball. The deeper dimple has a lesser drag coefficient at lower Reynolds numbers, while the shallower dimple ball has a lower drag coefficient at the higher Reynolds numbers. Thus, the deeper dimple ball would be better for hitting a ball that will travel lower speeds, like a chip shot, where a shallower dimple ball will do better at shots that require higher speeds, such as driving when teeing off.
5. Conclusion
When comparing types of shots that require different velocities, the deeper dimple pattern will perform better with a lower drag coefficient at velocities, u < 35 m/s, and the shallow dimple pattern will perform better with a lower drag coefficient at higher velocities, u > 35 m/s.
Acknowledgements
The authors would like to thank the Mechanical Engineering Department at the University of Colorado Denver for the use of the Wind Tunnel for this research. Also, we would like to thank the CEAS IT department for their support in using the Star CCM+ software programs.
Cite this paper
Jenkins, P.E., Arellano, J., Ross, M. and Snell, M. (2018) Drag Coefficients of Golf Balls. World Journal of Mechanics, 8, 236-241. https://doi.org/10.4236/wjm.2018.86019
References