Atmospheric and Climate Sciences
Vol.3 No.4A(2013), Article ID:38838,8 pages DOI:10.4236/acs.2013.34A003
Greenhouse Gas Emissions from Intermittently Flooded (Dambo) Rice under Different Tillage Practices in Chiota Smallholder Farming Area of Zimbabwe
1Department of Environmental Science, Bindura University of Science Education, Bindura, Zimbabwe
2Department of Soil Science and Agricultural Engineering, University of Zimbabwe, Harare, Zimbabwe
3Department of Agroecology, Aarhus University, Tjele, Denmark
4USDA-Agricultural Research Service, Washington State University, Pullman, USA
Email: *gnyama@yahoo.com
Copyright © 2013 George Nyamadzawo et al. This is an open access article distributed under the Creative Commons Attribution License, which permits unrestricted use, distribution, and reproduction in any medium, provided the original work is properly cited.
Received September 19, 2013; revised October 10, 2013; accepted October 18, 2013
Keywords: Greenhouse Gases; Smallholder Farming Sector; Rice; Seasonal Wetland (Dambo)
ABSTRACT
Agriculture is one of the biggest sources of greenhouse gases. Rice production has been identified as one of the major sources of greenhouse gases, especially methane. However, data on the contributions of rice towards greenhouse gas emissions in tropical Africa are limited. In Zimbabwe, as in most of Sub-Saharan Africa, there are very few studies that have explored greenhouse gas emissions from agricultural lands. This study reports the first dataset on greenhouse gas emissions from intermittently flooded rice paddies in Zimbabwe. The objective of this study was to quantify greenhouse gas emissions from dambo rice under different tillage treatments, which were conventional tillage, no tillage, tied ridges, tied fallows, and mulching. Average soil nitrous oxide emissions were 5.9, 0.2, 5.4, 5.2 and 7.8 µg∙m−2∙hr−1 for tied fallows, conventional tillage, tied ridges, mulching and no tillage respectively. Average methane emission was 0.35 mg∙m−2∙hr−1 and maximum as 1.62 mg∙m−2∙hr−1. Average methane emissions for the different tillage systems were 0.20, 0.18, 0.45, 0.52 and 0.38 mg∙m−2∙hr−1 for tied fallows, conventional tillage, tied ridges, mulching and no tillage respectively. Carbon dioxide emissions were 98.1, 56.0, 69.9, 94.8 and 95.5 mg∙m−2∙hr−1 for tied fallows, conventional tillage, tied ridges, mulching and no tillage respectively. The estimated emissions per 150 day cropping season were 1.4, 3.6 and 0.6 kg∙ha−1 for methane, carbon dioxide and nitrous oxide respectively. We concluded that intermittently saturated dambo rice Paddys are a potential source of greenhouse gases which is important to global greenhouse gas budgets, thus, they deserve more careful study.
1. Introduction
Crop production is one of the biggest sources of greenhouse gases (GHGs). Globally, agriculture contributes approximately 58% to total anthropogenic emissions of nitrous oxide (N2O) [1]. The magnitude of these emissions depends on several factors including nitrogen (N) fertilization [2], tillage and crop residue management [3] and soil moisture [4,5]. In Zimbabwe, most cropping systems are rainfall based as irrigation systems are poorly developed [6]. In many semi-arid to arid areas of Zimbabwe, dryland crop production has been decreasing because of perennial mid-season droughts which have been attributed to climate change. As a climate change adaptation strategy, smallholder farmers in Zimbabwe and southern Africa have been cultivating seasonal wetlands (dambos) [7,8]. Therefore, presently, dambos are a valuable resource for crop production due to their widespread occurrence; saturation and inundation for months during rainy seasons; and high fertility when compared to uplands. Thus, in many developing countries, particularly in Africa, wetlands are now perceived as the “new frontier” for agriculture [9]. The use of seasonal dambos for crop production is potentially associated with increased emission of GHGs such as nitrous oxide (N2O), carbon dioxide (CO2) and methane (CH4). Nonetheless, the impact of dambo cultivation on GHG emissions is yet to be evaluated.
The production of rice, which is one of the major crops grown in dambos, has been associated with elevated GHG emissions, particularly CH4 [2,10,11]. Specifically, soil disturbance during dambo cultivation and application of fertilisers that influence microbial processes, soil organic carbon (SOC) storage and turnover also affect GHG emissions from wetlands. Conservation tillage practices potentially reduce SOC degradation [12,13]. However, to date there are no studies that have evaluated the use of conservation tillage practices on SOC storage and GHG emissions from dambos in Zimbabwe.
In Zimbabwe, as in most of Sub-Saharan Africa, there are very few studies that have explored GHG emissions from cropped agricultural lands particularly dambos. There are a few reported studies the central and southern Africa regions e.g. Taylor et al. [14] The contributions of dambos of central and southern Africa to global CH4, carbon dioxide (CO2) and N2O missions are mainly estimates as there have been very few measurements and there is a risk that a very important source of GHGs is being overlooked. This has been the case because of several reasons, among them; high research costs, limited funding, limitation of analytical infrastructure and trained personnel. The objective of the study was to quantify GHG emissions from seasonal wetland (dambo) rice under different tillage systems, using static chambers.
2. Materials and Methods
2.1. Study Site
Chiota is a smallholder farming area with average landholding size of 5 hectares and is located 70 km south of Harare (31˚05'S; 18˚11'E), with average rainfall of 700 - 800 mm and mean annual temperature of 18.6˚C. Soil at Chiota is a sandy loam, classified as Haplic lixisol, [15].
Seasonal wetlands, locally known as dambos, constitute 30% of the land area of Chiota (19,500 ha) and are used intensively for crop cultivation. A summary of the soil properties from the study site are shown in Table 1.
2.2. Experimental Design
At Chiota in Zimbabwe, greenhouse gas (GHG) (CH4,

Table 1. Selected soil properties at the Chiota study site.
CO2 and N2O) emissions were measured from rice (Oryza sativa L.). The study at Chiota was conducted on-farm and was aimed at evaluating the effect of different tillage practices on GHG emissions in seasonal wetland (dambo) rice (Oryza sativa L.), during the 2010/2011 cropping season. Dambo rice was planted on 28 December 2010 and grown on residual moisture during the dry season and was only partially flooded, when the watertable rose to the surface during the rainy season. The rice germinated between 10 and 15 January 2011 and GHG emission measurements were carried out at 2 week interval from 5 March to April 30 2011. The five tillage treatments tested were conventional tillage (CT) with ploughing to 20 cm depth using an ox-drawn plough, no tillage (NT), tied-ridges (TR), tied-fallows (TF), and mulching (Mulch). The NT treatment involved manually opening planting stations using a hand-hoe with minimum soil disturbances.
Tied-ridging involved ploughing to 20 cm using an oxdrawn plough after which semi-permanent ridges (about 25 cm in height) were laid in the field at a grade of 0.4% - 1% across the slope at a interval of 50 cm. Cross-ties were constructed at 1 m intervals and were about twothirds the height of the ridge. In tied-ridges, planting was done on top of the ridge. Tied-fallows are similar to tied-ridges except that, in the latter, planting was done in the furrows or in the flanks of 0.5 m wide rows. Mulching involved covering the soil surface with plant stover and litter (Table 2) after tillage. The plot sizes were 3 m × 1 m. Basal fertilsers, compound D (7, 14, 7 for N, P2O5, K respectively) was applied at planting at rates of 300 kg∙ha−1. Ammonium nitrate (AN) with 35% N, was used as a top dressing applied at a rate of 120 kg∙N∙ha−1 six weeks after germination (Table 1).
2.3. GHG Emission Measurements
GHG flux measurements were taken from rice plots using opaque static polythene chambers with a base area of 0.40 m × 0.28 m and height of 0.5 m [4,16,17]. Each chamber had an air tight septum at the top through which samples were collected. Samples were collected with polypropylene syringe at time 0, 30 and 60 minute intervals. One chamber was randomly deployed in each rice plot and some rice was placed inside the chamber. To reduce gas leakages from the chamber, the chamber edges fastened using a small chisel and covered with surrounding soil, taking precaution not to disturb the chamber. Samples were collected from rice plots, starting at 7 am in the morning and completed by mid-morning. Samples were collected five times during the growing season, starting at week 6 after germination germination on the 3rd, 18th, 31st March, 16th April and 30 April 2011.

Table 2. Tillage treatments in rice plots at the Chiota site, Zimbabwe.
2.4. Sample Analysis
Samples were analysed for GHGs using gas chromatography (GC) (Shimadzu GC 2014 model) at Washington State University, USDA Research Laboratory, USA. The GC was equipped with an electron capture detector (ECD) for N2O, a Thermal Conductivity Detector for CO2 and a flame ionizing detect (FID) for CH4. The shipment process was assumed to result in negligible changes in the GHG concentration of the samples, as standards that were shipped to and from the USA in an earlier study remained unchanged [18].
2.5. Flux Calculations
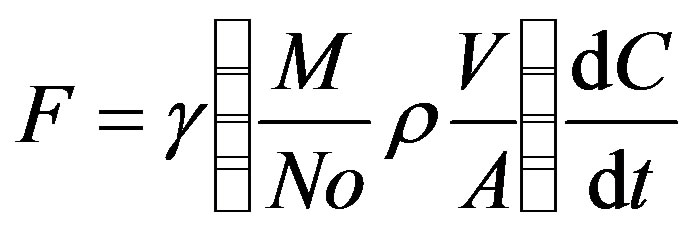
Fluxes for GHGs’ were calculated as described by Khalil et al. [16] as shown in Equation (1).
 (1)
(1)
Where F = is the measured fluxes, C is the measured concentration in the chamber and dC/dt is the rate of accumulation in ppbv/min. A is the area from which methane is emitted into the chamber (m2), V is the volume of the chamber (m3), No is Avogadros number, ρ is the density of air (molecule m−3), γ is a unit conversion factor equal to 6.0 × 10⁻⁵, mg∙min−1∙g∙hr−1∙ppbv−1, and M is the molecular weight of the greenhouse gas. Data was validated using a test of linearity of the accumulation of gases at different time as described in Khalil et al. [19].
2.6. Data Analysis
Data was analyzed for variance (ANOVA) of CH4, CO2 and N2O fluxes using the Genstat Statistical package. The least significant differences (LSD) were used to separate means that were significantly different.
3. Results
At the study site in Chiota, the SOC content was 33.4 g∙kg−1 for the 0 - 20 cm depth and this can be considered to be high compared to most cropping lands in tropical Zimbabwe where the average SOC is ~1% [15]. The average soil pH was 5.4 and bulk density of 1.4 g∙cm−3 (Table 1). The total N content was 1.91 g∙kg−1 and the C:N ratio for this site was 11.5.
3.1. N2O Emissions
Soil N2O emissions from rice plots, which had N applied at 126 kg∙N∙ha−1, were not significantly different among treatments (Table 3). The mean N2O emission across all treatments was 4.9 µg∙m−2∙hr−1 (132 µg∙m−2∙day−1). N2O emissions for the different treatments were 5.9, 0.2, 5.4, 5.2 and 7.8 µg∙m−2∙hr−1 for TF, CT, TR, mulching and NT respectively. N2O emissions varied with time of sampling and averages across treatments for week 6, 8, 10, 12 and 14 after germination. N2O emission increased from first sampling (6 weeks after germination) to the last sampling (14 weeks after germinations) and were −6.4, −0.3, −0.9, 11.5 and 20.7 µg∙m−2∙hr−1 for week 6, 8, 10, 12 and 14 after germination respectively, (Figure 1). Total seasonal N2O emission per crop (150 days) was also estimated and the average was 0.12 kg∙N2O∙ha−1 per cropping season (Table 3). In this study, there was no yield data for rice as the crop was destroyed by rodents before harvest. We therefore used national average rice yields (0.87 t∙ha−1) to estimated yield scale emissions. The average yield scale emission was 0.26 g∙N2O∙kg−1 yield (Table 3).
3.2. CH4 Emissions
Methane emission from rice did not show any significant differences among tillage treatments. The average CH4 emission for all treatments was 0.35 mg∙m−2∙hr−1 (8.4 mg∙m−2∙day−1) and maximum fluxes were 1.62 mg∙m−2∙hr−1 (38.9 mg∙m−2∙day−1). Average CH4 fluxes for the different tillage systems were 0.20, 0.18, 0.45, 0.52 and 0.38 mg∙m−2∙hr−1 for TF, CT, TR, mulching and NT respectively. CH4 emissions varied significantly with sampling time and emissions decreased from the first sampling (6 weeks after germination) to the last sampling (14 weeks after germinations) (Figure 2). Emissions were 0.54,
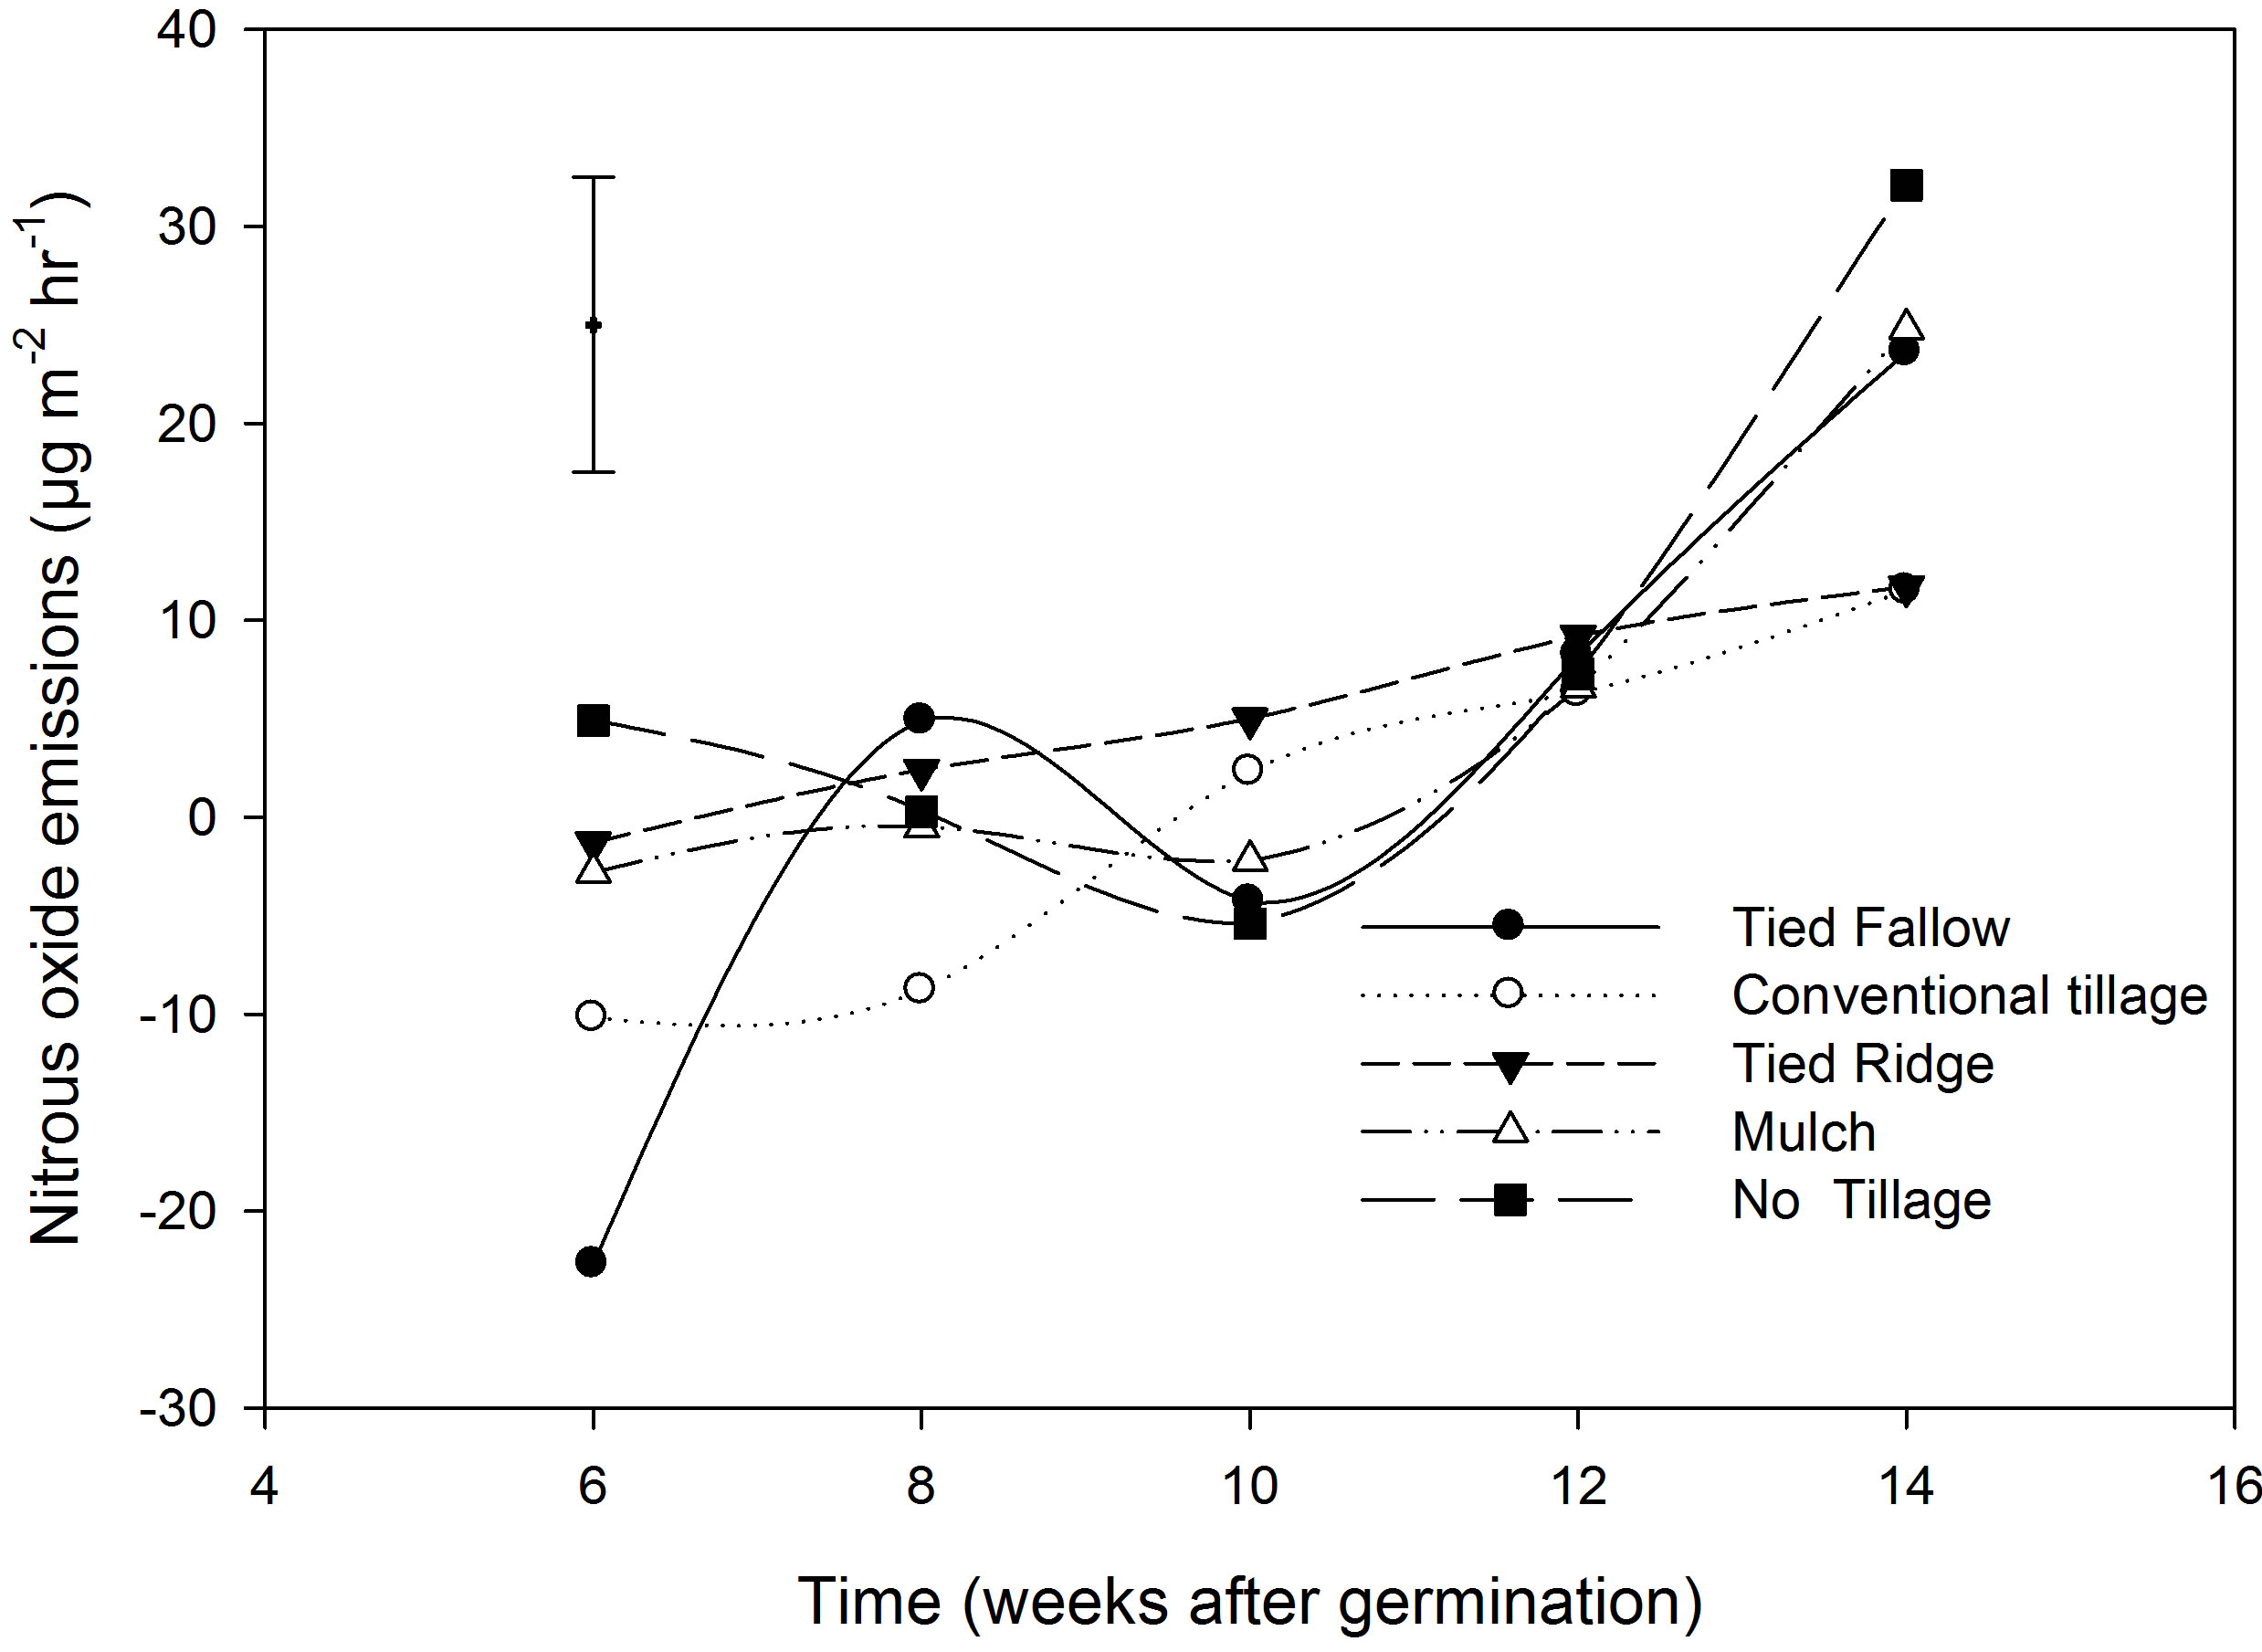
Figure 1. N2O emissions in the different tillage practices from week 6 - 14 after germination. Vertical bar is the least significant difference (LSD). LSD = 14.98.
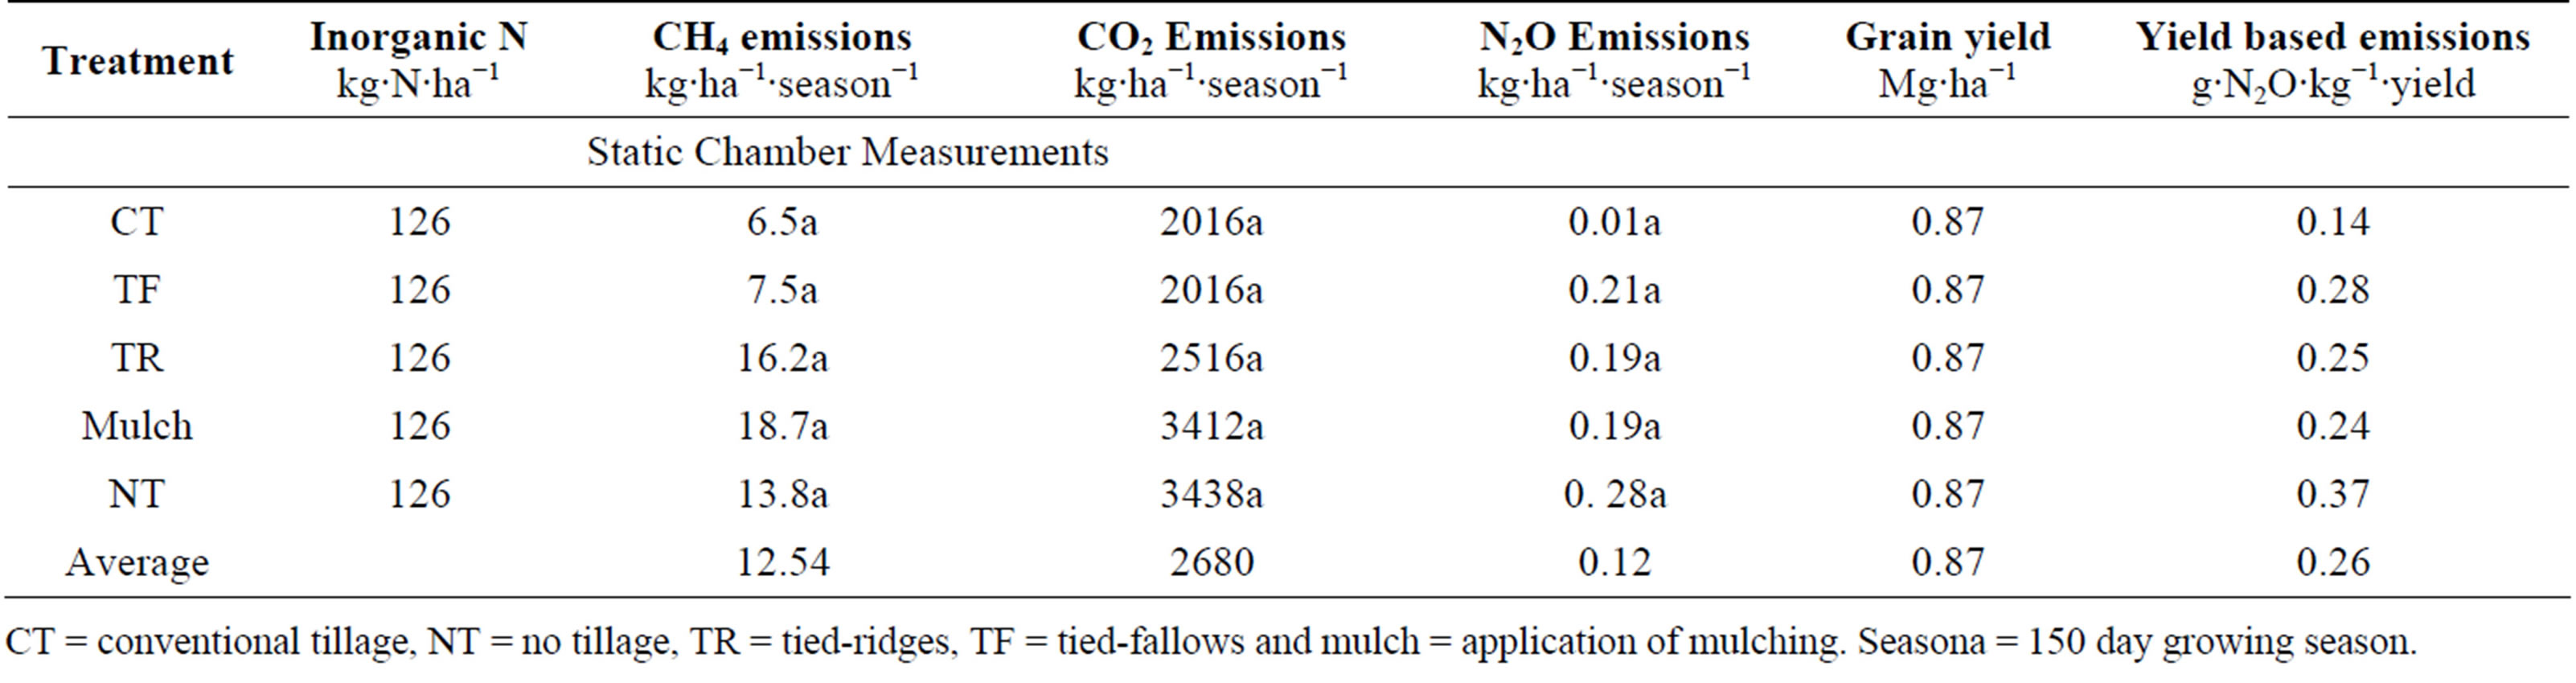
Table 3. Seasonal CH4, CO2 and N2O emissions and yields based N losses.
CT = conventional tillage, NT = no tillage, TR = tied-ridges, TF = tied-fallows and mulch = application of mulching. Seasona = 150 day growing season.
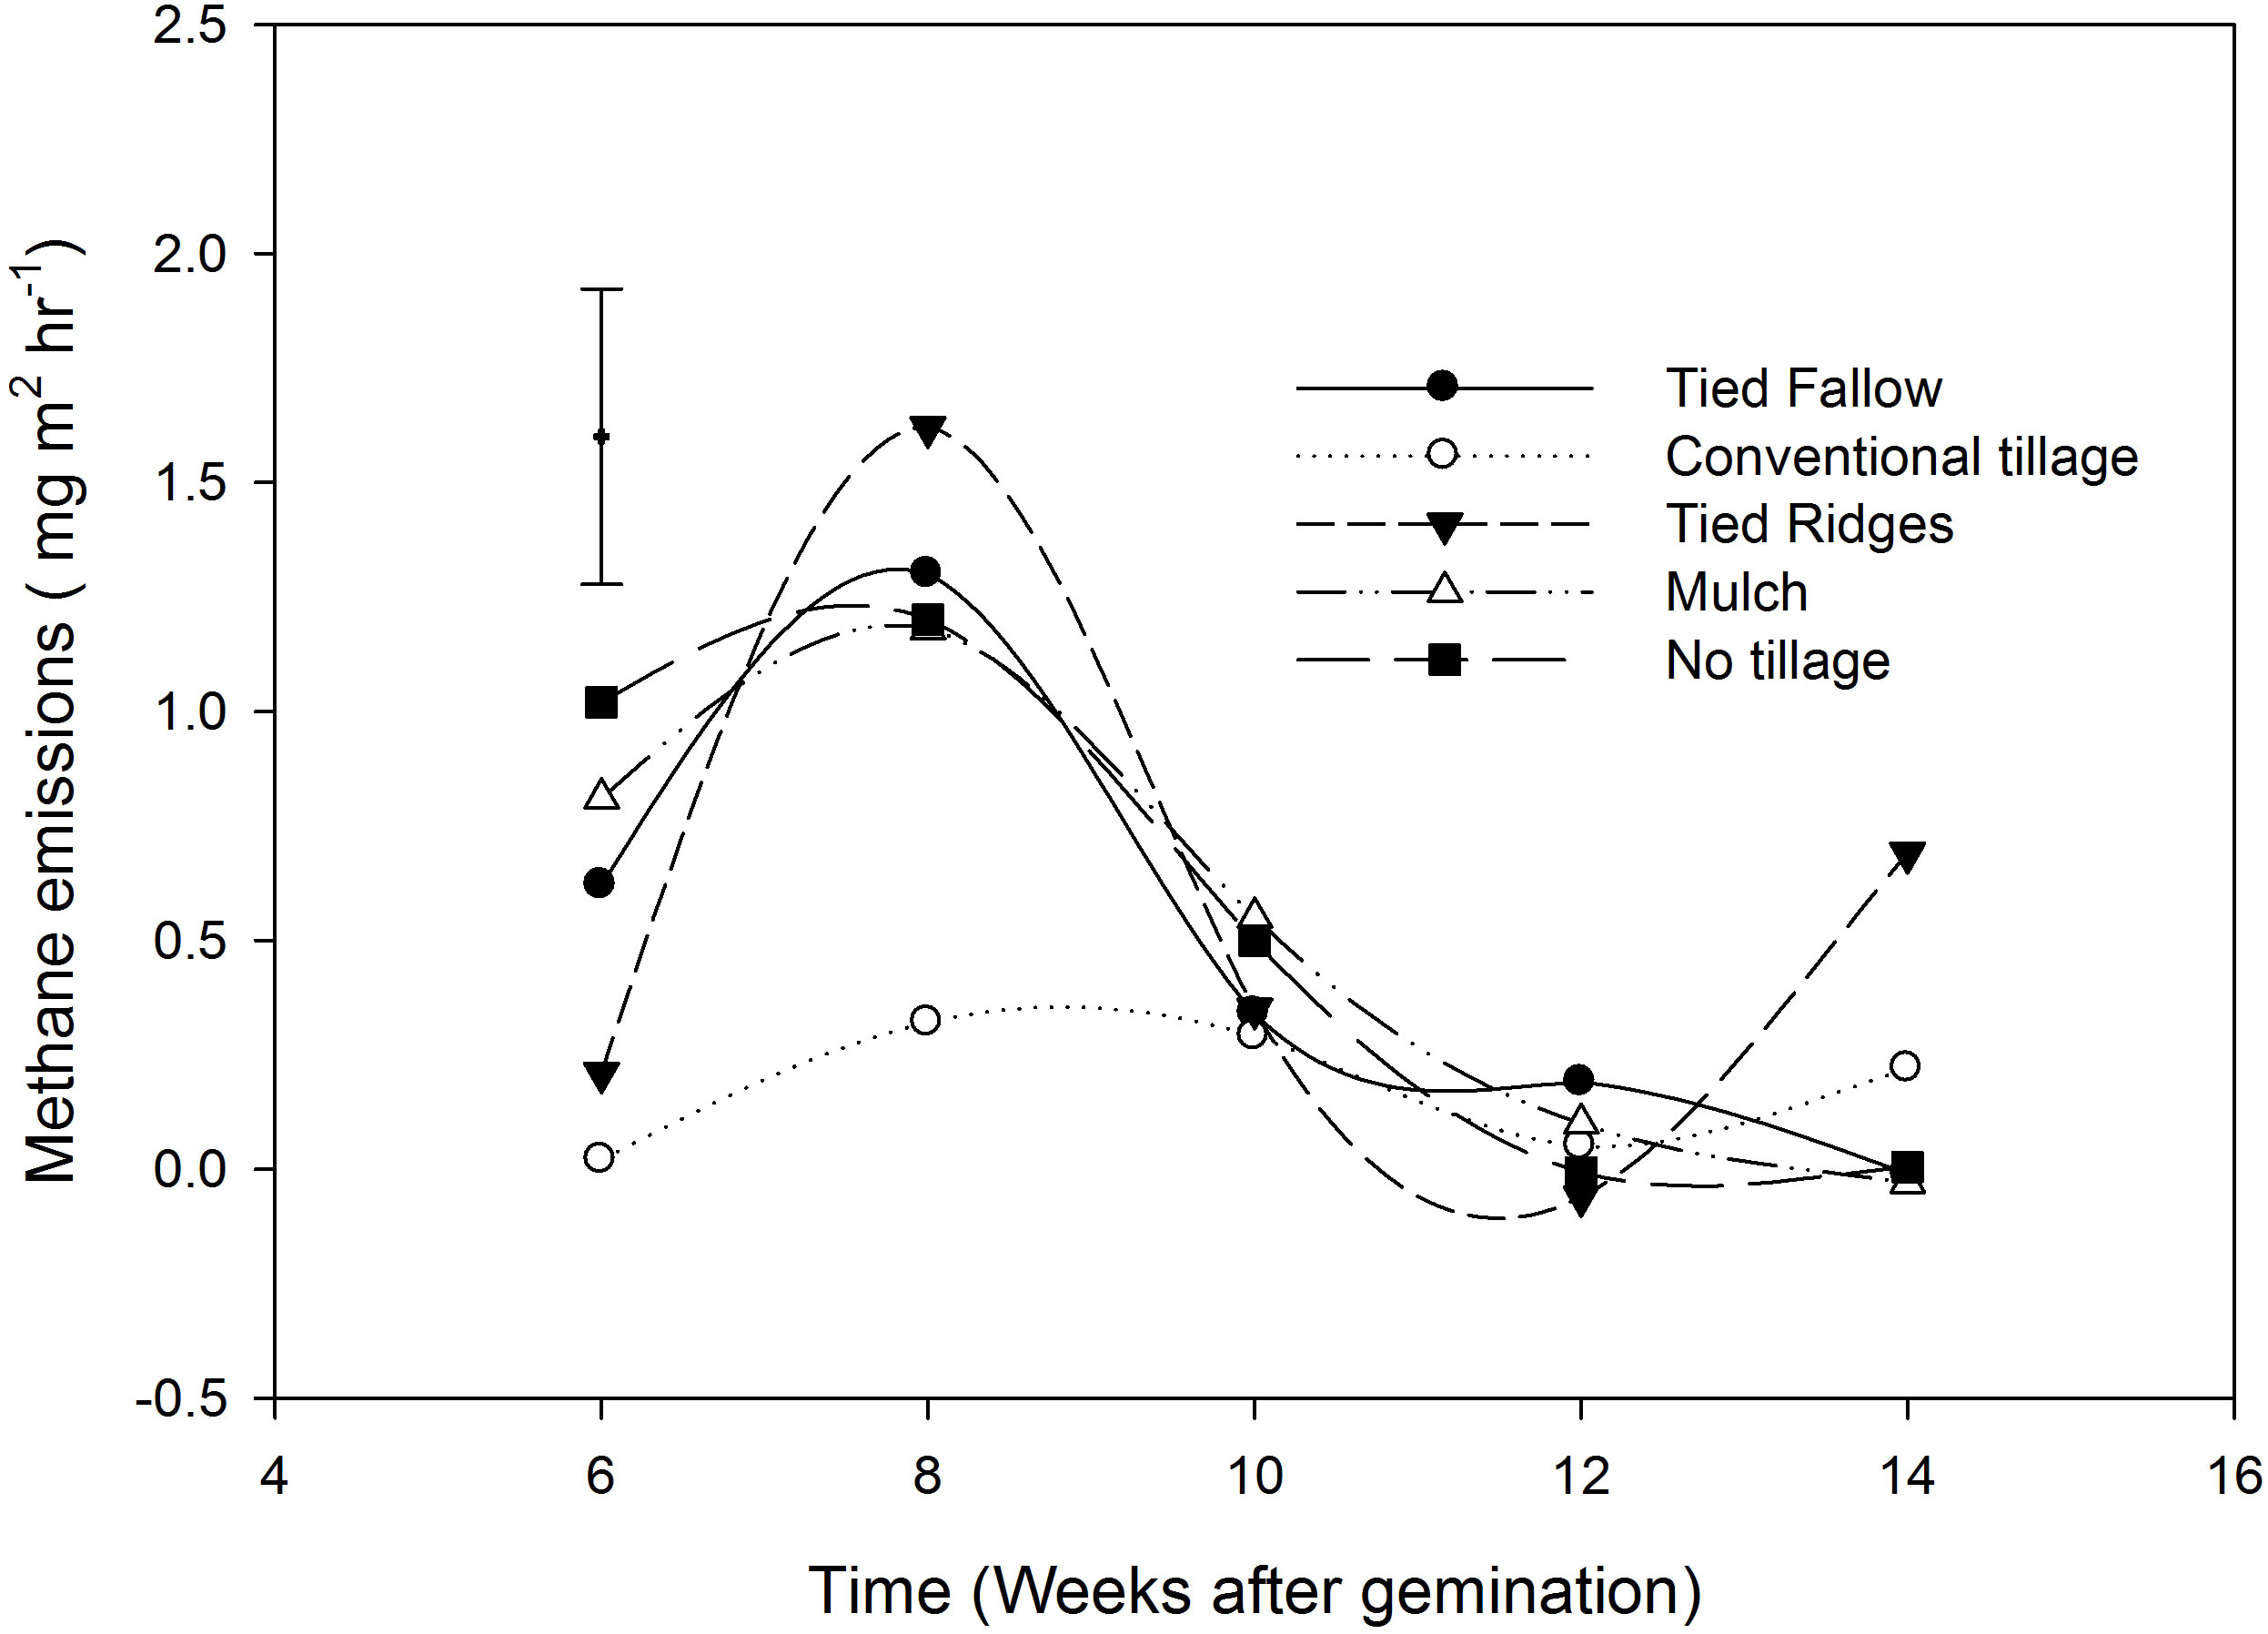
Figure 2. CH4 emissions in the different tillage practices from week 6 - 14 after germination. Vertical bar is the least significant difference (LSD). LSD = 0.646.
0.53, 0.55, −0.07 and 0.18 mg∙m−2∙hr−1 for week 6, 8, 10, 12 and 14 after germination respectively. Estimated total emissions for the growing season are shown in Table 3, and the average CH4 emission for all treatments from intermittently flooded dambo rice over 150 day growing season was 12.5 kg∙ha−1.
3.3. CO2 Emissions
Carbon dioxide did not show any significant differences between treatments. The mean CO2 emission was 82.9 mg∙m−2∙hr−1 (1990 mg∙m−2∙day−1). CO2 emission increased as it became drier, when saturation conditions decreased. There was net CO2 consumption (−4.0 mg∙m−2∙hr−1) during week 6, while emissions were 10.1, 33.4, 86.0 and 188.7 mg∙m−2∙hr−1 for week 8, 10, 12 and 14 after germination respectively. CO2 emissions increased as the soil moisture content in the dambo decreased, as the soil became less saturated (Figure 3). Treatment averages were 98.1, 56.0, 69.9, 94.8 and 95.5 mg∙m−2∙hr−1 for TF, CT, TR, mulching and NT respectively. The estimated seasonal losses in CO2 over a 150 day growing season translated to 2680 kg∙ha−1 (Table 3).
There was a weak correlation between soil moisture and GHG emissions (R2 = 0.12 - 0.21). The soil moisture was high throughout the period of measurement, >30% and moisture was not the limiting factor. Soil temperature was also poorly correlated to GHG emissions as the soil temperatures did not vary significantly among treatments.
4. Discussion
The manipulation of dambos through cultivation, application of fertilisers and growing of crops can affect GHG emissions from dambos. Cultivating crops in dambos can potentially increase greenhouse gas emissions from dambos through the oxidation of large pools of soil organic matter stored in dambos that are exposed, and this increases CO2 and N2O emissions. In addition, the application of fertilizers may increase the production of GHGs especially N2O, and plants e.g., rice are important in transporting CH4 from the soil into the atmosphere [11, 20].
Agricultural soils are amended with organic and inorganic N fertilizers are generally sources of N2O. In most tropical soils, particularly in Zimbabwe’s smallholder farming areas, the soils are N deficient and this limits N2O emission. In dambos, were there are high SOC contents, the addition of N based inorganic fertilizers, increases N2O emissions. However, N2O emissions are limited by the anoxic and saturated condition during the wet season. In addition, N2O emissions are constrained by low N availability in the soil as low N inputs (~120 kg∙N∙ha−1) were used and some of the N may be immobilised, making soils weak sources of N2O [21,22]. In countries such as China, N application rates of up to 1000 kg∙N∙ha−1 are used and this makes the soils major sources of N2O [23]. The soil N2O emissions recorded at Chiota site were generally low and consistent with other studies conducted on arable African soils, which are generally below 2.0 kg∙N2O-N∙ha−1 [24,25].
N2O emissions were lower during the first 3 weeks because of saturated conditions which reduced N2O formation. Increase in N2O emissions were observed in week 10 and 12, when rainfall decreased and the dambo became less saturated (Figure 1). In dambos N2O fluxes varied with changes in saturation and fluxes are least when the dambos soils are saturated and increase when
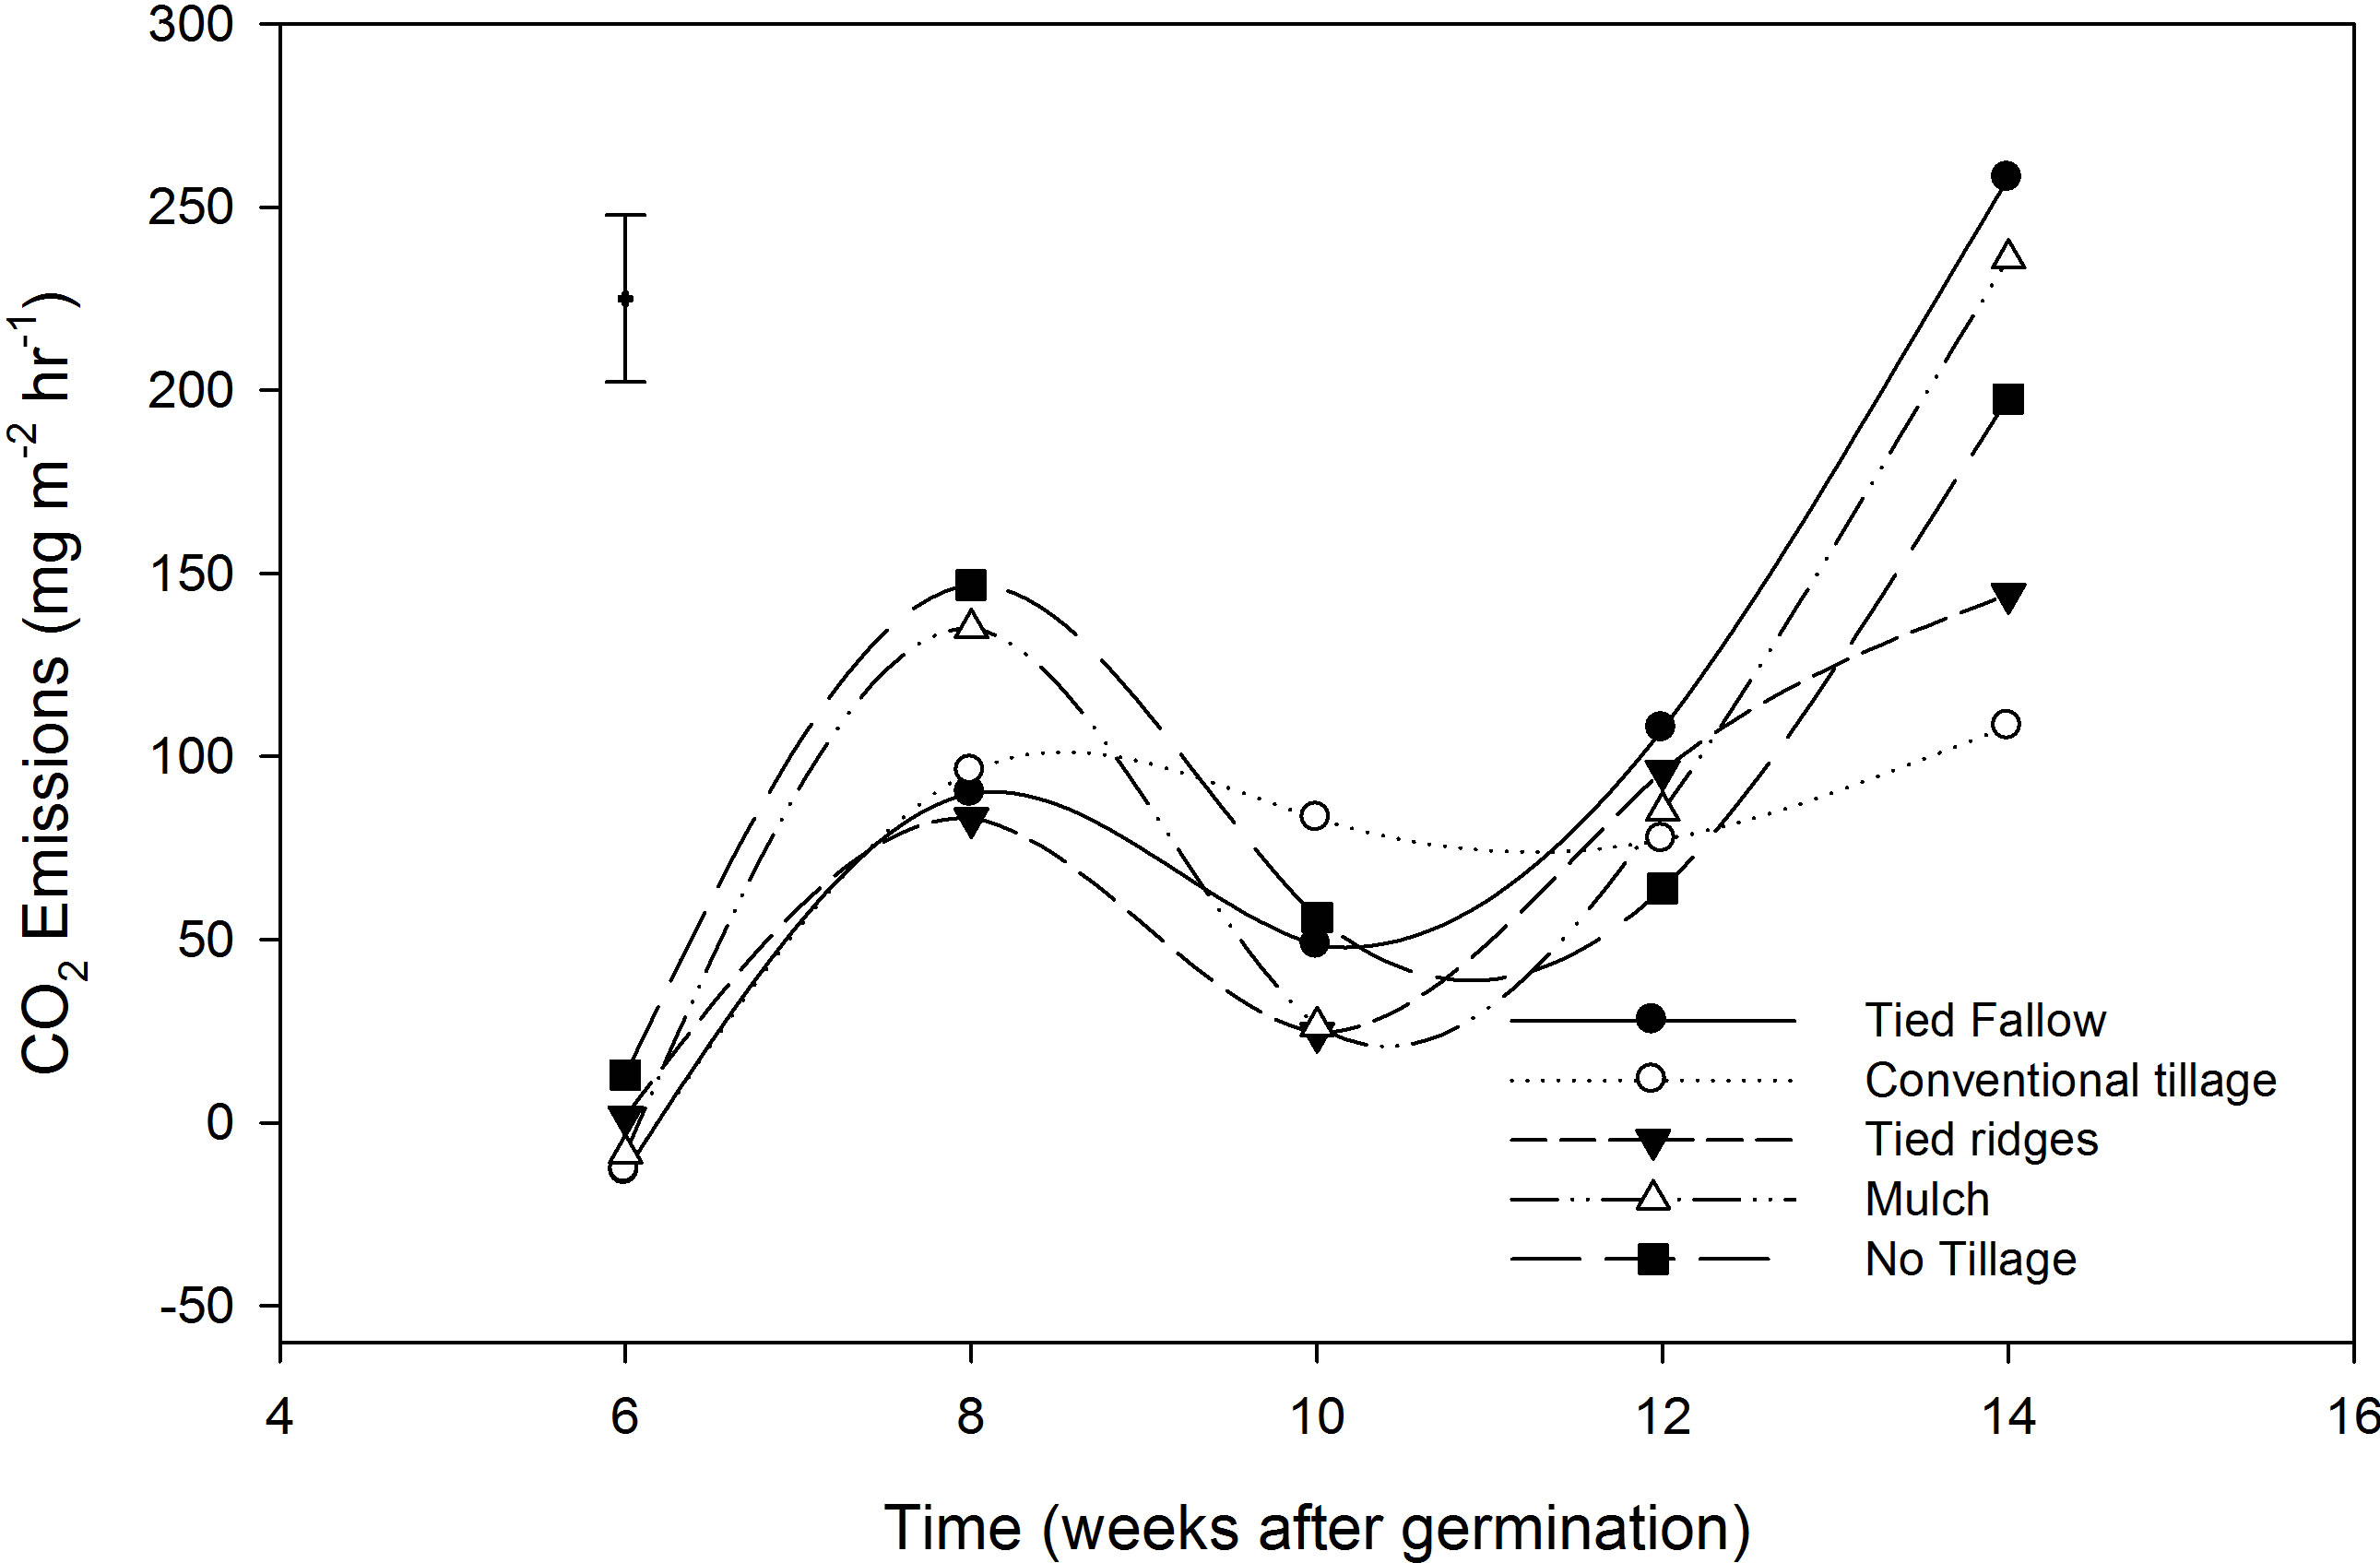
Figure 3. CO2 emissions in the different tillage practices from week 6 - 14 after germination. Vertical bar is the least significant difference (LSD). LSD = 44.15.
saturation decreased. Nitrous oxide is an intermediate product of microbial processes such as nitrification and denitrification [26] and the microbial process are controlled by soil moisture and or saturation. This suggests that the concentrations of N2O that are emitted from dambos vary depending on the soil conditions e.g., soil moisture is a major controlling factor of soil microbial processes [4,5].
There were no significant differences in N2O emission among treatments and this was probably because the tillage treatments were only one year old. Although, conservation tillage practices have been reported to maintain soil moisture even during dry spells compared to CT [12,13], in this study the effects were not apparent. N2O emission studies from intermittently flooded rice from India, [27] reported mean fluxes of 30 µg∙m−2∙hr−1 and these values are by far greater than our average (4.9 µg∙m−2∙hr−1). However, our average was comparable to emission reported by Rees et al. [4] of 6.2 µg∙m−2∙hr−1 in saturated bottom catena positions in Zimbabwe. Dambo cultivation and planting of rice resulted in increased N2O emissions (4.9 ug∙m−2∙hr−1), than emission from natural dambos (−6.5 - 0.02 ug∙m−2∙hr−1). Though the increase was small, low concentration of N2O may have a big impact as N2O has a GWP of 298 times than CO2 over 100 year period [28].
CH4 emissions were higher during the week 6 and 8 and this could be attributed to increased rainfall and saturated conditions which were conducive to methanogenesis. As the water table receded, from week 10 - 14, the amount of CH4 emitted decreased. As CH4 diffuses through the oxidised layer to the soil surface some of it is oxidized to CO2 [11]. Methanotrophy can oxidise between 40% - 90% of CH4 produced [29]. Earlier studies by Khalil et al. [10] reported that draining fields of lack of water may result in ceasation of CH4 fluxes. As dambos became drier, methanogenesis could have been occurring deeper in the soil, however increased oxidation of CH4 as it moves to the soil surface may reduce the amount of CH4 that reached the surface. In dambos beds are usually raised to put the crop and the wetting and drying cycles creates aerobic surface layers. Castaldi and Fierro [30] reported that CH4 consumption increased when water filled pore space (WFPS) decreased from 20% - 3%, while Otter And Scholes [20] reported CH4 consumption in African savanna at WFPS between 20% and 5%, with a peak at 5%.
Our results suggest that intermittently flooded rice grown in sandy dambos was a weak source of CH4. CH4 emissions from this study were lower than the only other reported rice CH4 emission data of 14.7 mg∙m−2∙hr−1 (355 mg∙m−2∙day−1) were reported under flooded conditions in Kenya [14]. The results were also lower than CH4 emission from undisturbed dambos that have been reported from earlier studies e.g., Scholes and Andrae [31] who reported emission of 9 mg∙m−2∙hr−1. Our results, mean (0.35) and 1.6 mg∙m−2∙hr−1 (maximum), were in the same range with emissions of 0.45 mg∙m−2∙hr−1 from cultivated dambo under rape (Brasisca napus) at the same site [7]. Our results are also within range of emissions reported by Brown et al. [18], of 1.23 mg∙CH4∙m−2∙hr−1 (mean) to 9.58 mg∙CH4∙m−2∙hr−1 (maximum) from undisturbed dambos in Uganda and they also fall within range of reported fluxes from Ohio, by Altor and Mistch [32] who reported emission ranging from −0.2 - 6 mg∙m−2∙hr−1 in periodically saturated reparian marshes. The results are also comparable to fluxes that have been reported from other tropical regions e.g., Marani and Alvala [33] who reported diffusive fluxes 6 and 28 mg∙m−2∙day−1 from Brazilian flood plains.
Dambos can also be a source of CO2 which is formed as a by-product of cell respiration, oxidation of carbon stored in the dambos, methanogenic fermentation, acetate fermentation, or the oxidation of CH4 as it diffuses through the aerobic zones. Carbon dioxide concentration in rice plots was lower when dambos were saturated because of reduced soil respiration. Similar observation showing low CO2 concentrations from rice paddies were also reported by [14], who suggested that when samples are collected during day time, both respiration and photosynthesis are taking place. As plants phosynthesise, they will use up CO2 originally under the chamber, after which they will begin to use up respired CO2 for photosynthesis. The overall result is that the chamber will become depleted in CO2 [14]. However, the increase in CO2 emissions in week 8, a period when there we had the highest CH4 emission probably suggest that, the source of CO2 was CH4 oxidation as it moved to the soil surface. The general qualitative relationship between N2O and CH4 is that when fields are saturated CH4 increases, CO2 and N2O decreases. However, when fields become drier, CH4 emissions decreased and CO2 and N2O emissions increased. This pattern is also seen in our data (Figures 1-3).
The poor correlation between soil moisture and GHG emissions (R2 = 0.12 - 0.21) could be due to the fact that the study was conducted in summer (rain season) when dambos have high soil moisture to saturated conditions and also the fact that our dataset was small. The high soil moisture throughout the measurement period suggests that moisture was not the limiting factor. In tropical dambos which are saturated, substrate availability e.g., N source is rather more limiting than soil moisture. Soil temperature was also poorly correlated to GHG emissions as the soil temperatures did not vary significantly among treatments. Our temperatures ranged from 24˚C - 27˚C in the dambos. Though temperatures are important, they are likely not to be dominant in tropical environments [19].
Yield Scale N2O Emissions
Our national average rice yields are lower compared to other regions e.g. China were yields for low land rain-fed rice can be 3.0 t∙ha−1 [34]. There is a huge yield gap which needs to be closed in the smallholder farming sector of Zimbabwe. Our yield-scaled N2O emissions are higher than those reported from other studies e.g., Shi et al. [35], highlighting a need to improve N fertiliser use efficiency for smallholder farmers in Zimbabwe. To improve sustainability, there is need to minimize yieldscaled N2O emissions rather than only focusing on absolute N2O emissions [36].
5. General Overview and Conclusions
We concluded that intermittently saturated dambo rice paddys are a potential source of GHGs. When saturated, dambos are important sources of CH4. However, when saturated condition decreases, CH4 emission decreases, and N2O and CO2 emissions increase. The CH4 emissions from cultivated dambos were lower than that from natural dambos. Yield scale N2O emissions were higher and this suggests that there is a need to improve N fertiliser use efficiency for smallholder farmers to reduce yield based N2O emission losses. Uncertanities in GHG emissions from dambo rice from the region are very large because there are few measurements that have been done. Although the sampling was not intense to obtain robust data on GHG emission from dambo rice fields, the results are still comparable to earlier studies and GHG emissions from other regions. This shows that GHG emissions from dambo rice are important to global GHG budgets and they deserve more studies. Because GHG emissions occur in pulses, for future studies we recommend high sampling frequencies. By not including emissions from seasonal wetlands such as dambos, there is a risk that a very important source of GHGs is being overlooked.
6. Acknowledgements
We are grateful to the Climate Food and Farming (CLIFF) network under the Research program on Climate change Agriculture and Food Security (CCAFS) for funding this study.
REFERENCES
- P. Smith, D. Martino, Z. Cai, D. Gwary, H. Janzen, P. Kumar, B. McCarl, S. Ogle, F. O’Mara, C. Rice, B. Scholes and O. Sirotenko, “Agriculture,” In: B. Metz, O. R. Davidson, P. R. Bosch, R. Dave and L. A. Meyer, Eds., Climate Change 2007: Mitigation. Contribution of Working Group III to the Fourth Assessment Report of the Intergovernmental Panel on Climate Change. United Kingdom and New York, NY, USA, Cambridge University Press, Cambridge, 2007.
- A. R. Mosier, C. Kroeze, C. Nevison, O. Oenema, S. Seitzinger and O. van Cleemput, “Closing the Global N2O Budget: Nitrous Oxide Emissions through the Agricultural Nitrogen Cycle. OECD/IPCC/IEA Phase II Development of IPCC Guidelines for National Greenhouse Gas Inventory Methodology,” Nutrient Cycling in Agroecosystems, Vol. 52, No. 2-3, 1998, pp. 225-248. http://dx.doi.org/10.1023/A:1009740530221
- J. K. Mutegi, L. J. Munkholm, B. M. Petersen, E. M. Hansen and S. O. Petersen, “Nitrous Oxide Emissions and Controls as Influenced by Tillage and Crop Residue Management Strategy,” Soil Biology and Biochemistry, Vol. 42, No. 10, 2010, pp. 1701-1711. http://dx.doi.org/10.1016/j.soilbio.2010.06.004
- R. M. Rees, M. Wuta, P. A. Furley and C. S. Li, “Nitrous Oxide Fluxes from Savanna (Miombo) Woodlands in Zimbabwe,” Journal of Biogeography, Vol. 33, No. 3, 2006, pp. 424-437. http://dx.doi.org/10.1111/j.1365-2699.2005.01423.x
- F. Takakai, T. Morishita, Y. Hashidoko, U. Darung, K. Kuramochi, S. Dohong, S. H. Limin and R. Hatano, “Effects of Agricultural Land-Use Change and Forest Fire on N2O Emission from Tropical Peatlands, Central Kalimantan, Indonesia,” Soil Science and Plant Nutrition, Vol. 52, No. 5, 2006, pp. 662-674. http://dx.doi.org/10.1111/j.1747-0765.2006.00084.x
- P. Camberlin, V. Moron, R. Okoola, N. Philippon and W. Gitau, “Components of Rainy Seasons’ Variability in Equatorial East Africa: Onset, Cessation, Rainfall Frequency and Intensity,” Theoretical and Applied Climatology, Vol. 98, No. 3-4, 2009, pp. 237-249. http://dx.doi.org/10.1007/s00704-009-0113-1
- G. Nyamadzawo, M. Wuta, J. Nyamangara, J. L. Smith and R. M. Rees, “Integrated Nutrient Management Practices in Dambo Gardens and Their Effects on GHG Emissions,” Working Paper, 2013.
- E. Kuntashula, G. Sileshi, P. L. Mafongoya and J. Banda, “Farmer Participatory Evaluation of the Potential for Organic Vegetable Production in the Wetlands of Zambia,” Outlook on Agriculture, Vol. 35, No. 4, 2006, pp. 299- 305. http://dx.doi.org/10.5367/000000006779398290
- A. Woods, “Valuing Wetlands for Livelihoods as the Basis for Sustainable Management: The SAB Approach,” Striking a Balance, Policy Briefing Note 1. UK, Wetland Action and the Centre for Wetlands, Environment and Livelihoods at the University of Huddersfield, 2009.
- M. A. K. Khalil, M. J. Shearer, R. A. Rasmussen, C. Duan and R. Lexin, “Production, Oxidation, and Emissions of Methane from Rice Fields in China,” Geophysical Research, Vol. 113, No. G3, 2008, in press. http://dx.doi.org/10.1029/2007JG000461
- J. Le Mer and P. Roger, “Production, Oxidation, Emission and Consumption of Methane by Soils: A Review,” European Journal of Soil Biology, Vol. 37, No. 1, 2001, pp. 25-50. http://dx.doi.org/10.1016/S1164-5563(01)01067-6
- C. Thierfelder and P. C. Wall, “Effects of Conservation Agriculture Techniques on Infiltration and Soil Water Content in Zambia and Zimbabwe,” Soil Tillage Research, Vol. 105, No. 2, 2009, pp. 217-227. http://dx.doi.org/10.1016/j.still.2009.07.007
- G. Branca, N. McCarthy, L. Lipper and M. C. Jolejole, “Identifying Opportunities for Climate-Smart Agriculture Investments in Africa,” FAO, Rome, 2011.
- S. C. Taylor, P. R. Zimmerman, C. Cumberbatch, J. P. Greenberg, C. Westberg and J. P. E. Darlington, “Measurements and Interpretation of δ13C of Methane from Termites, Rice Paddies and Wetlands from Kenya,” Global Biogeochemical Cycles, Vol. 2, No. 4, 1988, pp. 341- 355. http://dx.doi.org/10.1029/GB002i004p00341
- FAO, “World Reference Base for Soil Resources: A Framework for International Classification, Correlation and Communication,” World Soil Resources Report 103, Rome, 2006, p. 128.
- M. A. K. Khalil and R. A. Rasmussen, “Flux Measurements and Sampling Strategies: Applications to Methane Emissions from Rice Fields,” Journal of Geophysical Research, Vol. 103, No. D19, 1998, pp. 25211-25218. http://dx.doi.org/10.1029/98JD00690
- F. Mapanda, J. Mupini, M. Wuta, J. Nyamangara and R. M. Rees, “A Cross-Ecosystem Assessment of the Effects of Land Cover and Land Use on Soil Emission of Selected Greenhouse Gases and Related Soil Properties in Zimbabwe,” European Journal of Soil Science, Vol. 61, No. 5, 2010, pp. 721-733. http://dx.doi.org/10.1111/j.1365-2389.2010.01266.x
- D. J. Brown, G. Nyamadzawo and P. E. Denison, “Spatially Distributed Methane Measurement for a Tropical Dambo Wetland Landscape in Uganda,” American Geophysical Union, San Francisco, 2008. http://adsabs.harvard.edu/abs/2008AGUFM.B33B0414B
- M. A. K. Khalil, R. A. Rasmussen, M. J. Shearer, R. W. Dalluge, R. Lexin and C. Duan, “Factors Affecting Methane Emissions from Rice Fields,” Geophysical Research, Vol. 103, No. D19, 1998, pp. 25219-25231. http://dx.doi.org/10.1029/98JD01115
- B. B. Otter and M. C. Scholes, “Methane Sources and Sinks in Periodically Flooded South African Savanna,” Global Biogeochemical Cycles, Vol. 14, No. 1, 2000, pp. 97-111. http://dx.doi.org/10.1029/1999GB900068
- S. Glatzel and K. Stahr, “Methane and Nitrous Oxide Exchange in Differently Fertilized Grassland in Southern Germany,” Plant and Soil, Vol. 231, No. 1, 2001, pp. 21- 35. http://dx.doi.org/10.1023/A:1010315416866
- L. Chapuis-Lardy, N. Wrage, A. Metay, J. L. Chotte and M. Bernoux, “Soils, a Sink for N2O? A Review,” Global Change Biology, Vol. 13, No. 1, 2007, pp. 1-17. http://dx.doi.org/10.1111/j.1365-2486.2006.01280.x
- Z. Q. Xiong, G. X. Xing, H. Shuruta, G. Y. Shen, S. L. Shi and L. J. Du, “Measurement of Nitrous Oxide Emissions from Two Rice Based Cropping Systems in China,” Nutrient Cycling in Agrocecosystems, Vol. 64, No. 1-2, 2002, pp. 125-133. http://dx.doi.org/10.1023/A:1021179605327
- M. C. Scholes, R. J. Scholes, D. Parsons, R. Martin and E. Winstead, “NO and N2O Emissions from Savanna Soils Following the First Rains,” Nutrient Cycling in Agroecosystems, Vol. 48, No. 1-2, pp. 115-122. http://dx.doi.org/10.1023/A:1009781420199
- J. Dick, B. Kaya, M. Soutoura, U. Skiba, R. Smith, A. Niang and R. Tabo, “The Contribution of Agricultural Practices to Nitrous Oxide Emissions in Semi-Arid Mali,” Soil Use and Management, Vol. 24, No. 3, 2008, pp. 292- 301. http://dx.doi.org/10.1111/j.1475-2743.2008.00163.x
- F. R. Freney, “Emission of Nitrous Oxide from Soils Used from Agriculture,” Nutrient Cycling in Agroecosystems, Vol. 49, No. 1-3, 1997, pp. 1-6. http://dx.doi.org/10.1023/A:1009702832489
- A. R. Mosier, S. K. Mohanty, A. Bhadrachalam and S. P. Chakravorti, “Evolution of Dinitrogen and Nitrous Oxide from the Soil to the Atmosphere through Rice Plants,” Biology and Fertility of Soils, Vol. 9, No. 1, 1990, pp. 61- 67. http://dx.doi.org/10.1007/BF00335863
- S. Whalen and W Reeburgh, “Methane Oxidation, Production and Emission at Contrasting Sites in a Boreal Bog,” Biomicrobial Journal, Vol. 17, 2000, pp. 237-251.
- IPCC (Intergovernmental Panel on Climate Change), “Contribution of Working Group III to the Fourth Assessment Report of the Intergovernmental Panel on Climate Change,” In: B. Metz, O. R. Davidson, P. R. Bosch, R. Dave and L. A. Meyer, Eds., Climate Change 2007, Fourth Assessment Report, Cambridge University Press, Cambridge, 2007.
- S. Castaldi and A. Fierro, “A Soil-Atmosphere Methane Exchange in Undisturbed and Burned Mediterranean Shrubland of Southern Italy,” Ecosystems, Vol. 8, No. 2, 2005, pp. 182-190. http://dx.doi.org/10.1007/s10021-004-0093-z
- M. Scholes and M. O. Andreae, “Biogenic and Pyrogenic Emissions from Africa and Their Impact on the Global Atmosphere,” AMBIO, Vol. 29, No. 1, 2000, pp. 20-23.
- A. E. Altor and W. J. Mitsch, “Methane Flux from Created Riparian Marshes: Relationship to Intermittent Versus Continuous Inundation and Emergent Macrophytes,” Ecological Engineering, Vol. 28, No. 3, 2006, pp. 224- 234. http://dx.doi.org/10.1016/j.ecoleng.2006.06.006
- L. Marani and P. C. Alvala, “Methane Emission from Lakes and Floodplains in Pantanal, Brazil,” Atmospheric Environment, Vol. 41, No. 8, 2007, pp. 11627-1633. http://dx.doi.org/10.1016/j.atmosenv.2006.10.046
- FAO, “Bridging the Rice Yield Gap in China,” 2000. http://www.fao.org/docrep/003/x6905e/x6905e00.htm
- Y. F. Shi, W. L.Wu, F. Q. Meng, Z. H. Zhang, L. Zheng and D. P. Wang, “Integrated Management Practices Significantly Affect N2O Emissions and Wheat-Maize Production at Field Scale in the North China Plain,” Nutrient Cycling in Agroecosystems, Vol. 95, No. 2, 2013, pp. 203-218. http://dx.doi.org/10.1007/s10705-013-9558-9
- C. G. Scheer, R. Peter, D. W. Rowlings and J. Payero, “Nitrous Oxide Emissions from Irrigated Wheat in Australia: Impact of Irrigation Management,” Plant and Soil, Vol. 359, No. 1-2, 2012, pp. 351-362. http://dx.doi.org/10.1007/s11104-012-1197-4
NOTES
*Corresponding author.