Journal of Diabetes Mellitus
Vol.4 No.1(2014), Article ID:41893,7 pages DOI:10.4236/jdm.2014.41003
Assessing 10-year coronary heart disease risk in people with Type 2 diabetes mellitus: Framingham versus United Kingdom Prospective Diabetes Study
![]()
1Division of Epidemiology and Biostatistics, School of Population Health, University of Auckland, Auckland, New Zealand; *Corresponding Author: p.metcalf@auckland.ac.nz
2Department of Statistics, University of Auckland, Auckland, New Zealand
Copyright © 2014 Patricia A. Metcalf et al. This is an open access article distributed under the Creative Commons Attribution License, which permits unrestricted use, distribution, and reproduction in any medium, provided the original work is properly cited. In accordance of the Creative Commons Attribution License all Copyrights © 2014 are reserved for SCIRP and the owner of the intellectual property Patricia A. Metcalf et al. All Copyright © 2014 are guarded by law and by SCIRP as a guardian.
Received 18 November 2013; revised 15 December 2013; accepted 24 December 2013
ABSTRACT
Aims: Previous studies have suggested that the Framingham coronary heart disease risk prediction equation underestimates risk among people with Type 2 diabetes. We compared the 10-year absolute risks of coronary heart disease (CHD) using a Framingham equation and a United Kingdom Prospective Diabetes Study (UKPDS) equation in adults with Type 2 diabetes. Methods: Participants were from a cross-sectional survey of a randomly selected population. There were 461 people with newly (n = 132) or previously diagnosed (n = 329) diabetes aged 35 to 74 years with no past history of cardiovascular disease or nephropathy. We examined predicted 10-year CHD risk by age, gender, and newly or previously diagnosed diabetes. Results: Overall the mean 10-year CHD risks predicted by the two equations were similar. Among men, the UKPDS and Framingham scores were almost identical below 60 years of age but at older ages, the UKPDS score was 4% - 11% higher than Framingham. For women, the Framingham score was higher than the UKPDS score between ages 40 and 65 years, but the UKPDS score was about 4% - 5% higher for women aged 70 years and over. The UKPDS equation tended to give higher risk estimates in people with a predicted 10-year Framingham CHD risk above 15%. Conclusion: Framingham CHD risk scores tended to be lower than UKPDS scores primarily in people above standard thresholds for drug treatment, so the clinical impact of underestimating risk is likely to be limited. Moreover, the UKPDS equation predicted lower risks than Framingham for women and newly diagnosed diabetes at otherwise low to moderate CHD risk, which could result in later initiation of therapy in these groups if the UKPDS score was used instead of the Framingham score.
KEYWORDS
Framingham; UKPDS; Risk Assessment; Equations; Diabetes; Heart Disease
1. INTRODUCTION
Several studies have suggested that Framingham coronary heart disease (CHD) risk prediction equation underestimates risk among people with Type 2 diabetes [1-6]. Proposals to address this issue have included: adding a weighting or calibration factor to the predicted Framingham risk [7,8]; using a lower CHD risk threshold [9,10] or using the United Kingdom Prospective Diabetes Study (UKPDS) CHD risk prediction equation which was derived from a large cohort of people with newly diagnosed diabetes [1]. Comparison of the risks in patients with diabetes between the Framingham and UKPDS predicted scores, concluded that the Framingham equation underestimated CHD risk, particularly in patients at high CHD risk or with high HbA1c levels [1]. Another study concluded that the Framingham equation was not suitable for use in diabetic populations as it had a lower specificity for the identification of high-risk individuals [11].
We have previously reported that the Framingham equation showed higher 5-year cardiovascular disease risk estimates in people with Type 2 diabetes compared to the combined UKPDS CHD plus stroke equations [12]. In general, among people with Type 2 diabetes, the Framingham equations estimated higher 5-year cardiovascular disease risk estimates compared to the combined UKPDS coronary heart disease plus stroke equations [12]. However, the United Kingdom and United States of America cardiovascular risk guidelines advise the assessment of 10-year coronary heart disease (CHD) risk [13-17], rather than the assessment of 5-year cardiovascular disease (CHD plus stroke) risk used in New Zealand [18].
We compare the 10-year CHD risk in people with Type 2 diabetes using the Framingham [19] and UKPDS [1] prediction equations in a population-based sample of people with known and newly diagnosed diabetes.
2. METHODS
2.1. Study Design and Sample
The Auckland Diabetes, Heart and Health Study, a cross-sectional survey of diabetes and cardiovascular disease risk factors, in the city of Auckland (population approximately 1 million), New Zealand, was carried out between December 2001 and November 2003. Adults aged 35 - 74 years were recruited from 2 sampling frames: one was a cluster sample where random starting point addresses were obtained from Statistics New Zealand and the probability of selection was proportional to the number of people living in that mesh block (response rate 61.3%); and the other was a random sample taken from the November 2000 Auckland electoral rolls stratified into 5-year age bands and included all people living in the Auckland area (response rate 60%). The 2 sampling frames were taken from the same population, and were necessary because many Pacific people living in Auckland are not on the electoral roll. All participants gave individual informed consent. Ethical Committee approval was obtained from the Health and Disability Ethics Committees.
Participants were classified as having newly diagnosed diabetes mellitus using 1998 WHO criteria of fasting glucose ≥7.0 mmol/L or 2-hour post glucose load of ≥11.1 mmol/L for diabetes [20]. Of the 4049 participants interviewed, 584 participants had newly or previously diagnosed diabetes mellitus and were aged greater than 20 years at diagnosis (those diagnosed prior to age 21 years were excluded). A further 98 people who had a past history of cardiovascular disease events were excluded and a further 25 with urinary albumin >300 mg/L (the threshold level for nephropathy) were also excluded, leaving 461 study participants.
2.2. Questionnaires and Measurements
A self-administered questionnaire was checked prior to the participant leaving the study centre. Questions included date of birth, smoking history and age that diabetes had been diagnosed.
Participants fasted from 10pm the evening before the interview and collected a first morning urine sample which they brought with them to the study centre that morning. A 75 gram oral glucose tolerance test was carried out in participants who had not been previously diagnosed with diabetes, and a fasting and 2 hour post venous blood samples were collected for glucose measurement. Plasma glucose was measured using an enzymatic method (Roche Products (NZ)). Serum cholesterol was measured using the enzymatic method of Allain et al. [21], and HDL-cholesterol was measured after precipitation of apolipoprotein B-containing lipoproteins using a combination of a polyion and a divalent cation (Roche). Urinary albumin was measured using an immunoturbidimetric method. Haemoglobin A1c was measured by High Performance Liquid Chromatography on a Biorad Variant II instrument. The inter-batch percentage coefficients of variation for low control material were glucose 2.1, cholesterol 1.4, HDL 2.0, HbA1c 1.7, and microalbumin 4.8; those of abnormal control were glucose 1.3, cholesterol 1.2, HDL 2.7, HbA1c 2.1, and microalbumin 3.6.
An Omron-Hem-706 oscillometric blood pressure pulse monitor was used to measure blood pressure twice in the sitting position after a rest of more than 5 minutes and the average calculated. Normal and obese cuff sizes were used where appropriate.
Ten-year coronary heart disease (CHD) risks were calculated using the Framingham [19] and UKPDS 56 [1] prediction equations, based on measurements of age, gender, smoking status, systolic blood pressure, total and HDL cholesterol, HbA1c (UKPDS only), known diagnosis of diabetes and time since diagnosis (UKPDS only).
The following equations were used to calculate the Framingham CVD risk [19] estimates:
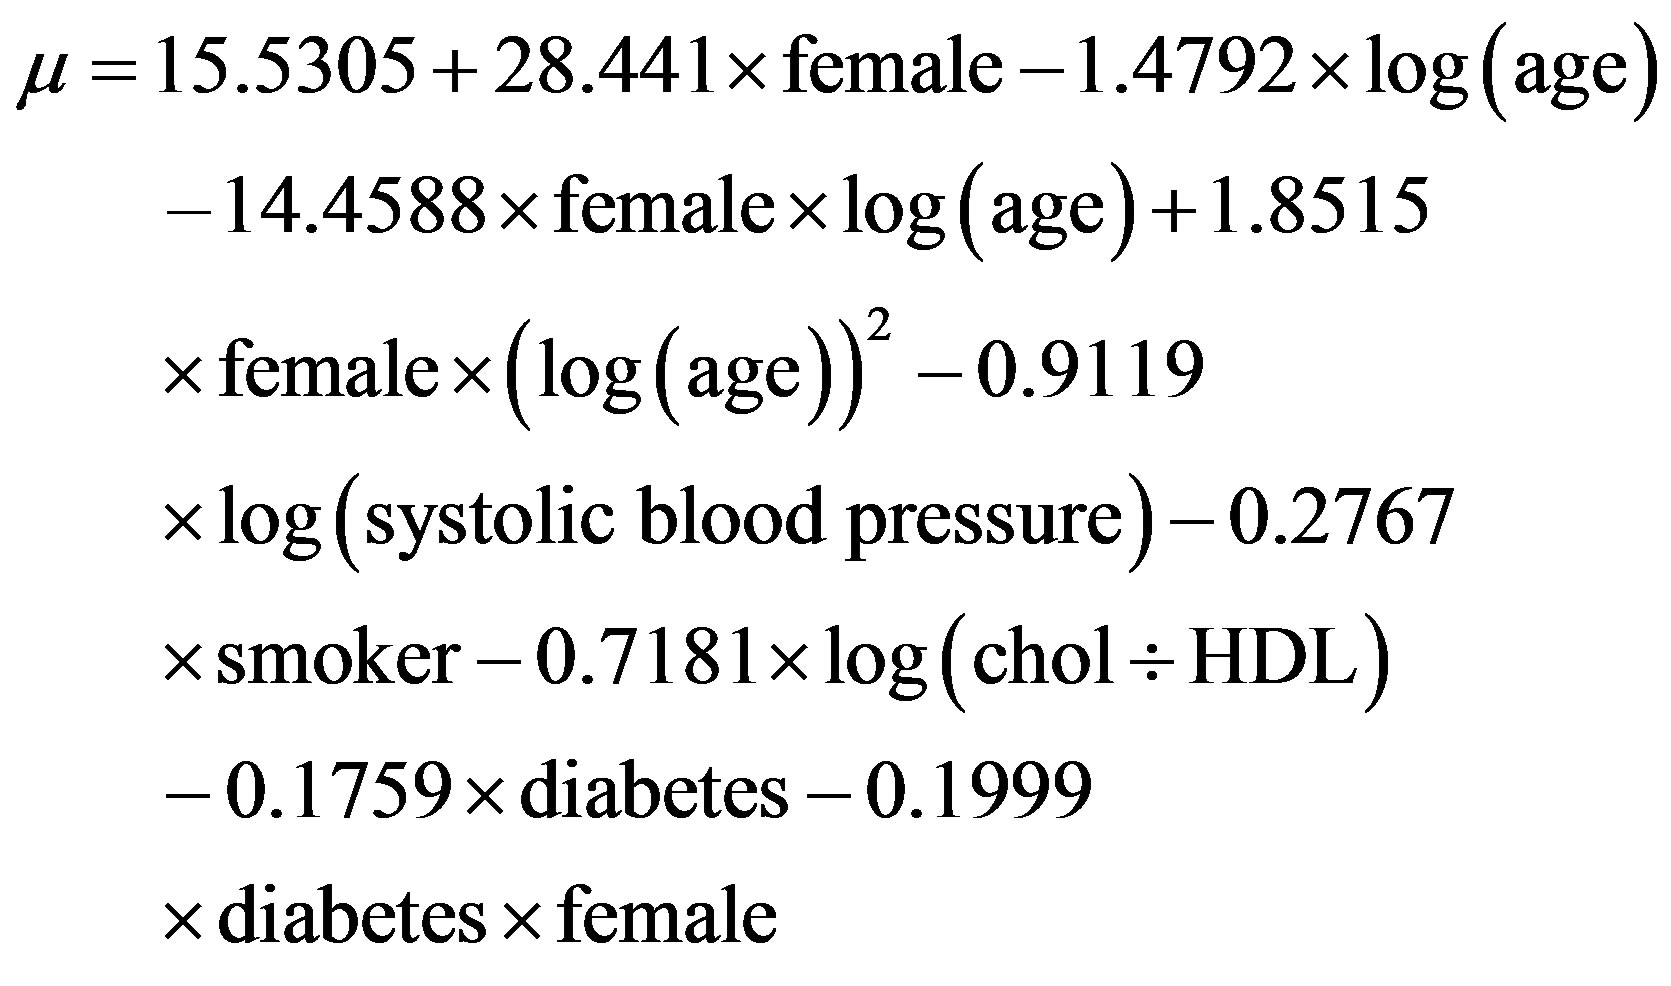
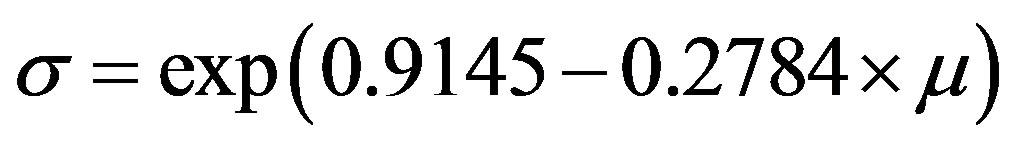

where log is the natural logarithm, diabetes = 1 for people with previously diagnosed diabetes, and 0 for people with newly diagnosed diabetes, female is 1 for a female and 0 for a male, and smoker is 1 for a current cigarette smoker and 0 for a non-smoker.
The UKPDS CHD [1] risk was calculated using the following equations:
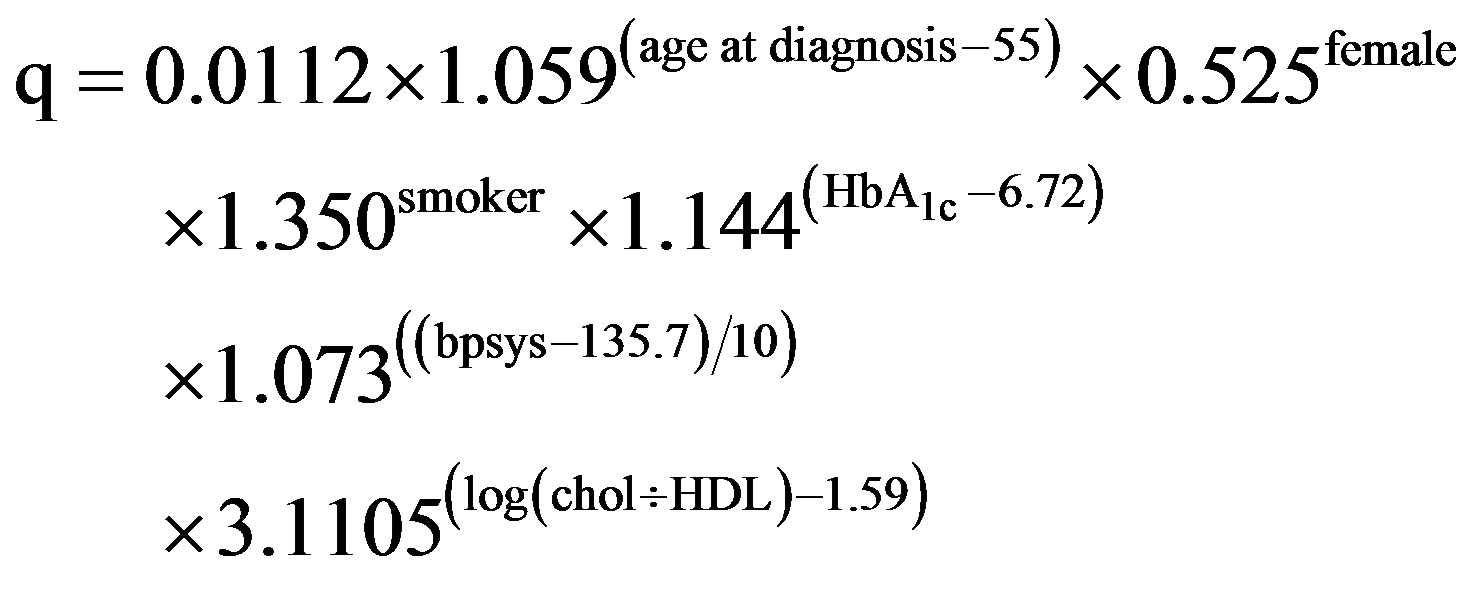
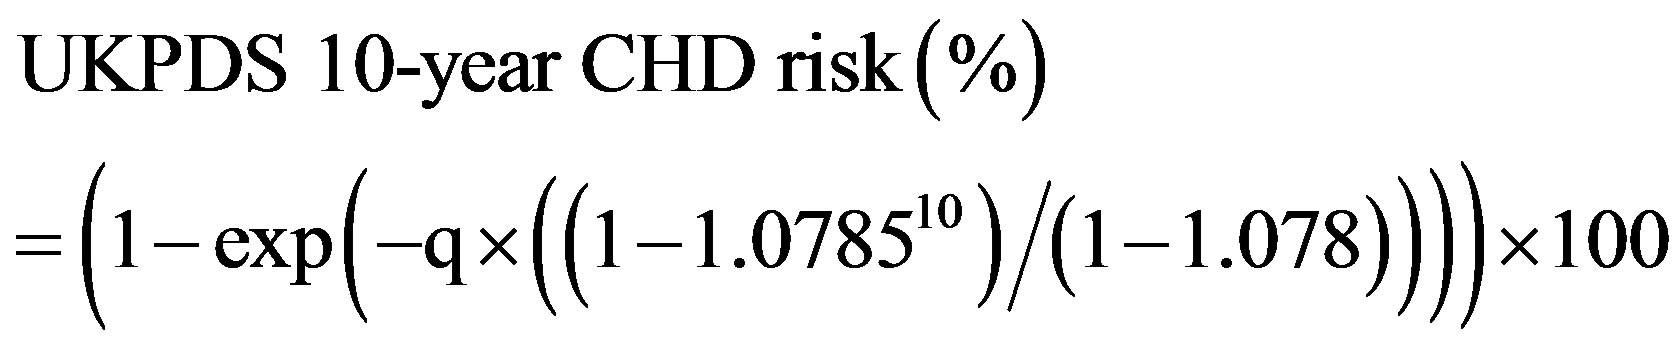
where bpsys is systolic blood pressure in mmHg, and duration is the duration of the diagnosed diabetes. As only single measurements were made of HbA1c and lipids on each participant (instead of calculating the mean from two measurements as was used when the model was constructed), we used the regression diluted parameter estimates given in the Appendix of Stevens et al. [1].
2.3. Statistical Analyses
Statistical analyses were carried out using SAS version 9.2 [22]. SAS survey procedures were used to calculate mean 10-year CHD risks by age groups, gender and newly and previously diagnosed cases of diabetes using analysis of variance to take into account the clusters, weighting and strata [23]. The equations for lines and R2 were obtained by linear regression [22]. The relationship between the two variables in Figure 1 are locally weighted regression lines.
3. RESULTS
The clinical and biochemical characteristics by gender and time of diabetes diagnosis are shown in Table 1. The 10-year CHD risks estimated using the Framingham equation were higher in women and newly diagnosed diabetics than those estimated using UKPDS. Conversely, the UKPDS risks were higher in men and previously diagnosed diabetics. The mean difference in the risk score for all participants was 1.59% (95% CI: 0.91 - 2.26; P ≤ 0.001) with a slightly higher average risk based on the UKPDS compared with the Framingham equation.
3.1. Relationship between UKPDS and Framingham Scores
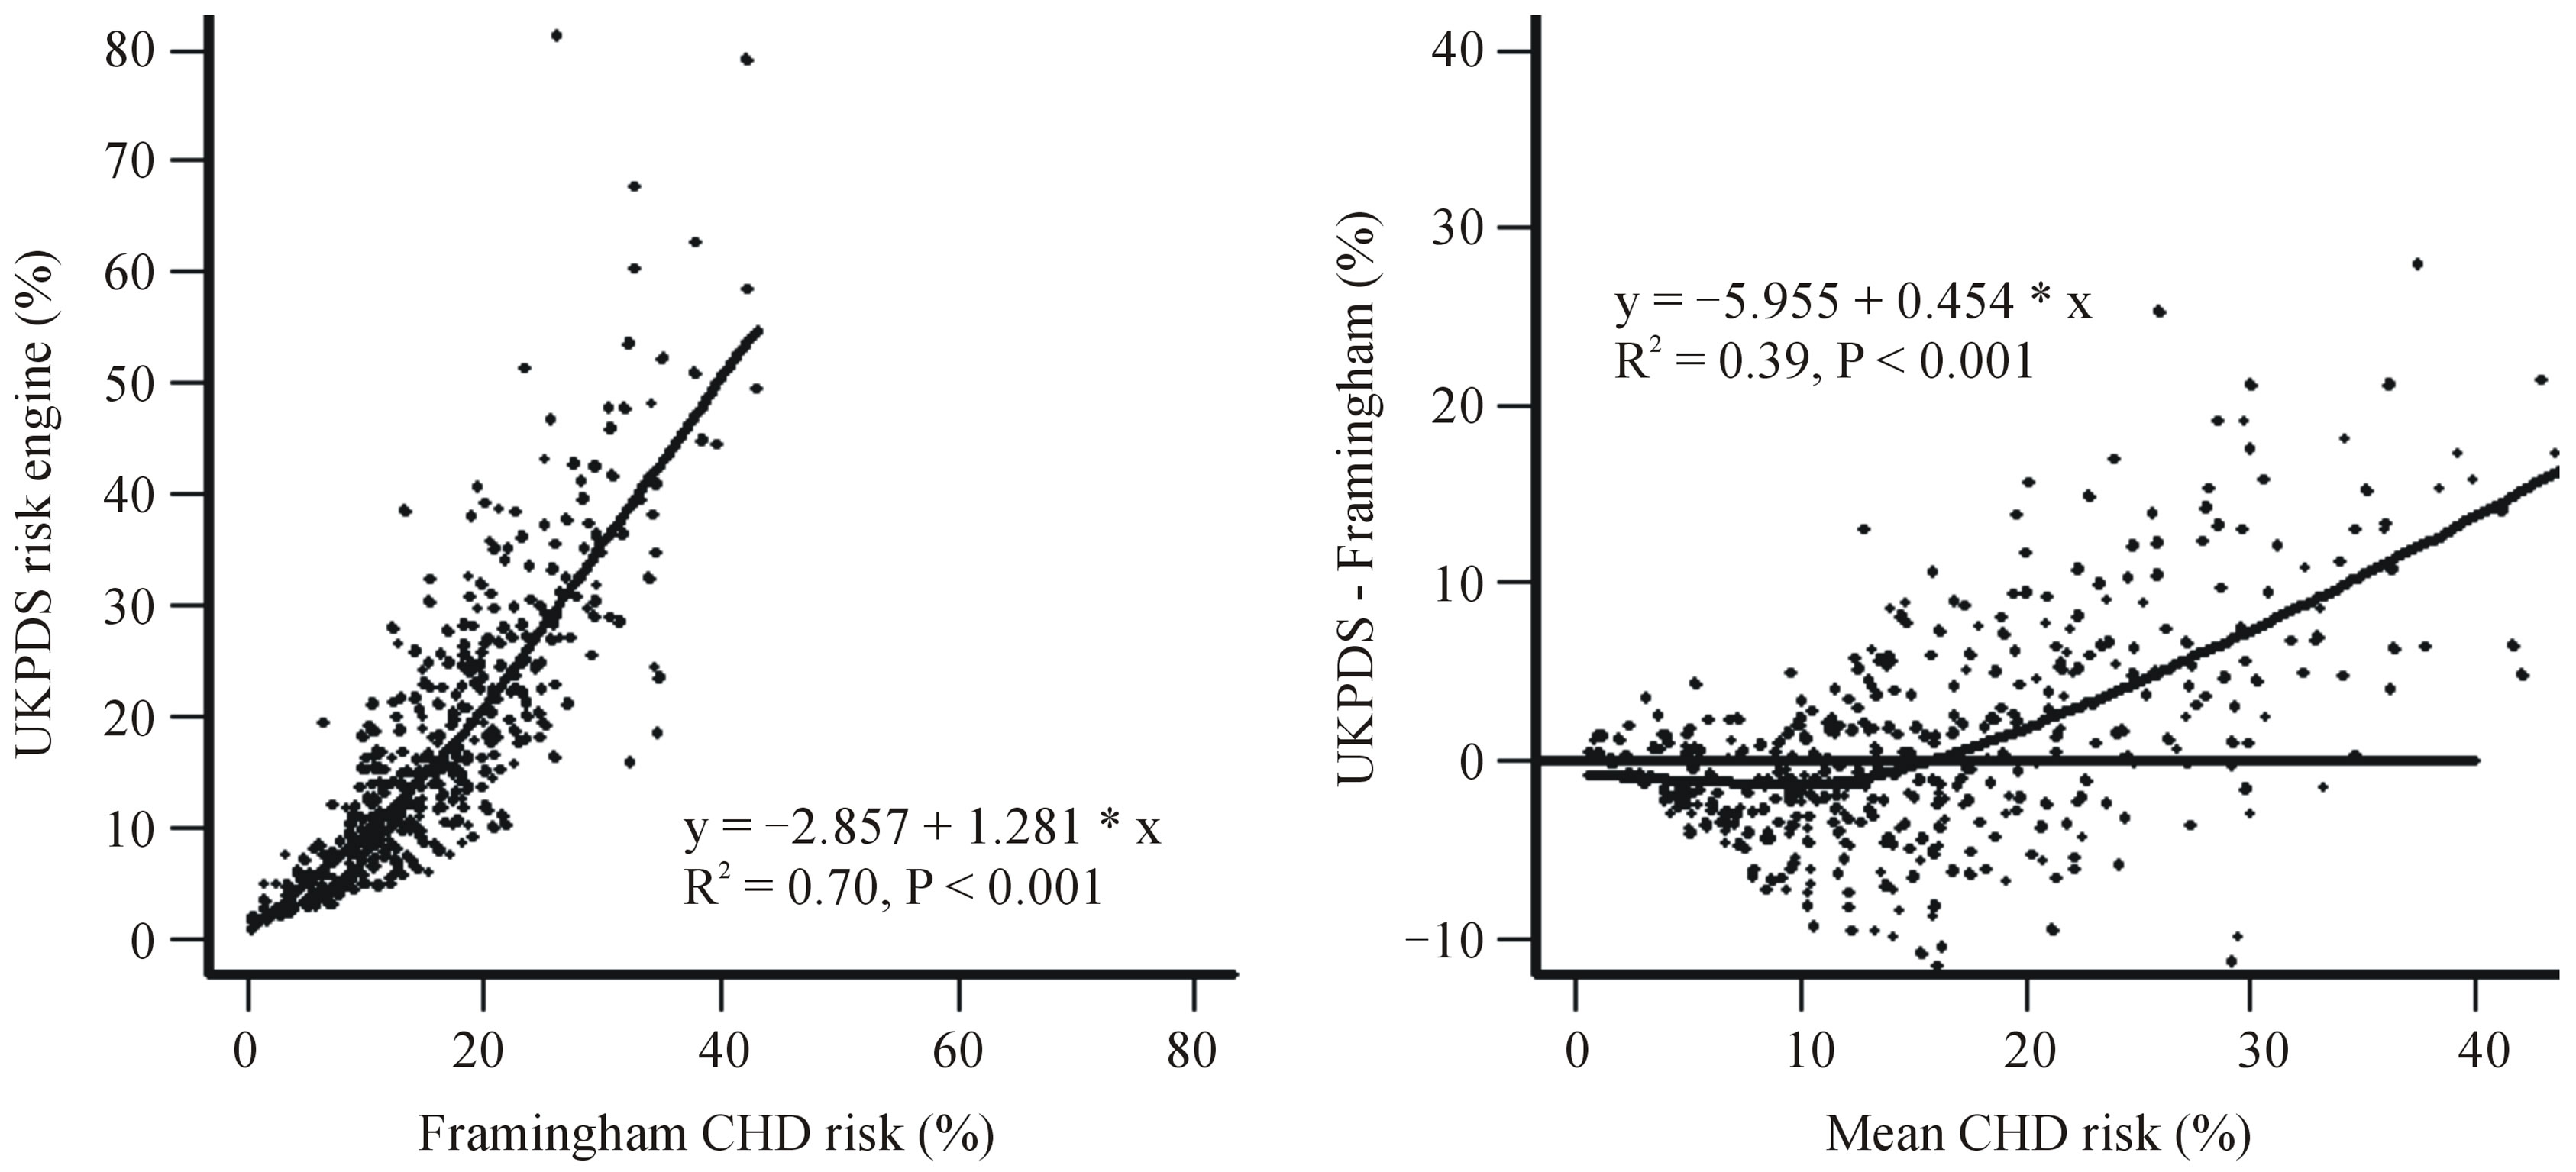
Figure 1(a) shows the relationship between the UKPDS and the Framingham 10-year CHD risks with a locally weighted regression and smoothing line. There was an approximately linear association between the two methods with a slope of 1.28 (95% CI: 1.20 - 1.36) and a correlation coefficient of 0.84. There was a trend towards higher estimates using the UKPDS equation in people with a higher Framingham predicted risk. Figure 1(b) shows a locally weighted regression and smoothing line of the association between the difference in risk between the two equations and the estimated Framingham risk. This indicates that the UKPDS risk equation generates higher predicted CHD risks at higher Framingham predicted CHD risk levels (above about 15%), and lower risks at lower Framingham CHD risk levels. The correlation coefficient for Figure 1(b) was 0.62.
3.2. Mean 10-Year Risks in Women, Men, and Newly and Previously Diagnosed Diabetes by Age Group
Figure 2 shows mean 10-year risks of CHD calculated using the two equations in men Figure 2(a), women Figure 2(b), and newly Figure 2(c) and previously Figure 2(d) diagnosed diabetes by age group. The mean Framingham and UKPDS scores were almost identical before age 60 years in men, after which the UKPDS score was 4-11 absolute percentage points higher than the Framingham scores (Figure 2(a)). In women Framingham scores tended to be higher than UKPDS scores until about age 70 years, with a statistically significantly higher Framingham risk between ages 50 and 59 years of about 4 - 5 percentage points. (Figure 2(b)). After age 70 years, the UKPDS score was 4.5 absolute percentage points higher than the Framingham score in women.
The pattern of scores in people with newly diagnosed diabetes (Figure 2(c)) was similar to that for women with higher Framingham than UKPDS scores in under 65 year olds, although not statistically significantly different, whereas for people with previously diagnosed diabetes (Figure 2(d)) the pattern was similar to that for males with statistically significant higher UKPDS than Framingham scores in older people.
4. DISCUSSION
Concerns that the Framingham CHD risk prediction equation underestimates risk compared to the UKPDS equation and will lead to under-treatment of patients with diabetes are not supported by this study. We found that Framingham scores tended to be lower than UKPDS scores primarily in diabetic people who already meet standard treatment thresholds based on their Framingham scores. Indeed, use of the UKPDS score could lead to lower treatment rates in women and in people with newly diagnosed diabetes, who tended to score more highly
 (a) (b)
Figure 1. (a) Plot of UKPDS 10-year coronary heart disease risk versus Framingham risks, and (b) Bland-Altman plot showing the differences in 10-year coronary heart disease risk calculated by the UKPDS and Framingham equation and the mean of UKPDS and Framingham CHD risk.
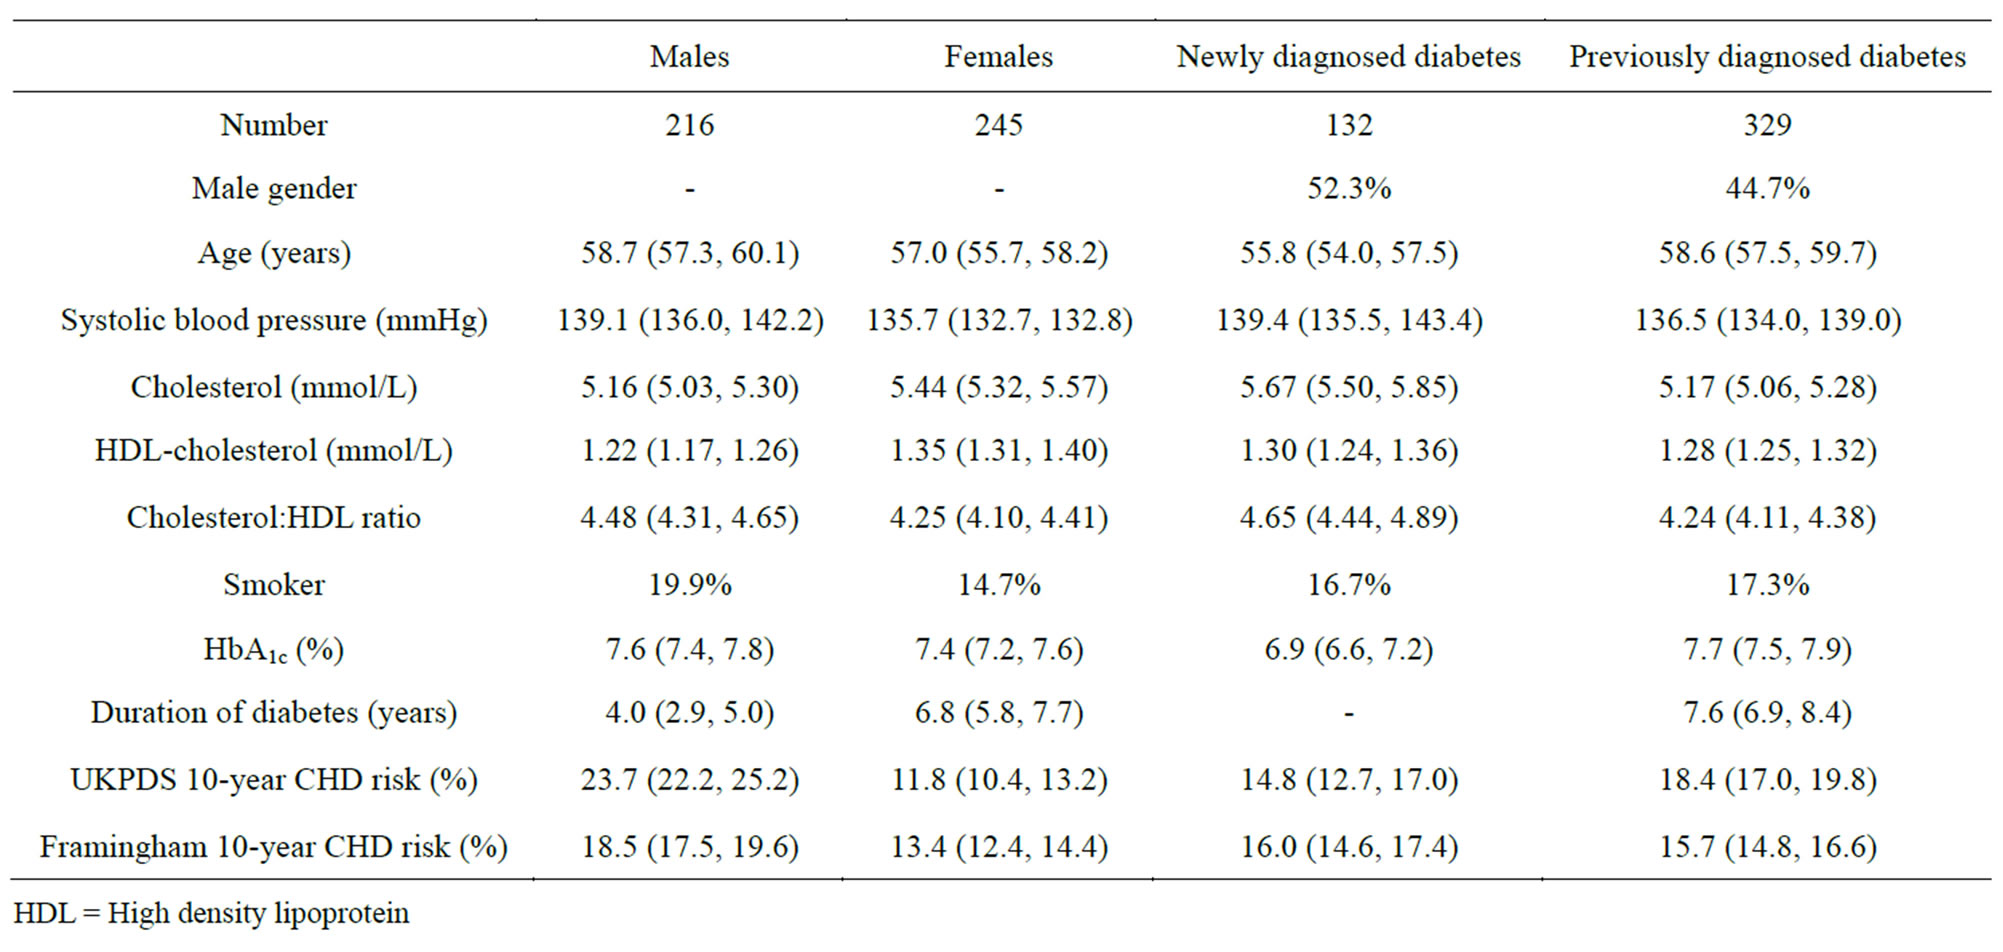
Table 1. Mean (95% confidence interval) or percentages for clinical and biochemical characteristics of participants with Type 2 diabetes by gender and time of diagnosis.
HDL = High density lipoprotein using the Framingham compared to the UKPDS equations.
A major strength of our study was that participants were from a random sample of the Auckland population and that both newly and previously diagnosed cases of diabetes were included. A further advantage was that all relevant cardiovascular disease risk factors for CHD risk estimation were measured—whereas in some other studies comparing Framingham and UKPDS, HDL-cholesterol measurements were not available and were imputed or treated as a constant [5,11].
A potential limitation of the current study is that the type of diabetes was not recorded. The UKPDS risk engine was only designed for use in people with Type 2 diabetes [1] while the Framingham equation estimated risk for people with diabetes included both Type 1 and Type 2 diabetes [19]. However, we excluded people reporting a diagnosis of diabetes prior to 20 years of age, who would be more likely to have Type 1 diabetes. A further limitation is that we may have underestimated the Framingham risk score as ECG-diagnosed LVH—a variable in the Framingham equation—was not assessed in our study and LVH is more common among diabetic patients [24].
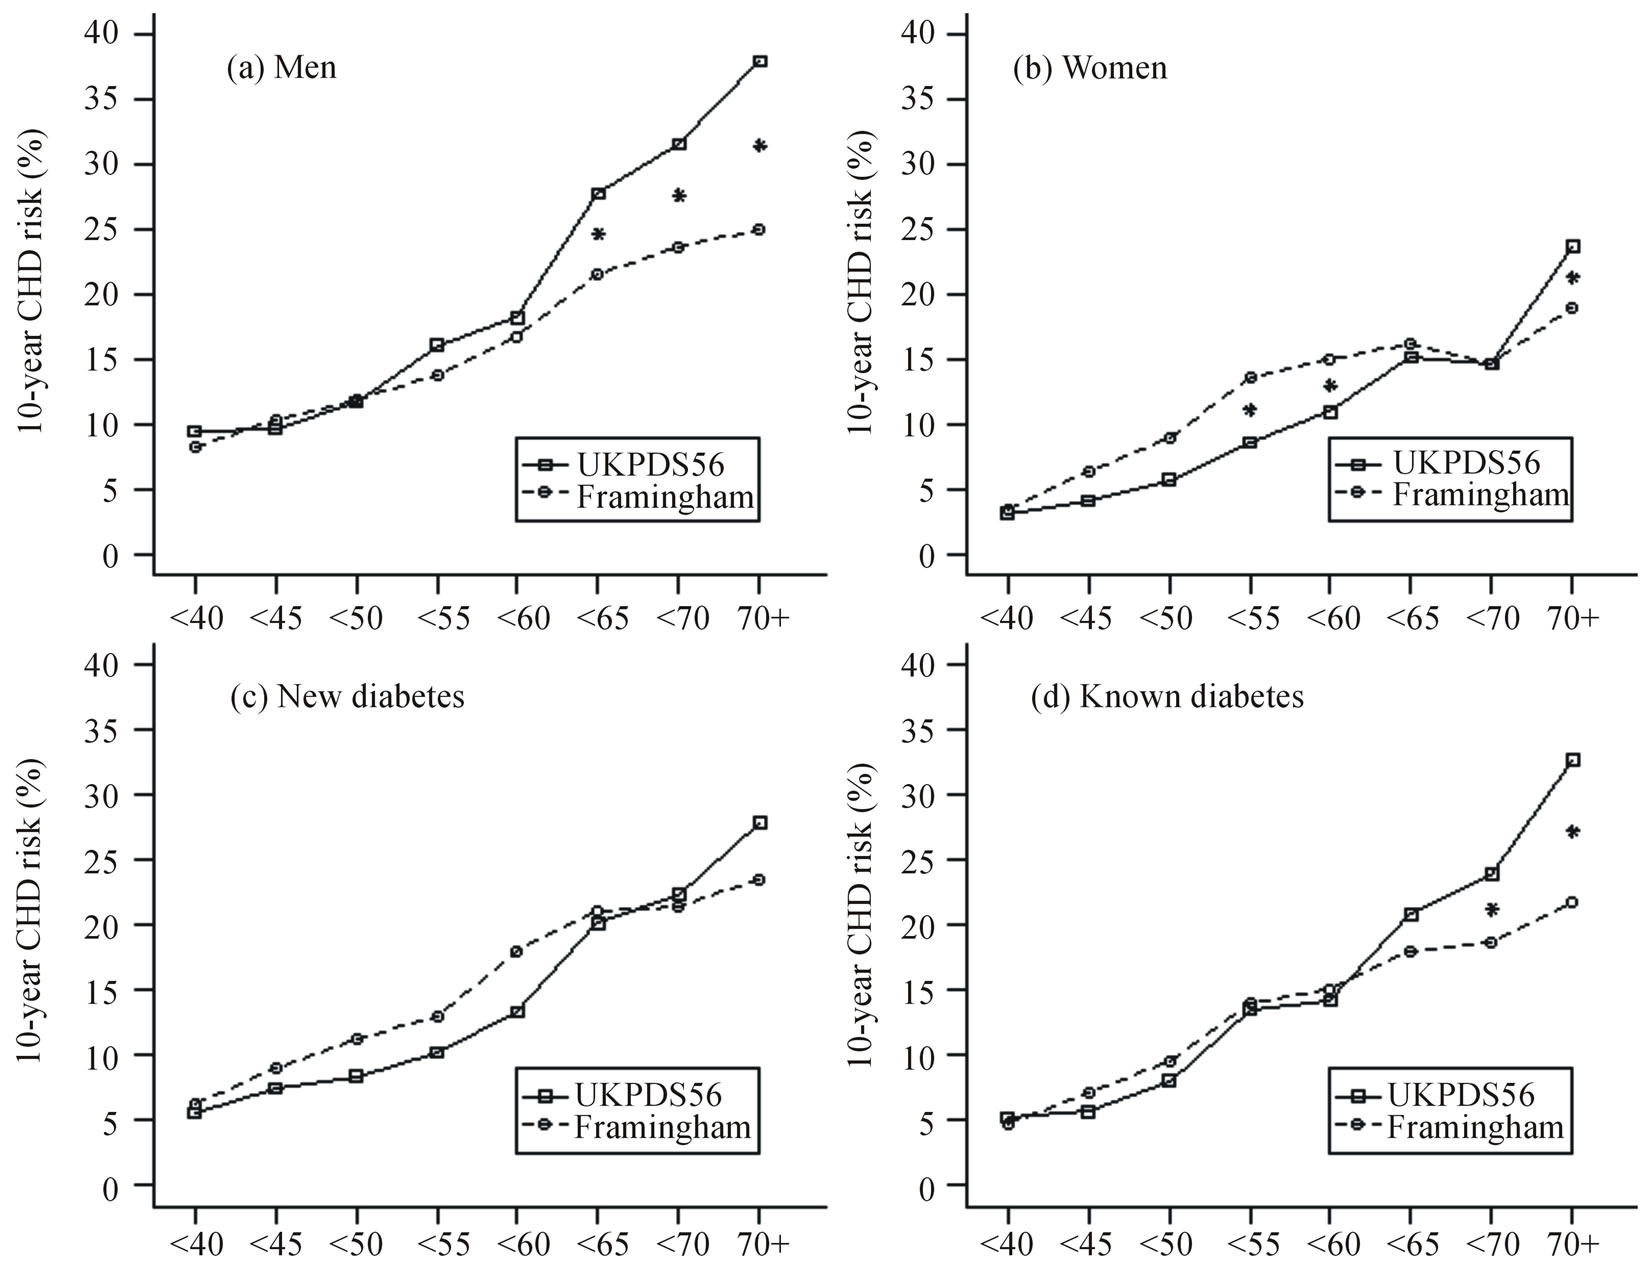
Figure 2. Ten-year risk of coronary heart disease estimated using the UKPDS56 and Framingham equations by age group. (a) 216 males, (b) 245 females, (c) 132 people with newly diagnosed diabetes, and (d) 329 people with previously diagnosed diabetes.
*between lines indicates P < 0.05 from other mean point in that age group.
In contrast to a previous survey that reported a nonlinear relationship between the UKPDS risk engine and Framingham 10-year coronary heart disease risk in UK diabetic patients [5], we found a predominantly linear relationship at low levels of CHD risk. The reason for this discrepancy is unknown, but may be that patients in the UK study were all assumed to have HDL-cholesterol levels of 1.2 mmol/L, as it was not routinely measured [5]. In our study, HDL-cholesterol levels ranged from 0.68 to 3.68 mmol/L in men and 0.65 to 2.58 mmol/L in women. Furthermore, another UK study showed that using measured HDL-cholesterol versus a population average for risk assessment resulted in higher Framingham CHD risk estimates [25].
Other studies support our findings. A UK study of people with newly diagnosed Type 2 diabetes showed higher Framingham than UKPDS CHD risk scores at levels of 10-year CHD risk less than 30%, but lower Framingham scores in people with risk scores above 30% [10]. Stephens et al. [8] reported that the risk calculation tools using the Framingham equation estimated CHD risk better in diabetic patients than the UKPDS equation. The Asia Pacific Cohort Studies compared risk scores with diabetes status as an independent factor, separate scores for those with diabetes and those without, and a fixed method which fixed the CHD rate at 10 years as 7% in people with diabetes [26]. Although there was little to separate the methods, the authors favoured the model with diabetes as a variable in the model.
A study carried out in UK diabetic patients reported that the mean difference between 10-year UKPDS and Framingham scores was 5.9% higher for UKPDS in men and 0.7% lower for UKPDS in women [5]. This compares with the mean difference of 5.2% higher UKPDS scores in men and 1.6% lower UKPDS scores in women in the current study.
In conclusion, it is unlikely that replacing Framingham based CHD risk prediction scores with UKPDS scores to estimate risk in patients with diabetes will lead to an increased frequency of treatment. The opposite is perhaps more likely given that the UKPDS scores predict lower risks in diabetics at moderate CHD risk who are close to treatment thresholds of CHD risk.
ACKNOWLEDGEMENTS
We thank the technical and clerical staff who conducted the study so capably and efficiently. This study was funded by the Health Research Council of New Zealand who had no role in the design, collection, analysis or interpretation of the data. The authors declare that they have no conflict of interest.
REFERENCES
- Stevens, R., Kothari, V., Adler, A. and Stratton, I. (2001) The UKPDS risk engine: A model for the risk of coronary heart disease in Type II diabetes (UKPDS 56). Clinical Science, 101, 671-679. http://dx.doi.org/10.1042/CS20000335
- McEwan, P., Williams, J., Griffiths, J., Bagust, A., Peters, J., Hopkinson, P. and Currie, C.J. (2004) Evaluating the performance of the Framingham equations in a population with diabetes. Diabetic Medicine, 21, 318-323. http://dx.doi.org/10.1111/j.1464-5491.2004.01139.x
- Coleman, R., Stevens, R., Retnakaran, R. and Holman, R. (2007) Framingham, SCORE, and DECODE risk equations do not provide reliable cardiovascular risk estimates in Type 2 diabetes. Diabetes Care, 30, 1292-1294. http://dx.doi.org/10.2337/dc06-1358
- Hernaez, R., Choque, L., Gimenez, M., Marquez, J. and Conget, I. (2004) Coronary risk assessment in subjects with Type 2 diabetes mellitus. General population-based scores or specific scores? Revista Española de Cardiología, 57, 577-580.
- Song, S. and Brown, P. (2004) Coronary heart disease risk assessment in diabetes mellitus: Comparison of UKPDS risk engine with Framingham risk assessment and its clinical implications. Diabetic Medicine, 21, 238- 245. http://dx.doi.org/10.1111/j.1464-5491.2004.01116.x
- Protopsaltis, I. and Nikolopoulos, G. and Melidonis, A. (2004) Comparative study of the prognostic value for coronary heart disease risk between the UK prospective diabetes study and Framingham models. Diabetes Care, 27, 277-278. http://dx.doi.org/10.2337/diacare.27.1.277
- New Zealand Guidelines Group. (2003) The assessment and management of cardiovascular risk. Wellington, New Zealand.
- Stephens, J., Ambler, G., Vallance, P., Betteridge, D., Humphries, S. and Hurel, S. (2004) Cardiovascular risk and diabetes. Are the methods of risk prediction satisfactory? The European Journal of Cardiovascular Prevention & Rehabilitation, 11, 521-528.
- Yeo, W. and Yeo, K. (2001) Predicting CHD risk in patients with diabetes mellitus. Diabetic Medicine, 18, 341- 344. http://dx.doi.org/10.1046/j.1464-5491.2001.00510.x
- Guzder, R., Gatling, W., Mullee, M., Mehta, R. and Byrne, C. (2005) Prognostic value of the Framingham cardiovascular risk equation and the UKPDS risk engine for coronary heart disease in newly diagnosed Type 2 diabetes: Results from a United Kingdom study. Diabetic Medicine, 22, 554-562. http://dx.doi.org/10.1111/j.1464-5491.2005.01494.x
- Game, F., Bartlett, W., Bayley, G. and Jones, A. (2001) Comparative accuracy of cardiovascular risk prediction methods in patients with diabetes mellitus. Diabetes, Obesity and Metabolism, 3, 279-286. http://dx.doi.org/10.1046/j.1463-1326.2001.00131.x
- Metcalf, P., Wells, S., Scragg, R. and Jackson, R. (2008) Comparison of three different methods of assessing cardiovascular disease risk in New Zealanders with Type 2 diabetes mellitus. NZ Medical Journal, 121, 49-57.
- National Collaborating Centre for Primary Care (NCCPC) (2008) Lipid modification: Cardiovascular risk assessment and the modification of blood lipids for the primary and secondary prevention of cardiovascular disease. Clinical guideline 67. London, NICE.
- Clinical Knowledge Summaries (CKS). (2008) Cardiovascular risk assessment and management. Version 1.5. Newcastle upon Tyne, CKS.
- Scottish Intercollegiate Guidelines Network (SIGN). (2007) Risk estimation and the prevention of cardiovascular disease. SIGN Publication No. 97. Edinburgh, SIGN.
- Joint British Societies (JBS). (2005) JBS 2: Joint British Societies’ guidelines on prevention of cardiovascular disease in clinical practice. Heart, 91, V1-V5. http://dx.doi.org/10.1136/hrt.2005.079988
- Expert panel on detection e, and treatment of high blood cholesterol. (2001) Executive summary of the third report of the National Cholesterol Education Program (NCEP) expert panel on detection, evaluation, and treatment of high blood cholesterol in adults. The Journal of the American Medical Association, 285, 2486-2497.
- Jackson, R. (2000) Updated New Zealand cardiovascular disease risk-benefit prediction guide. British Medical Journal, 320, 709-710. http://dx.doi.org/10.1136/bmj.320.7236.709
- Anderson, K., Odell, P., Wilson, P. and Kannel, W. (1990) Cardiovascular disease risk profiles. American Heart Journal, 121, 293-298. http://dx.doi.org/10.1016/0002-8703(91)90861-B
- Alberti, K. and Zimmet, P. (1998) Definition, diagnosis and classification of diabetes mellitus and its complications. Part 1: Diagnosis and classification of diabetes mellitus. Provisional report of a WHO consultation. Diabetic Medicine, 15, 539-553. http://dx.doi.org/10.1002/(SICI)1096-9136(199807)15:7<539::AID-DIA668>3.0.CO;2-S
- Allain, C., Poon, L., Chan, C., Richmond, W. and Fu, P. (1974) Enzymatic determination of total serum cholesterol. Clinical Chemistry, 20, 470-475.
- SAS Institute Inc. (2011) SAS/STAT User’s Guide. Version 9.3. SAS Institute Inc, Cary.
- Metcalf, P. and Scott, A. (2009) Using multiple frames in health surveys. Statistics in Medicine, 28, 1512-1523. http://dx.doi.org/10.1002/sim.3566
- Abbot, R., Donahue, R., Kannel, W. and Wilson, P. (1988) The impact of diabetes on survival following myocardial infarction in men vs women. The Framingham Study. The Journal of the American Medical Association, 260, 3456- 3460. http://dx.doi.org/10.1001/jama.1988.03410230074031
- Wilson, S., Johnston, A., Robson, J., Poulter, N., Collier, D., Feder, G. and Caulfield, M.J. (2003) Predicting coronary risk in the general population—Is it necessary to measure high-density lipoprotein cholesterol? Journal of Cardiovascular Risk, 10, 137-141. http://dx.doi.org/10.1097/00043798-200304000-00009
- Asia Pacific Cohort Studies Collaboration. (2006) Coronary risk prediction for those with and without diabetes. The European Journal of Cardiovascular Prevention & Rehabilitation, 13, 30-36.