Journal of Diabetes Mellitus
Vol. 2 No. 2 (2012) , Article ID: 19345 , 9 pages DOI:10.4236/jdm.2012.22027
Elevated glucagon-like peptide-1 on a high-fat diet feeding prevents the incidence of diabetes mellitus in Spontaneously Diabetic Torii Leprfa rats
![]()
1Japan Tobacco Inc., Central Pharmaceutical Research Institute, Osaka, Japan; *Corresponding Author: takeshi.ota@jt.com
2Japan Tobacco Inc., Central Pharmaceutical Research Institute, Toxicology Research Laboratories, Hadano, Japan
3Laboratory of Animal Reproduction, Graduate School of Agricultural Science, Tohoku University, Sendai, Japan
Received 24 January 2012; revised 23 February 2012; accepted 15 March 2012
Keywords: Glucagon-like peptide-1; High fat diets; SDT fatty rats
ABSTRACT
Nutritional regulation plays a critical role to reduce the incidence or progression of diabetes mellitus. In this study, we investigated the effects of a high-fat diet on Spontaneously Diabetic Torii Leprfa (SDT fatty) rats, a novel model for obese type 2 diabetes. The SDT fatty rats were divided into two dietary groups, which were fed a high-fat diet or a standard diet for 18 weeks, from 6 to 24 weeks of age. The calorie intake in the high-fat diet (HF) group was reduced after 10 weeks of age and the group inhibited an incidence of diabetes. Interestingly, the HF induced an increase of serum glucagonlike peptide-1 (GLP-1) levels in SDT fatty rats with refeeding. Fat tissue weights in the HF group increased, but the visceral fat/subcutaneous fat (V/S) ratio decreased. Moreover, histopathological observations revealed an improvement of the pancreatic abnormalities and fatty liver in the HF group. In conclusion, a preventive effect on diabetes in rats fed a high-fat diet has a relation with an increase in incretin hormone, and it might be advantageous for prevention of incidence or progression of diabetes to develop functional foods inducing an increase in incretin hormone.
1. INTRODUCTION
Type 2 diabetes has increased worldwide in incidence with excessive calorie intake and sedentary life styles. Since most of the morbidity and mortality in type 2 diabetes arises from long-term complications, early detection and prevention would be expected to have a tremendous beneficial human, medical, and economic impact. The basic management of type 2 diabetes is achieved by lifestyle interventions such as dietary changes and exercise [1-3].
It is reported that reducing energy intake will lower the risk factors for cardiovascular disease and type 2 diabetes and should thereby delay their onset [4]. There are many studies showing that the development of certain diseases is influenced by dietary components such as saturated fats, the glycemic index, salt and so on [5-7]. Now, food no longer is seen as simply the provider of energy, but it is expected to provide physiological benefits for good health and productive lifestyles.
Spontaneously Diabetic Torii Leprfa (SDT fatty) rats, made by introducing the allele of the Zucker fatty rat into the SDT rat genome, represent a new model for obese type 2 diabetes [8]. SDT fatty rats show hyperphagia, which leads to overt obesity, and hyperglycemia and hyperlipidemia are observed at younger ages compared to male SDT rats. Furthermore, with an early incidence of diabetes mellitus, diabetes associated complications in the SDT fatty rat are seen at younger ages that in the SDT rats [9-14].
In this study, the response of SDT fatty rats to a highfat diet was investigated to understand the predisposition to diabetes. We studied the effect of a high-fat diet on the biological parameters, glucagon-like peptide-1 (GLP-1) release, fat tissue weights, and histopathological changes in pancreas and liver.
2. MATERIALS AND METHODS
2.1. Animals and Diets
This experiment was conducted in compliance with the Guidelines for Animal Experimentation of our biological/pharmacological research laboratories. All the experiments obtained the approval of the Animal Experiment Committee of Japan Tobacco. Female SDT fatty rats at 6 weeks of age from our colonies were used (Japan Tobacco Inc., Central Pharmaceutical Research Institute, Takatsuki, Japan). The rats were kept in metal cages, with an animal/cage in a climate-controlled room with a temperature of 23˚C ± 3˚C, humidity of 55% ± 15%, and a 12-h light cycle. The SDT fatty rats were divided into two groups. One group (n = 6) was fed a standard diet (14% fat, 25% protein, 61% carbohydrate based on percentage of total calories, CRF-1, Charles River Japan, Yokohama, Japan) from 6 to 24 weeks of age, and the other group (n = 6) was fed a high-fat diet (62.2% fat, 19.5% protein, and 18.3% carbohydrate based on total calories, Oriental Yeast Co., Ltd., Tokyo, Japan). Table 1 presents the ingredient composition of the diets. Water was provided ad libitum. The energy contents of the standard and high-fat diets were 3.59 and 5.04 kcal/g, respectively. The satellite group (n = 4) for each diet was ready for the evaluation of plasma GLP-1 levels at 10 weeks of age.
2.2. Biological Parameters
Body weight, calorie intake, serum glucose, insulin, triglyceride (TG), total cholesterol (TC), and leptin were evaluated every 2 weeks. Blood samples were collected from the tail vein of rats. Serum glucose, TG, and TC levels were measured using commercial kits (Roche
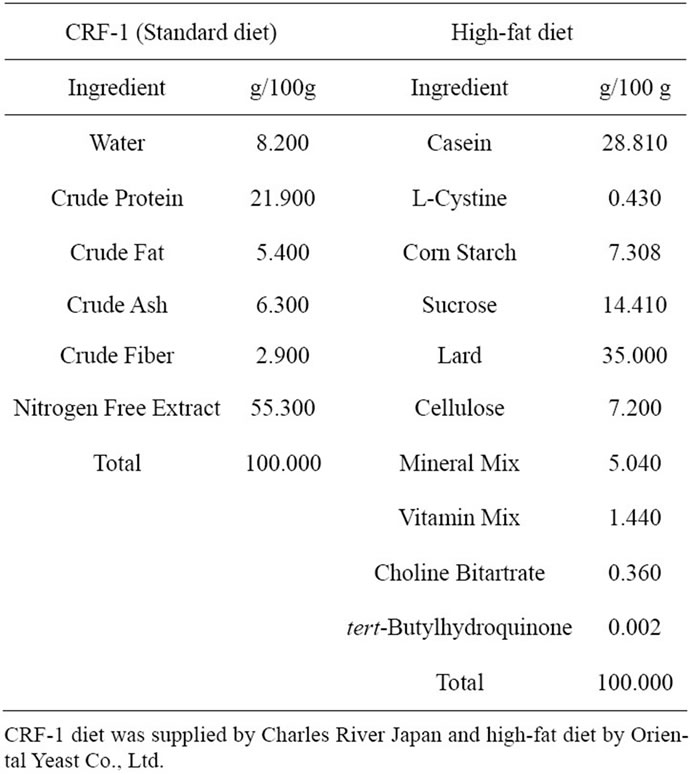
Table 1. Ingredient composition of the experimental diet.
Diagnostics, Basel, Switzerland) with an automatic analyzer (Hitachi 7180; Hitachi, Tokyo, Japan). Serum insulin or leptin levels were measured with a rat insulin or leptin enzyme-linked immunosorbent assay (ELISA) kit (Morinaga Institute of Biological Science, Yokohama, Japan).
2.3. Glucose Tolerance Test
A glucose solution (2 g/kg) was orally administered to 4-h-fasted rats at 23 weeks of age, and blood samples were taken at 0 (before glucose loading), 30, 60, and 120 min after glucose loading. The serum glucose and insulin levels were measured as described above. The glucose or insulin area under the curve (AUC) was calculated, respectively.
2.4. Fat Tissue Weight
Visceral and subcutaneous fat weights in SDT rats were determined at 24 weeks of age by computed tomography (CT) analysis with a laboratory X-ray CT device (LATheta, ALOKA Co., LTD., Osaka, Japan). The rats were anesthetized with an intraperitoneal injection of pentobarbital (50 mg/kg) (Tokyo chemical industry, Tokyo, Japan), and approximately 20 CT photographs per rat were taken at 5 mm intervals between the diaphragm and lumbar vertebrae. The total fat weight and visceral fat/subcutaneous (V/S) ratio were calculated from visceral and subcutaneous fat weights.
2.5. Tissue Sampling and Histopathology
Necropsy was performed at 24 weeks of age. Overnight-fasted animals were sacrificed by exsanguination under light ether anesthesia. The pancreas and liver were taken for histopathological examination. Tissues were taken from all animals and fixed in 10% neutral buffered formalin. Sections were stained with hematoxylin and eosin (HE) for evaluation by light microscopy. Immunohistochemistry for insulin was performed with an antiinsulin monoclonal antibody (clone Z007, Nichirei Bioscience, Tokyo, Japan). All sections were examined histopathologically in a blind manner, and the findings were graded from normal (−) to severe (3+) abnormalities.
2.6. Glucagon-Like Peptide-1 Levels
In a refeeding condition, the plasma glucagon-like peptide-1 (GLP-1) response was observed using the satellite group at 10 weeks of age. After 4 h of fasting, the rats were refed with a standard diet or high-fat. Blood samples were taken via the tail vein before and 4 and 8 h after feeding. GLP-1 levels were measured using the GLP-1 assay kit (Millipore, Mass, USA). Blood was collected into tubes containing a Dipeptidyl peptidase IV inhibitor, aprotinin, and ethylenediaminetetraacetic acid and stored on ice. The blood samples were separated by centrifuging at 10,000 × g for five minutes at 4˚C to obtain plasma. Subsequently, 450 µL of plasma was added into 1050 µL of ethanol, and the solution was mixed thoroughly and centrifuged at 10,000 × g for five minutes at 4˚C to obtain the supernatant. The supernatant was evaporated to dryness using a centrifuge evaporator. The residue was dissolved in 100 µL saline. The GLP-1 concentration in the solution was measured by enzyme immunoassay using a GLP-1 assay kit.
2.7. Statistical Analyses
The biological parameters, except for histological analysis, are expressed as the mean ± standard deviation (SD). Statistical analysis was performed for body weight, calorie intake, serum biochemical parameters (glucose, insulin, TG, TC, and leptin), GLP-1, visceral fat weight, subcutaneous fat weight, total fat, and V/S ratio between SDT fatty rats on a standard diet (CRF-1) and SDT fatty rats on a high-fat diet (HF) (n = 5 - 6). The F-test was used to test for variances between CRF-1 group and the HF group. If homoscedasticity was confirmed, Student’s t-test was used and if not, Aspin-Welch’s test was used. Differences were considered significant at p < 0.05.
3. RESULTS
3.1. Calorie Intake and Body Weight
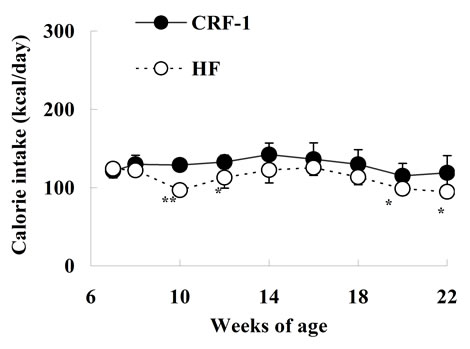
The caloric intake was comparable at 7 and 8 weeks of age between SDT fatty rats on a standard diet (CRF-1) and a high-fat diet (HF); however, the caloric intake of HF rats was decreased or tended to decrease from 10 to 22 weeks of age (Figure 1(a)). The body weight in HF rats was not different from that in CRF-1 rats until 10 weeks of age, but the body weight was significantly higher in the HF rats from 12 to 22 weeks of age (CRF-1, 609.1 ± 28.9 g, and HF, 793.4 ± 56.2 g at 22 weeks, respectively) (Figure 1(b)).
3.2. Biochemical Parameters
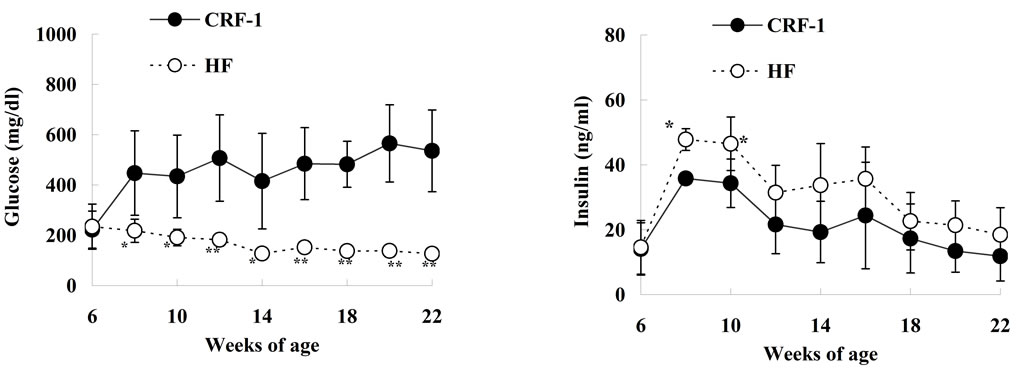
Serum glucose levels in CRF-1 rats began to increase after 8 weeks of age (447.5 ± 168.1 mg/dL, at 8 weeks) and the hyperglycemia was sustained until 22 weeks of age (535.7 ± 162.8 mg/dL, at 22 weeks). However, the elevation of glucose levels in the HF rats was perfectly inhibited throughout the experimental period (Figure 2(a)). CRF-1 rats showed hyperinsulinemia throughout the experimental period (11.8 - 35.8 ng/ml), and the serum insulin levels were higher in the HF rats than in CRF-1 rats, with significant differences at 8 and 10 weeks of age (Figure 2(b)). The serum TG levels in the
 (a)
(a)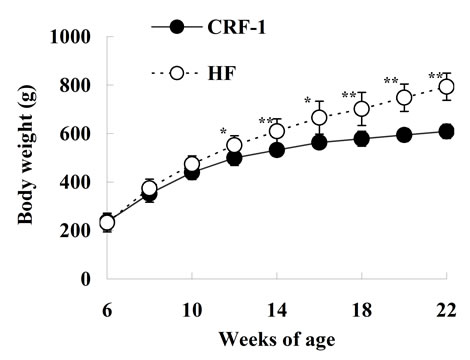 (b)
(b)
Figure 1. Changes in caloric intake (a) and body weight (b) in Female Spontaneously Diabetic Torii Leprfa rats on a standard diet (CRF-1) and a high-fat diet (HF). The data are shown as the mean ± SD (n = 6). An analysis of variance followed by a test of significance was used to evaluate statistical significance. *p < 0.05, **p < 0.01; significantly different from CRF-1 rats at indicated time points.
HF rats increased or tended to increase from 10 to 18 weeks of age as compared with those in CRF-1 rats (Figure 2(c)). Moreover, the serum TC levels in the HF rats increased from 8 to 12 weeks of age (Figure 2(d)). The serum leptin levels in the HF rats increased after 10 weeks of age as compared with those in CRF-1 rats, and the elevation was remarkable at 22 weeks of age (CRF-1, 116.0 ± 62.4 ng/ml, and HF, 331.8 ± 59.2 ng/ml, respectively) (Figure 2(e)).
3.3. Glucose Tolerance Test
Glucose tolerance and insulin secretion were examined after oral glucose loading (2 g/kg body weight) at 23 weeks of age (Table 2). Fasted glucose levels before glucose loading in HF rats were significantly lower than in CRF-1 rats. Furthermore, the glucose levels at 30, 60, and 120 minutes after glucose loading were significantly lower in the HF rats compared to CRF-1 rats, and, accordingly, the AUC for glucose was also decreased in the HF rats. The insulin levels at 120 minute after glucose loading were higher in the HF rats compared to CRF-1
 (a)
(a)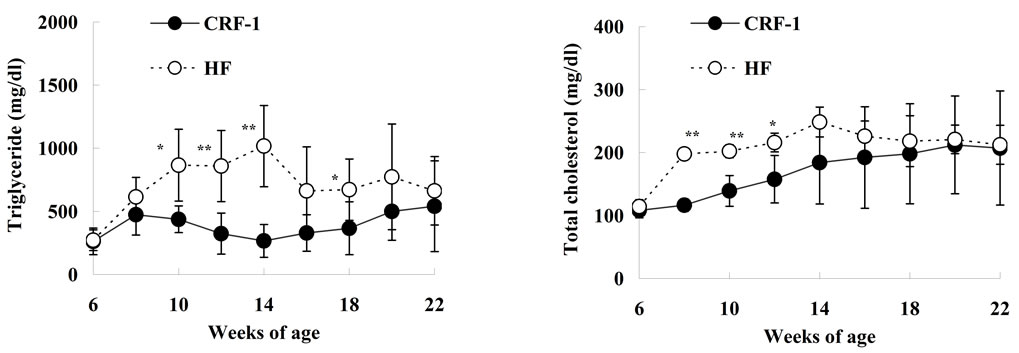 (b)
(b)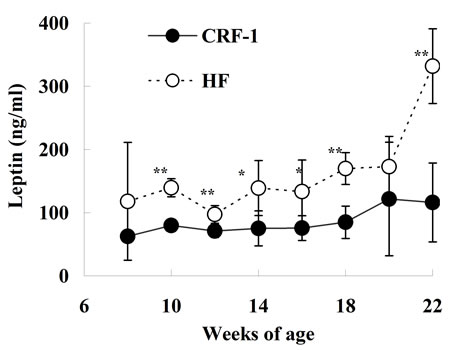 (c)
(c)
Figure 2. Changes in Glucose (a); Insulin (b); Triglyceride (c); Total cholesterol (d); and Leptin (e) in Female Spontaneously Diabetic Torii Leprfa rats on a standard diet (CRF-1) and a high-fat diet (HF). The data are shown as the mean ± SD (n = 6). An analysis of variance followed by a test of significance was used to evaluate statistical significance. *p < 0.05, **p < 0.01; significantly different from CRF-1 rats at indicated time points.

Table 2. Glucose and insulin levels after glucose loading in CRF-1 and HF rats.
rats. The HF rats showed a significant improvement of glucose tolerance.
3.4. Fat Tissue Weight
Both visceral fat and subcutaneous fat weights were higher in the HF rats compared to CRF-1 rats at 24 weeks of age, and the HF rats showed a 60% increase in total fat weight compared to CRF-1 rats (Table 3). The V/S ratio was lower in the HF rats compared to CRF-1 rats.
3.5. Histopathological Analysis
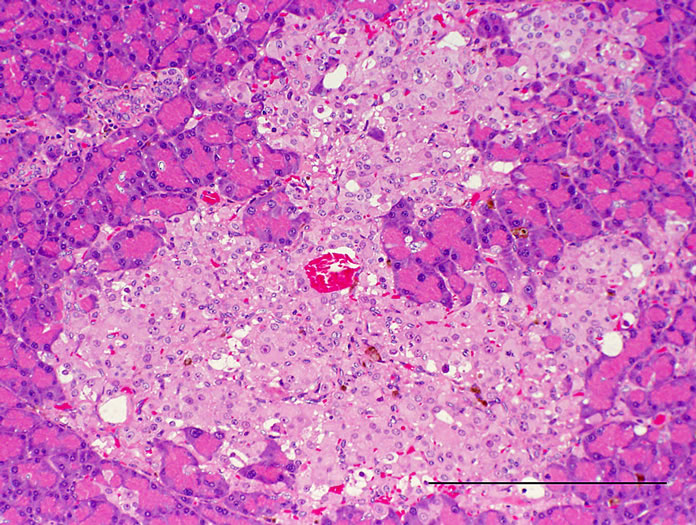
Histopathologically pancreatic abnormalities, such as vacuolation, hemorrhage, and decrease in the immunoreactivity of insulin in the islets were observed in CRF-1 rats. However, the HF rats showed an improvement of the vacuolation in the islets and a tendency to an improvement of the hemorrhage (Figure 3). Decrease in the immunoreactivity of insulin in the islets in the HF rats showed a reduction compared to that in CRF-1 rats (Figure 4). Histopathological findings of hemosiderin deposition or fibrosis of the islets and mononuclear cell infiltration in the pancreas were comparable in CRF-1 rats and the HF rats. Moreover, adipose tissue infiltration in the pancreas was slight in the HF rats (Table 4). In the liver, severe or moderate fatty changes were observed in CRF-1 rats, but this change was improved in the HF rats (Figure 5, Table 4).
3.6. GLP-1 Levels
The plasma GLP-1 levels after refeeding were significantly increased in the HF rats at 10 weeks of age. The GLP-1 levels were about 60% higher in the HF rats compared to CRF-1 rats at 4 h after refeeding (CRF-1, 3.61 ± 1.14 pM, and HF, 5.73 ± 0.66 pM, respectively) (Figure 6).
4. DISCUSSION
In a previous study, we investigated the effect of a high-fat diet in SDT rats, a nonobese type 2 diabetic model [15]. SDT rats showed a pre-diabetic stage (impaired glucose tolerance; IGT) for about 3 months and developed diabetes after about 16 weeks of age [14]. We hypothesized that a high-fat diet would accelerate the induction of diabetes in SDT rats compared with a standard diet. Unexpectedly, as a result, we observed a suppression of the incidence of diabetes with a high-fat diet. In this study, we investigated the effect of a high-fat diet using a novel obese type 2 diabetic model, SDT fatty rats. We intended to confirm the reproducibility, the inhibition

Table 3. Changes in fat tissue weights in CRF-1 and HF rats.
 (a)
(a)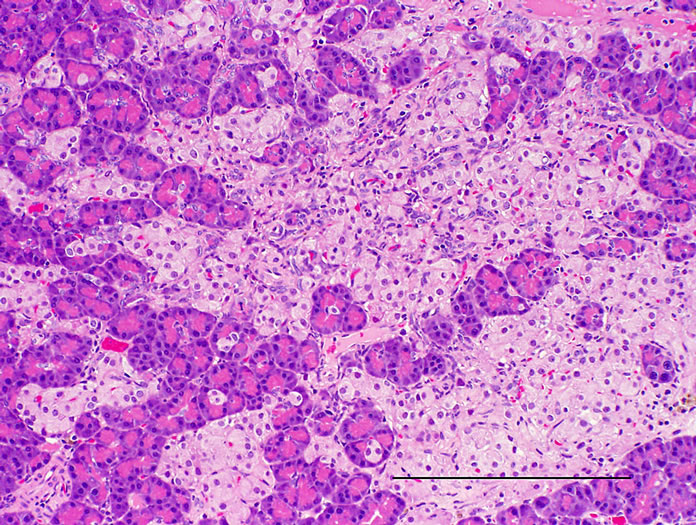 (b)
(b)
Figure 3. Pancreas. HE stain. (a) CRF-1 rats at 24 weeks of age; (b) HF rats at 24 weeks of age. Bar = 200 µm. HF rats showed an improvement of the vacuolation of islets.
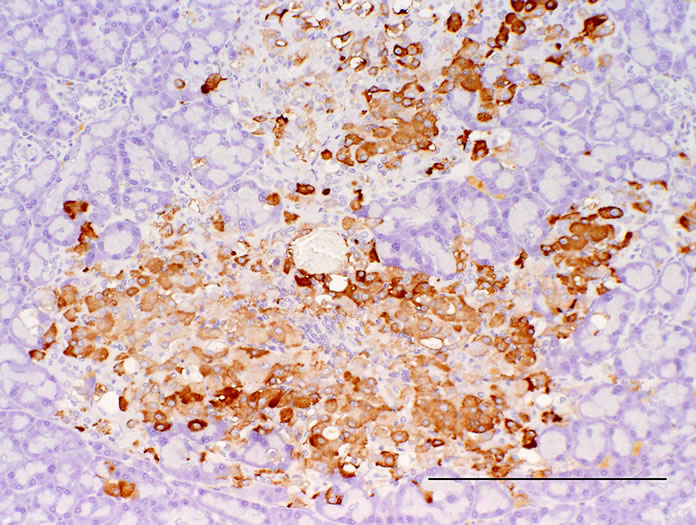 (a)
(a)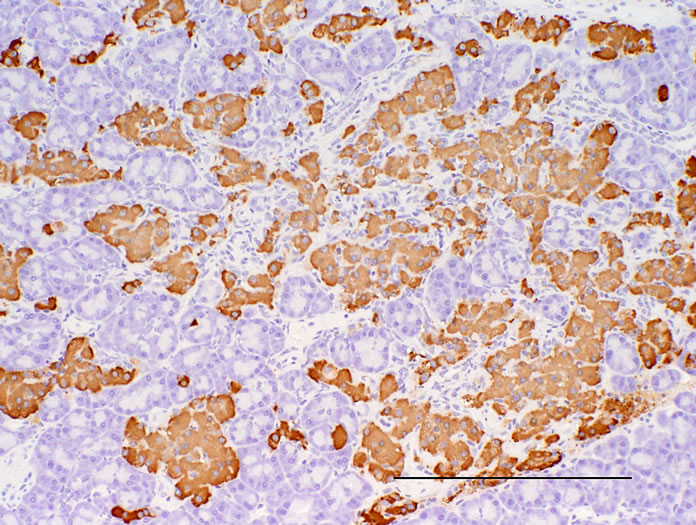 (b)
(b)
Figure 4. Pancreas. Immunostained with anti-insulin. (a) CRF-1 rats at 24 weeks of age; (b) HF rats at 24 weeks of age. Bar = 200 µm. HF rats showed a reduction of decrease in the immunoreactivity of insulin in islets.
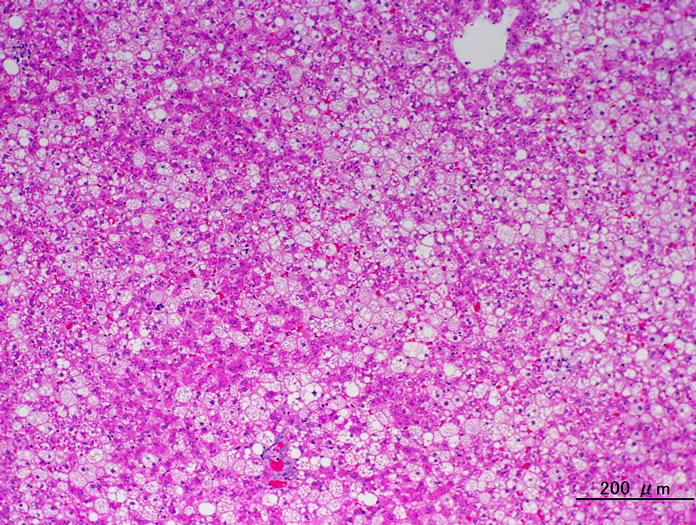 (a)
(a)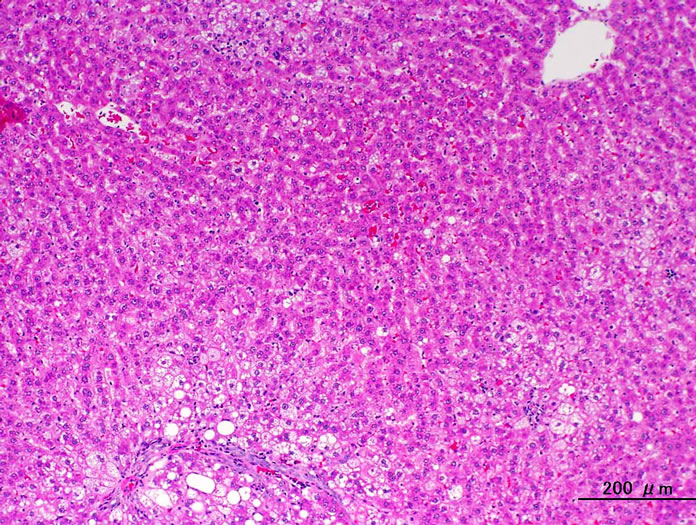 (b)
(b)
Figure 5. Liver. HE stain. (a) CRF-1 rats at 24 weeks of age; (b) HF rats at 24 weeks of age. HF rats showed an improvement in the fatty change.
effect of a high-fat diet for diabetes, using another diabetic model. Female SDT fatty rats show obesity, hyperglycemia, and hyperinsulinemia from a young age, giving rise to the expectation that the rats have the potential to become an important animal model for obese type 2 diabetes, especially for women [12].
High-fat diets have been used to induce experimental obesity, and dietary fat content is positively correlated with body weight gain [16]. Moreover, many rodent species develop obesity associated with various metabolic abnormalities, such as metabolic syndrome, which includes glucose intolerance, insulin resistance, and dyslipidemia [17,18]. Also, in this study, a high-fat diet induced obesity, hyperinsulinemia, and hyperlipidemia (Figures 1(b) and 2, and Table 3). Although a high-fat diet induced metabolic abnormalities such as weight gain, fat accumulation and dyslipidemia, the incidence of diabetes mellitus was suppressed in female SDT fatty rats fed a high-fat diet (Figure 2(a)). In the histopathological analyses, pancreatic abnormalities such as vacuolation, hemorrhage and decrease in the immunoreactivity of insulin in the islets, and fatty change in the liver, were improved in the HF rats (Table 4).
One of the reasons why a high-fat diet induced the suppression in the incidence of diabetes is considered to be elevation of the plasma GLP-1 levels in the HF rats (Figure 6). GLP-1 is the major physiological incretin or intestinal hormone released in response to nutrient ingestion that stimulates glucose-dependent insulin secretion [19]. GLP-1 is released from the L cells in the distal ileum and colon and also serves an important role as an incretin; GLP-1 not only stimulates insulin secretion, but
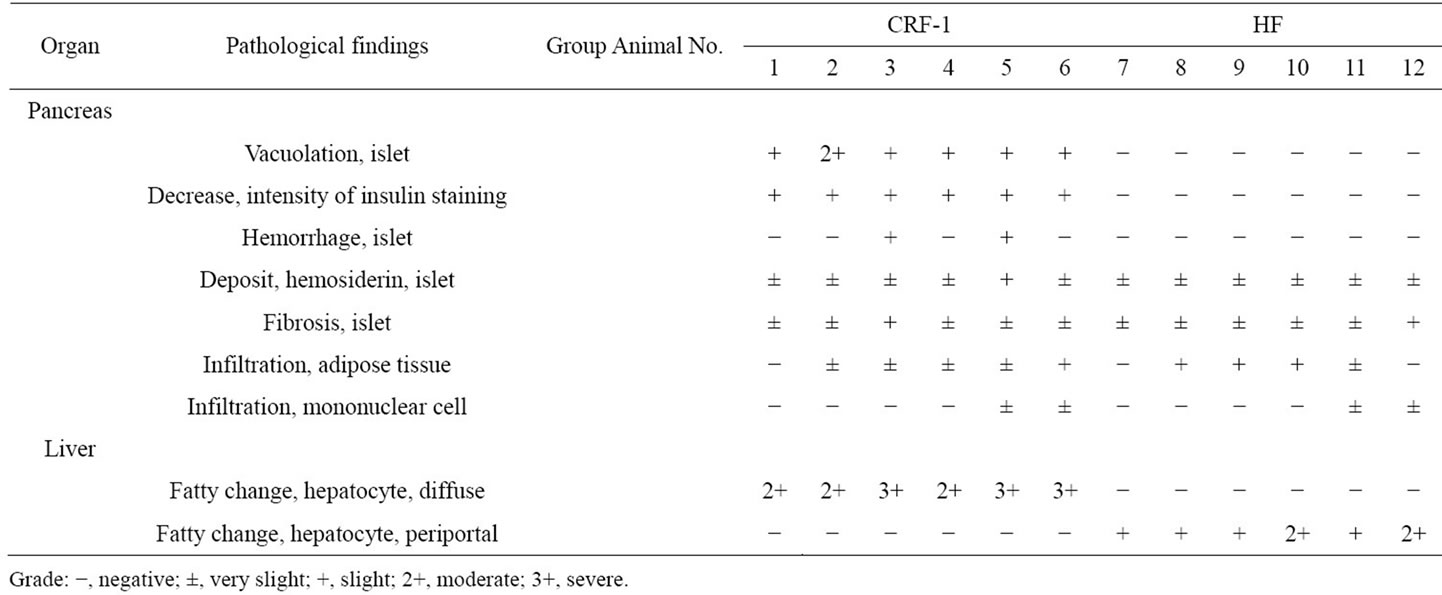
Table 4. Histopathological analysis of the pancreas and liver in CRF-1 and HF rats.
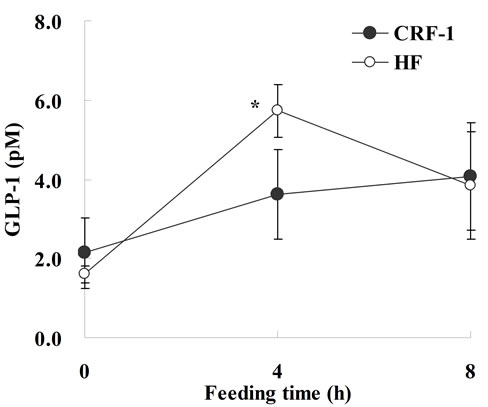
Figure 6. Glucagon-like peptide-1 levels in Female Spontaneously Diabetic Torii Leprfa rats on a standard diet (CRF-1) and a high-fat diet (HF) at 10 weeks of age. After 4 hours of fasting, the rats were refed with a standard diet or high fat. Blood samples were taken via the tail vein before, and 4 and 8 hours after feeding. The data represent the mean ± SD (n = 4). An analysis of variance followed by a test of significance was used to evaluate statistical significance. *p < 0.05; significantly different from CRF-1 rats.
also inhibits gastric emptying, food intake and glucagon secretion [20]. Moreover, acute or chronic administration of either GLP-1 or of its degradation-resistant analogs increases β-cell mass in both normal and diabetic mice [21-23]. GLP-1R agonists such as exendin-4 also prevent or delay the development of diabetes in db/db mice and Goto-Kakizaki rats [24,25]. In this study and a previous study, a high-fat diet induced an increase of GLP-1 release with refeeding. Moreover, in this study, SDT fatty rats fed a high-fat diet showed a suppression of calorie intake (Figure 1(a)). Since the pancreatic abnormalities were improved in the HF rats (Table 4), it is considered that the increase in GLP-1 levels induced a positive effect on the pancreas in the rats.
The elevation of serum leptin levels might induce a beneficial effect on glucolipid metabolism in the HF rats (Figure 2(e)). Leptins are important peptide hormones secreted by adipocytes that are induced in the regulation of metabolism and energy homeostasis. Although the hypothalamus has been identified as an important target organ for leptins in the regulation of food intake and energy expenditure, leptins are also known to exert direct actions in peripheral tissues [26,27]. It is reported that leptins inhibit ectopic fat accumulation and thereby prevent β cell dysfunction and protect the β cell from lipotoxicity [27].
Furthermore, it should be noted that the fiber (cellulose) content is higher in a high-fat diet than in CRF-1 (Table 1). There are many studies showing that the development of certain diseases is influenced by dietary components. Dietary fiber is one nutrient that may provide protection against type 2 diabetes, metabolic syndrome and cardiovascular disease [28,29]. The beneficial effect of soluble fiber may be mediated through the slow absorption and digestion of carbohydrates that lead to a reduced demand for insulin [30]. Moreover, it is reported that the fatty acid component rather than the lipid accumulation is important for the incidence of insulin resistance [31].
The various factors with high-fat diet feeding, such as an increase of blood GLP-1 or leptin levels and fiber-rich components in the diet, might be related to the suppression of the incidence of diabetes mellitus. Especially, GLP-1 is considered to play a pivotal role on anti-diabetic effects in this experiment. Nutrition components in diets are important factors for the development of diabetes.
5. CONCLUSION
We investigated the effects of a high-fat diet on glycollipid metabolism in female SDT fatty rats. As a result, a high-fat diet induced obesity and dyslipidemia, but the incidence of diabetes mellitus in the HF rats was suppressed. The preventive effect on diabetes mellitus in rats fed a high-fat diet has a relation with increases of incretin hormones. It might be advantageous for reduction in the incidence or progression of diabetes to develop functional foods and induce an increase of the incretin hormones.
![]()
![]()
REFERENCES
- Nathan, D.M., Buse, J.B., Davidson, M.B., Heine, R.J., Holman, R.R., Sherwin, R. and Zinman, B. (2006) Management of hyperglycaemia in type 2 diabetes: A consensus algorithm for the initiation and adjustment of therapy. A consensus statement from the American Diabetes Association and the European Association for the Study of Diabetes. Diabetologia, 49, 1711-1721. doi:10.1007/s00125-006-0316-2
- Fujimori, Y., Katsuno, K., Ojima, K., Nakashima, I., Nakano, S., Ishikawa-Takemura, Y., Kusama, H. and Isaji, M. (2009) Sergliflozin etabonate, a selective SGLT2 inhibitor, improves glycemic control in streptozotocin-induced diabetic rats and Zucker fatty rats. European Journal of Pharmacology, 609, 148-154. doi:10.1016/j.ejphar.2009.03.007
- DeFronzo, R.A. and Abdul-Ghani, M. (2011) Type 2 diabetes can be prevented with early pharmacological intervention. Diabetes Care, 34, S202-S209. doi:10.2337/dc11-s221
- Everitt, A.V., Hilmer, S.N., Brand-Miller, J.C., Jamieson, H.A., Truswell, A.S., Sharma, A.P., Mason, R.S., Morris, B.J. and Le Couteur, D.G. (2006) Dietary approaches that delay age-related diseases. Clinical Interventions in Aging, 1, 11-31. doi:10.2147/ciia.2006.1.1.11
- Ludwig, D.S. (2002) The glycemic index: Physiological mechanisms relating to obesity, diabetes, and cardiovascular disease. The Journal of the American Medical Association, 287, 2414-2423. doi:10.1001/jama.287.18.2414
- Weisburger, J.H. (2002) Lifestyle, health and disease prevention: The underlying mechanisms. European Journal of Cancer Prevention, 11, S1-S7.
- Weir, M.R. (2004) Dietary salt, blood pressure, and microalbuminuria. The Journal of Clinical Hypertens, 6, 23-26. doi:10.1111/j.1524-6175.2004.04066.x
- Masuyama, T., Katsuda, Y. and Shinohara, M. (2005) A novel model of obesity-related diabetes: Introgression of the Leprfa allele of the Zucker fatty rat into nonobese Spontaneously Diabetic Torii (SDT) rats. Experimental Animals, 54, 13-20. doi:10.1538/expanim.54.13
- Matsui, K., Ohta, T., Morinaga, H., Sasase, T., Fukuda, S., Ito, M., Ueda, M., Ogawa, N., Miyajima, K. and Matsushita, M. (2008) Effects of preventing hyperphagia on glycolipid metabolic abnormalities in Spontaneously Diabetic Torii fatty rats. Animal Science Journal, 79, 605-613. doi:10.1111/j.1740-0929.2008.00570.x
- Matsui, K., Ohta, T., Oda, T., Sasase, T., Ueda, N., Miyajima, K., Masuyama, T., Shinohara, M. and Matsushita, M. (2008) Diabetes-associated complications in Spontaneously Diabetic Torii fatty rats. Experimental Animals, 57, 111-121. doi:10.1538/expanim.57.111
- Morinaga, H., Ohta, T., Matsui, K., Sasase, T., Fukuda, S., Ito, M., Ueda, M., Ishii, Y., Miyajima, K. and Matsushita, M. (2009) Effect of food restriction on adipose tissue in Spontaneously Diabetic Torii fatty rats. Experimental Diabetes Research, 2009, 39-47. http://www.hindawi.com/journals/edr/2009/715057 doi:10.1155/2009/715057
- Ishii, Y., Ohta, T., Sasase, T., Morinaga, H., Ueda, N., Hata, T., Kakutani, M., Miyajima, K., Katsuda, Y., Masuyama, T., Shinohara, M. and Matsushita, M. (2010) Pathophysiological analysis of female Spontaneously Diabetic Torii fatty rats. Experimental Animals, 59, 73-84. doi:10.1538/expanim.59.73
- Fukuda, S., Miyajima, K., Sasase, T. and Ohta, T. (2011) Spontaneously Diabetic Torii leprfa (SDT fatty) rat: A novel model of obese type 2 diabetes. The Open Diabetes Journal, 4, 30-36. http://www.benthamscience.com/open/todiaj/articles/V004/SI0001TODIAJ/30TODIAJ.htm
- Ohta, T., Miyajima, K. and Yamada, T. (2011) Pathophysiological changes in pre-diabetic stage of Spontaneously Diabetic Torii (SDT) rats. Journal of Animal and Veterinary Advances, 10, 813-817. doi:10.3923/javaa.2011.813.817
- Ishii, Y., Ohta, T., Sasase, T., Morinaga, H., Hata, T., Miyajima, K., Katusda, Y., Masuyama, T., Shinohara, M., Kakutani, M. and Matsushita, M. (2010) A high-fat diet inhibits the progression of diabetes mellitus in type 2 diabetic rats. Nutrition Research, 30, 483-491. doi:10.1016/j.nutres.2010.06.013
- Ghibaudi, L., Cook, J., Farley, C., van Heek, M. and Hwa, J.J. (2002) Fat intake affects adiposity, comorbidity factors, and energy metabolism of Sprague-Dawley rats. Obesity Research, 10, 956-963. doi:10.1038/oby.2002.130
- Ikemoto, S., Takahashi, M., Tsunoda, N., Maruyama, K., Itakura, H. and Ezaki, O. (1996) High-fat diet-induced hyperglycemia and obesity in mice: Differential effects of dietary oils. Metabolism, 45, 1539-1546. doi:10.1016/S0026-0495(96)90185-7
- Wang, H., Storlien, L.H. and Huang, X.F. (2002) Effects of dietary fat types on body fatness, leptin, and ARC leptin receptor, NPY, and AgRP mRNA expression. The American Journal of Physiology: Endocrinology and Metabolism, 282, E1352-E1359.
- Creutzfeldt, W. (1979) The incretin concept today. Diabetologia, 16, 75-85. doi:10.1007/BF01225454
- Drucker, D.J. (2003) Enhancing incretin action for the treatment of type 2 diabetes. Diabetes Care, 26, 2929- 2940. doi:10.2337/diacare.26.10.2929
- Stoffers, D.A., Kieffer, T.J., Hussain, M.A., Drucker, D.J., Bonner-Weir, S., Habener, J.F. and Egan, J.M. (2000) Insulinotropic glucagon-like peptide 1 agonists stimulate expression of homeodomain protein IDX-1 and increase islet size in mouse pancreas. Diabetes, 49, 741-748. doi:10.2337/diabetes.49.5.741
- Rolin, B., Larsen, M.O., Gotfredsen, C.F., Deacon, C.F., Carr, R.D., Wilken, M. and Knudsen, L.B. (2002) The longacting GLP-1 derivative NN2211 ameliorates glycemia and increases beta-cell mass in diabetic mice. The American Journal of Physiology: Endocrinology Metabolism, 283, E745-E752.
- Kim, J.G., Baggio, L.L., Bridon, D.P., Castaigne, J.P., Robitaille, M.F., Jette, L., Benquet, C. and Drucker, D.J. (2003) Development and characterization of a glucagonlike peptide 1-albumin conjugate: The ability to activate the glucagon-like peptide 1 receptor in vivo. Diabetes, 52, 751-759. doi:10.2337/diabetes.52.3.751
- Xu, G., Stoffers, D.A., Habener, J.F. and Bonner-Weir, S. (1999) Exendin-4 stimulates both beta-cell replication and neogenesis, resulting in increased beta-cell mass and improved glucose tolerance in diabetic rats. Diabetes, 48, 2270-2276. doi:10.2337/diabetes.48.12.2270
- Wang, Q. and Brubaker, P.L. (2002) Glucagon-like peptide-1 treatment delays the onset of diabetes in 8 weekold db/db mice. Diabetologia, 45, 1263-1273. doi:10.1007/s00125-002-0828-3
- Bluher, S. and Mantzoros, C.S. (2009) Leptin in humans: Lessons from translational research. The American Journal of Clinical Nutrition, 89, 991S-997S. doi:10.3945/ajcn.2008.26788E
- Lee, Y.H., Magkos, F., Mantzoros, C.S. and Kang, E.S. (2011) Effects of leptin and adiponectin on pancreatic beta-cell function. Metabolism, 60, 1664-1672. doi:10.1016/j.metabol.2011.04.008
- Trepel, F. (2004) Dietary fibre: More than a matter of dietetics. II. Preventative and therapeutic uses. Wiener Klinishens Wochenschrift, 116, 511-522. doi:10.1007/BF03217703
- Kaline, K., Bornstein, S.R., Bergmann, A., Hauner, H. and Schwarz, P.E. (2007) The importance and effect of dietary fiber in diabetes prevention with particular consideration of whole grain products. Hormone and Metabolic Research, 39, 687-693. doi:10.1055/s-2007-985811
- Montonen, J., Knekt, P., Jarvinen, R., Aromaa, A. and Reunanen, A. (2003) Whole-grain and fiber intake and the incidence of type 2 diabetes. The American Journal of Clinical Nutrition, 77, 622-629.
- Lee, J.Y., Cho, H.K. and Kwon, Y.H. (2010) Palmitate induces insulin resistance without significant intracellular triglyceride accumulation in HepG2 cells. Metabolism, 59, 927-934. doi:10.1016/j.metabol.2009.10.012