Journal of Behavioral and Brain Science
Vol.3 No.8(2013), Article ID:40425,3 pages DOI:10.4236/jbbs.2013.38061
An Electromyography-Based System for Measuring the Flavor Detection Time in Healthy Adults
1Department of Eating Disorder and Dysphagia, Graduate School of Rehabilitation, Niigata University of Rehabilitation, Murakami, Japan
2Department of Health and Nutrition, Niigata University of Health and Welfare, Niigata, Japan
Email: miyaoka@nuhw.ac.jp
Copyright © 2013 Satomi Miyaoka, Yozo Miyaoka. This is an open access article distributed under the Creative Commons Attribution License, which permits unrestricted use, distribution, and reproduction in any medium, provided the original work is properly cited.
Received October 25, 2013; revised November 24, 2013; accepted December 1, 2013
Keywords: Flavor; Detection Time; Solid and Semi-Solid Food; Masseter; Electromyogram; Chewing; Human
ABSTRACT
This study aimed to develop a system to measure the flavor detection time for chewed solid and semi-solid foods. Twelve healthy young adults (seven males and five females) were asked to chew gummy candies with three different fruit flavors (grape, lemon, and pineapple) in a random order while their masseter activities were recorded by surface electromyograms on their habitual working and non-working sides. The participants were also asked to press a button as soon as possible with their preferred hand once they detected the flavor. The time interval between the start of chewing and the button press was measured; the start of chewing was defined as the start of a burst in the masseter electromyogram on the habitual working side. The average interval ranged from 2.82 s (lemon in males) to 4.63 s (grape in males); no significant differences were found between the three tested gummy candies or between the sexes of the participants. The present system can perform the measurements of the following two conventional measurement systems: 1) simple reaction time task for the taste and olfactory stimuli of fluids and vapors, respectively, and 2) time-intensity analysis of the flavor from solid and semi-solid foods, which does not generally consider the flavor detection time.
1. Introduction
The initial stage of food ingestion is likely to be critical for flavor detection (taste, odor, and their combination) due to the following two factors: 1) adaptation of the sensory receptors involved and 2) habituation of the detection mechanisms in the central nervous mechanisms [1, 2]. Previous studies used fluids and vapors to measure simple taste and olfactory reaction times, respectively, and these studies very precisely examined the detection time for tastes and odors (or flavor) [1]: e.g., in healthy adults, the simple reaction time in response to the taste stimuli from fluids ranges from 400 to 800 ms [3] and that for odor stimuli from vapors ranges from 1.36 to 1.74 s [1]. However, these measuring systems are not applicable to solid and semi-solid foods. Another study used time-intensity (T-I) analysis not only for fluids and vapors but also for solid and semi-solid foods to understand the entire temporal process of changes in the perceived intensities of taste, odor, and/or flavor of foods from the start to the end of ingestion (e.g., [4]). In contrast to the studies on simple reaction time, the T-I analysis does not generally consider the detection time for food flavors. The present study aimed to develop a measuring system that connects the measurements of the two conventional systems to detect flavor in solid and semi-solid foods. The present measuring system uses an electromyogram (EMG) of the masticatory muscles as an indicator of the start of chewing.
2. Materials and Methods
2.1. Participants
Twelve healthy young adults (seven males and five females, 21.7 ± 1.27 years old) participated in this study after providing informed consent. The Ethics Committee of The University of Niigata Rehabilitation Graduate School approved the experiments.
2.2. Test Foods
Three gummy candies (GC; Meiji Co., Ltd, Tokyo, Japan) with different fruit flavors (apple, grape, and pineapple) served as the test foods in the present study. The shape and size, including the dimensions, of the candies were basically similar: their approximate height, width, and thickness were 9.5 mm × 23.6 mm × 15.0 mm, respectively. Each test food was wrapped with a wafer paper (Kokko oblaat Co., Ltd, Shizuoka, Japan) to prevent direct contact between the food and the oral tissues before the start of chewing.
2.3. Procedures
All 12 participants except one were right-handed. Two of the participants used the left side as their habitual working side during chewing. Each participant was asked to rinse his/her mouth with water and to sit comfortably on a chair.
Surface electromyograms (EMGs) were recorded from the masseter (Mass) muscles on both sides with two pairs of adhesive electrodes (Ambu Inc., Blue Sensor, Maryland, USA), which were attached to the skin just above the Mass. The Mass EMG signals were amplified, filtered (bandwidth, 15 Hz-3 kHz), fully rectified, and stored on a digital recorder (Kyowa Electronic Instruments Co. Ltd., Tokyo, Japan, EDS-450A). Two pressing buttons, one in each hand, were held by each participant, and the buttons were connected to the recorder through a battery. After the test food was delivered, the participant activated one button for flavor detection and the other for flavor recognition; only the signal for flavor detection was analyzed in the present study.
One of the three GCs was delivered as a test food to each participant in a random order. Prior to the delivery, no information about the test foods, including their taste, odor, and flavor, was provided to the participants. Each participant was asked to ingest the wrapped test foods and to hold it between the molars on his/her habitual chewing side until the delivery of a command for the start of chewing. The participant was also asked press the button with the hand instructed by the experimenter as soon as possible when he/she detected any flavor of the delivered test food. Each experimental session consisted of three trials with at least 4 min between the trials.
2.4. Data and Statistical Analyses
As depicted in Figure 1, an interval was measured from the start of burst in the Mass EMG (i.e., the start of chewing) on the habitual working side to the rise of the detection signal. This interval should correspond to the time for to detect the flavor of the delivered test food.

Figure 1. Sample data for explanation of the reaction time measurement. The two upper traces depict the sequences of masseter activities during the chewing of a pineapple-flavored gummy candy in a male participant, while the two lower traces depict the electrical signals, indicating the time at detection. Rt Mass and Lt Mass: surface electromyograms recorded from the masseter muscles on the right (Rt) and left (Lt) sides of the participant, respectively. The vertical and horizontal lines on the right side show 1.0 mV and 0.5 s, respectively. See the text for details.
Two-way analysis of variance (ANOVA) followed by the Tukey-Kramer test were used for statistical examination, and P < 0.05 was considered significant.
3. Results
Figure 1 depicts a sample record from the start of chewing to the signal for flavor detection with the pineappleflavored GC. The Mass EMGs of both sides burst almost simultaneously after the command signal was given to start chewing. The interval between the start of the burst and the detection signal was considered the “reaction time to flavor (RTF)”. Figure 2 shows the average RTF for the three tested GCs and for both sexes. The average RTF for the lemon-flavored GC was the shortest for both sexes, while the RTFs for the grape-flavored and pineapple-flavored GCs were the longest in male and female participants, respectively. However, two-way ANOVA found no significant differences in the average RTF between the three GCs or between the sexes.
4. Discussion
The present study used the start of the burst in the Mass EMG as the initial indicator for the measurement of the flavor reaction time and used the signal of a button press as the ending indicator (Figure 1). A previous study on taste reaction time used a drinkometer to determine the time when a taste solution contacted the surface of the tongue [3], and another study on olfactory reaction time used a flow meter to determine the time when an odorant was injected to the nostril [2]. Compared with the systems in those studies [2,3], the present RTF measuring system most likely requires a longer time from the start of chewing to the stimulation
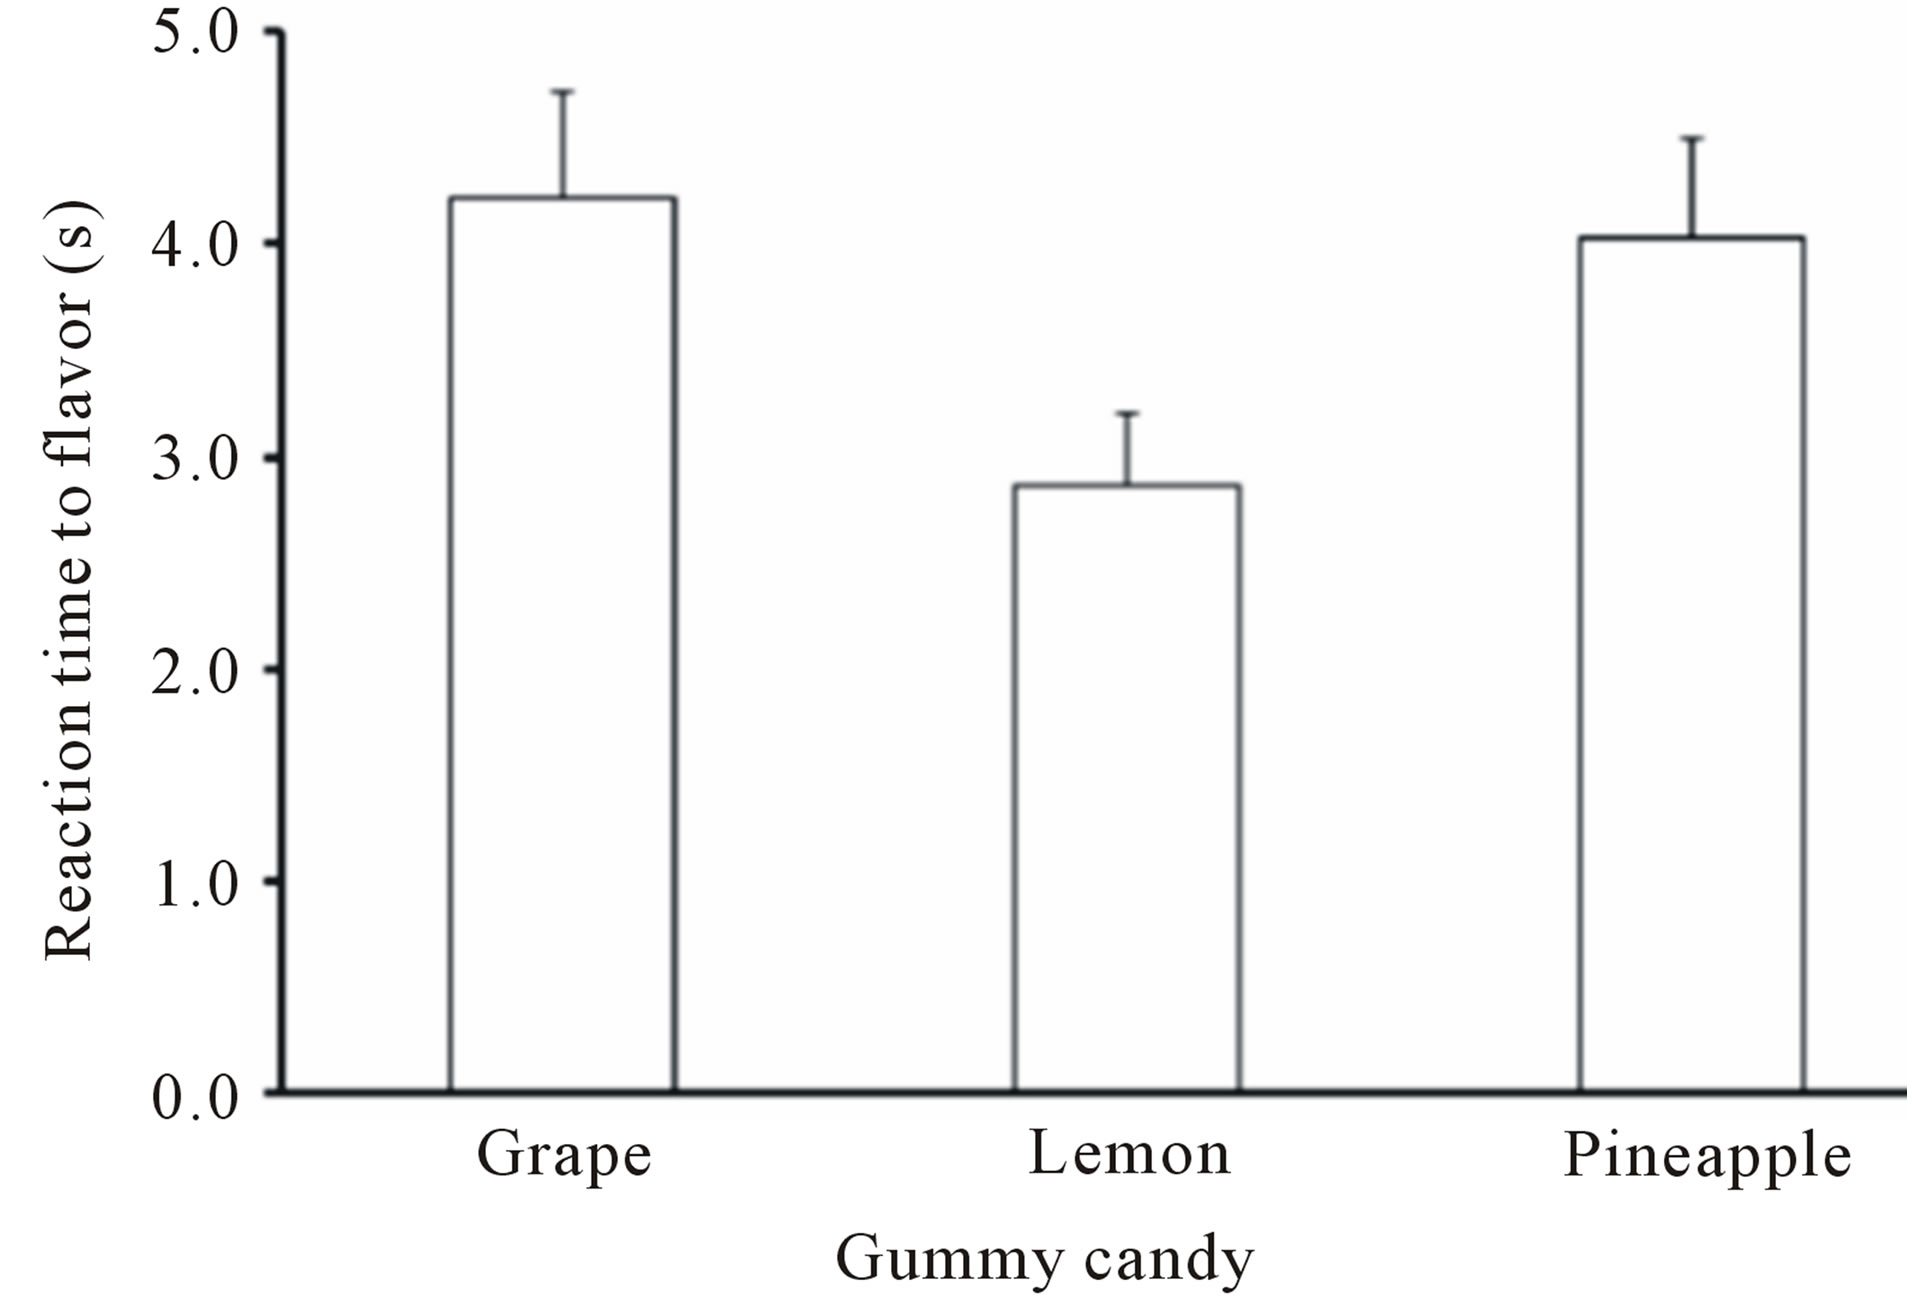
Figure 2. Averages of reaction time to flavor in three gummy candies used; “Grape”, ”Lemon”, and “Pineapple” indicate grape-, lemon-, and pineappleflavored gummy candies, respectively. The values present the means ± S.E.M. No significant differences were found between the three gummy candies and the sexes of participants.
of the taste and olfactory cells by the test food flavor because this study uses a semi-solid food, GC. The measuring system uses the following two steps for the stimulation: first, the wafer paper-wrapped GC is broken up with the molars by chewing, and then the broken particles containing flavor components are spattered from the wafer to the mouth and nose. The initial steps can be termed a “mechanical” stage for detecting the GC flavor. The time for the “mechanical” stage is likely much longer than that in the previous studies, in which the tongue and nose were directly stimulated with solutions and vapors [2,3]. It seems reasonable to assume that the tested materials cause the distinct differences between the present and previous studies, i.e., this study used a semi-solid food, GC, to stimulate the tongue and nostril, while the previous studies used liquids (taste solutions) and vapors (odorants). The average RTF ranged from 2.82 (for the lemon-flavored GC in males) to 4.63 s (for the grape-flavored GC in males) in the present study (Figure 2); in contrast, in healthy adults, the simple reaction time in response to a taste stimuli ranges from 400 (for the highest concentration of sodium chloride) to 800 ms (for the highest concentration of quinine hydrochloride; [3]) and the reaction time in response to odor stimuli ranges from 1.36 (for valeric acid; an unpleasant odor) to 1.74 s (for amyl acetate; a pleasant odor; [1]). The large temporal differences between these systems [1-3] do not reduce the usefulness of the present measuring system using EMGs, which allows us to collect RTF data for semisolid foods.
Analyzing the time-intensity (T-I) relationships of food ingestion provides important information about the temporal aspects of sensory evaluation. For example, the T-I curves recorded during the ingestion of chocolate desserts presented not only the maximum sensory intensity and the time required to reach the maximum but also the total duration of the sensation and the total area under the curves [4]. The previous study showed that the maximum chocolate sweetness and flavor were perceived 11.1 and 12.9 s, respectively, after the placement of a 5 g sample in the mouth. Most T-I analyses, including that in this study, do not consider the time from the start of the ingestion to the perception of flavor. A previous review described this time as the “lag time” in the T-I analysis and only mentioned that the time of “often, a few seconds’ delay” or “lag time” is observed [5]. The present study may be the first to precisely examine the lag time and RTF and to correct for the disadvantages of the previous studies; the studies measuring the simple reaction time only used fluids and vapors, not solid and semi-solid foods, while those on T-I analysis paid little attention to the “lag time” of the curves. The present study suggests the usefulness of a measuring system using EMGs to precisely analyze the time from the start of the ingestion to the perception of flavor for solid and semi-solid foods.
5. Acknowledgements
This study was supported in part by a Grant-in-Aid for Scientific Research from the Ministry of Education, Science and Culture of Japan (No. 22500740 to YM).
REFERENCES
- T. J. Jacob and L. Wang, “New Method for Measuring Reaction Times for Odour Detection at Iso-Intensity: Comparison between an Unpleasant and Pleasant Odour,” Physiology & Behavior, Vol. 87, No. 3, 2006, pp. 500- 505. http://dx.doi.org/10.1016/j.physbeh.2005.11.018
- L. Wang, V. E. Walker, H. Sardi, C. Fraser and T. J. Jacob, “The Correlation between Physiological and Psychological Responses to Odour Stimulation in Human Subjects,” Clinical Neurophysiology, Vol. 113, No. 4, 2002, pp. 542-551. http://dx.doi.org/10.1016/S1388-2457(02)00029-9
- T. Yamamoto and Y. Kawamura, “Gustatory Reaction Time in Human Adults,” Physiology & Behavior, Vol. 26, No. 4, 1981, pp. 715-719. http://dx.doi.org/10.1016/0031-9384(81)90149-9
- R. M. Pangborn and A. Koyasako, “Time-Course of Viscosity, Sweetness and Flavor in Chocolate Desserts,” Journal of Texture Studies, Vol. 12, No. 2, 1981, pp. 141- 150. http://dx.doi.org/10.1111/j.1745-4603.1981.tb01228.x
- W. E. Lee and R. M. Pangborn, “Time-Intensity: The Temporal Aspects of Sensory Perception,” Food Technology, Vol. 40, No. 11, 1986, pp. 71-82.