Journal of Behavioral and Brain Science
Vol. 2 No. 4 (2012) , Article ID: 25210 , 9 pages DOI:10.4236/jbbs.2012.24052
Assessing Brain Pathophysiology through Non-Linear Analysis of MEG in Ιdiopathic Generalized Epilepsy Cases
1Lab of Medical Physics, Medical School, Democritus University of Thrace, Alexadroupolis, Greece
2Department of Neurology, Medical School, Democritus University of Thrace, Alexadroupolis, Greece
Email: *akotini@med.duth.gr
Received June 1, 2012; revised June 22, 2012; accepted August 6, 2012
Keywords: Non-Linear Analysis; MEG; IGE
ABSTRACT
Background: Non-linear signal analysis has proven to be a technique that is capable of revealing qualitative and quantitative differentiations between different dynamical systems (biological or otherwise). In the present work it has been demonstrated that this capability reveals quantitative differences in the Magnetoencephalograms (MEG) received from patients with Idiopathic Generalized Epilepsy (IGE) and from healthy volunteers. Method: We present MEG recordings of 10 epileptic patients with IGE and the corresponding ones from 10 healthy volunteers. A 122-channel SQUID biomagnetometer in an electromagnetically shielded room was used to record the MEG signals and the Grassberger-Procaccia method for the estimation of the correlation dimension was applied in the phase space reconstruction of the recorded signal from each patient. Results: The aforementioned analysis demonstrates the existence of spatially diffused low dimensionality in the MEG signals of patients with IGE. Conclusion: The obtained results provide support for the hypothesis that low dimensionality in MEG signals is linked to functional brain pathogeny.
1. Introduction
Non-linear analysis has been used in the past to assess magnetoencephalographic recordings (MEG) from patients with schizophrenia [1], Parkinson’s disease [2] and malignant tumours of the brain [3]. This paper provides evidence for a link between Idiopathic Generalized Epilepsy (IGE) and the characteristics of the strange attractor derived from the MEG recordings of the patients suffering from it.
The recorded MEG activity is caused by ionic movements across the plasma membrane [4]. This activity is weak as it is (≈10−8 of the earth’s magnetic field which is equivalent to 50 μT), can be measured by means of a Superconducting Quantum Interference Device (SQUID) [4]. The SQUID is one of the few devices which are capable of measuring the exceedingly weak magnetic fields emitted by living tissues. The method is non-invasive because the SQUID is a passive electromagnetic receiver and not a transmitter of any kind of radiation [5,6].
Chaos theory [7] provides us with measurable quantities of the complexity of dynamical systems. In the case of a time series obtained through a MEG measurement of the brain, these measurable quantities refer to the underlying dynamical system, namely the brain. In that context, chaos theory provides us with quantitative markers of the dynamical complexity of the brain. There are indications that the healthy brain, due to the statistical nature of its neuronal discharges, is a very highly, theoretically infinitely complex system [8].
On the other hand despite the lack of understanding regarding the underlying pathogeny, IGE is a condition that is characterized by abnormal, rhythmic, electro-chemical brain activity without a single spatially determined epileptogenic focus [9].
According to the theory of nonlinear dynamical systems and chaos [10,11] the dynamics of any physical or biological system can be quantified and described by means of some new terms and concepts, such as the chaotic attractor and the correlation dimension of the reconstructed phase space. Of vital importance in the chaotic analysis of a dynamical system is the evidence for the existence of low dimension chaotic attractors and the estimation of the correlation dimension D of the attractor. The purpose of this study is to explore the diagnostic potential of this method [10,11] in the cases of IGE.
2. Patients and Methods
Magnetic recordings were obtained from 10 patients with IGE and 10 healthy volunteers. The 10 patients ,4 male (32 - 82 years old) and 6 female (20 - 55 years old) were classified as IGE according to the International League Against Epilepsy (ILAE) classifications. The selection of the IGE patients was random so the two gender groups (4 male and 6 female) were heterogeneous in their ages and clinical forms. This was our choice because in this preliminary study we wanted to explore the existence of correlation between low dimensionality chaos in MEG signals and the existence of IGE in the patients. In that context any demographic exclusion criteria would be a hindrance in sampling. The diagnoses were based on clinical manifestations, electroencephalography findings and brain MRI when it was necessary. All patients underwent an MEG examination. The 10 control subjects were volunteers with similar demogra phics with the patients. All the participants came from the county of Evros, Thrace, Greece. All controls underwent a standard neurological examination that, in all of them, resulted as normal. Informed consent was obtained from patients and volunteers prior to the procedure.
The method used for the recording of magnetic activity has been described in detail elsewhere [12,13]. In brief, we used a 122-channel SQUID gradiometer device and specifically the Neuromag-122 (Neuromag Ltd. Helsinki Finland). The 122 orthogonal thin-film planar gradiometers operate at low liquid helium temperatures (40 K) on the basis of the Josephson effect of superconductivity [14] with a broadband gradient noise 5 fT/(cm ) and max noise 10 fT/(cm
 ) for the 95% of the channels for f > 10 Hz and a broadband gradient noise 15 fT/(cm
 ) and max noise 20 fT/(cm
 )for 95% of the channels for 1 Hz < f < 10 Hz. The helmet-shaped sensor array contains 122 planar gradiometers that detect the MEG signals just above the local current sources. Figure 1 shows the channels in stereographic projection seen from above. The arrows indicate the direction of the gradient at which the sensor is sensitive. Each subject was comfortably seated on a non-magnetic chair in a magnetically shielded room. During the recordings the subject’s head was covered with the helmet-shaped dewar. All recordings were taken with the patients conscious and relaxed. There were no recordings taken from patients demonstrating either clinical or MEG signs of seizure. The aim is to avoid the known trivial MEG signal morphology that is associated with active seizure neuronal discharges. The MEG sampling frequency was 256 Hz and the associated Nyquist frequency was 128 Hz, which was well above constituent frequency components of interest in our MEG recordings thus avoiding aliasing artifacts. The MEG signal was filtered with cut-off frequencies between 0.3 to 40 Hz. The time taken for each recording was in the range of 1 min after all transients (due to patient placement and motion) have died off. The duration of the above records is the routinely chosen time interval that has proven long enough, in past studies [1,3], to cancel out, on average, all random events and to allow for only the persistent ones to remain.
Nonlinear MEG signal analysis utilizes advanced mathematical methods to quantitatively correlate the characteristics of a given MEG signal with the underlying brain dynamics that produced this signal. The analysis method of this study was first proposed by Grassberger and Procaccia [10,11], based on the theorem of the reconstruction of the phase space introduced by Takens [15].
This method uses the observed MEG time series, in order to construct an appropriate geometrical representation of the dynamical properties of that signal. From this representation it is possible to derive geometrical parameters that are linked to the dynamical properties of the system that produced the given signal, in our case the human brain. One such geometrical parameter is the minimum saturation dimension (mminsat). This parameter (mminsat) is an index of the complexity of the dynamical system which produced the MEG signal. A more rigorous, although brief, overview of the mathematics of the method is presented in the Appendix.
Using the aforementioned method the correlation integrals were calculated according to Equation 2 (cf. Appendix) for all the MEG channels of both the patients and the volunteers. From these the slopes were derived and according to Equation 3 (cf. Appendix) the correlation dimensions were calculated for different embedding dimensions m.
The minimum saturation dimension (mminsat) was the parameter that was estimated in our study for each MEG channel of each participant as a quantitative marker of the complexity of the MEG signal. It is worth noting that since the signal from each channel (sensor) was analyzed independently, no spatial sensor grouping was necessary.
3. Results
An example of these correlation dimensions is plotted in Figure 2 both for a patient (solid line) and a healthy volunteer (dashed line). From Figure 2 it becomes clear that the assessed correlation dimension of the signal from the healthy volunteer rises according to the embedding dimension. Since the correlation dimension is an invariant of the underlying system’s dynamic, the fact that it scales according to the embedding dimension indicates that the underlying dynamic is not embedded in a sufficiently high vector space to reveal its true invariant cor-
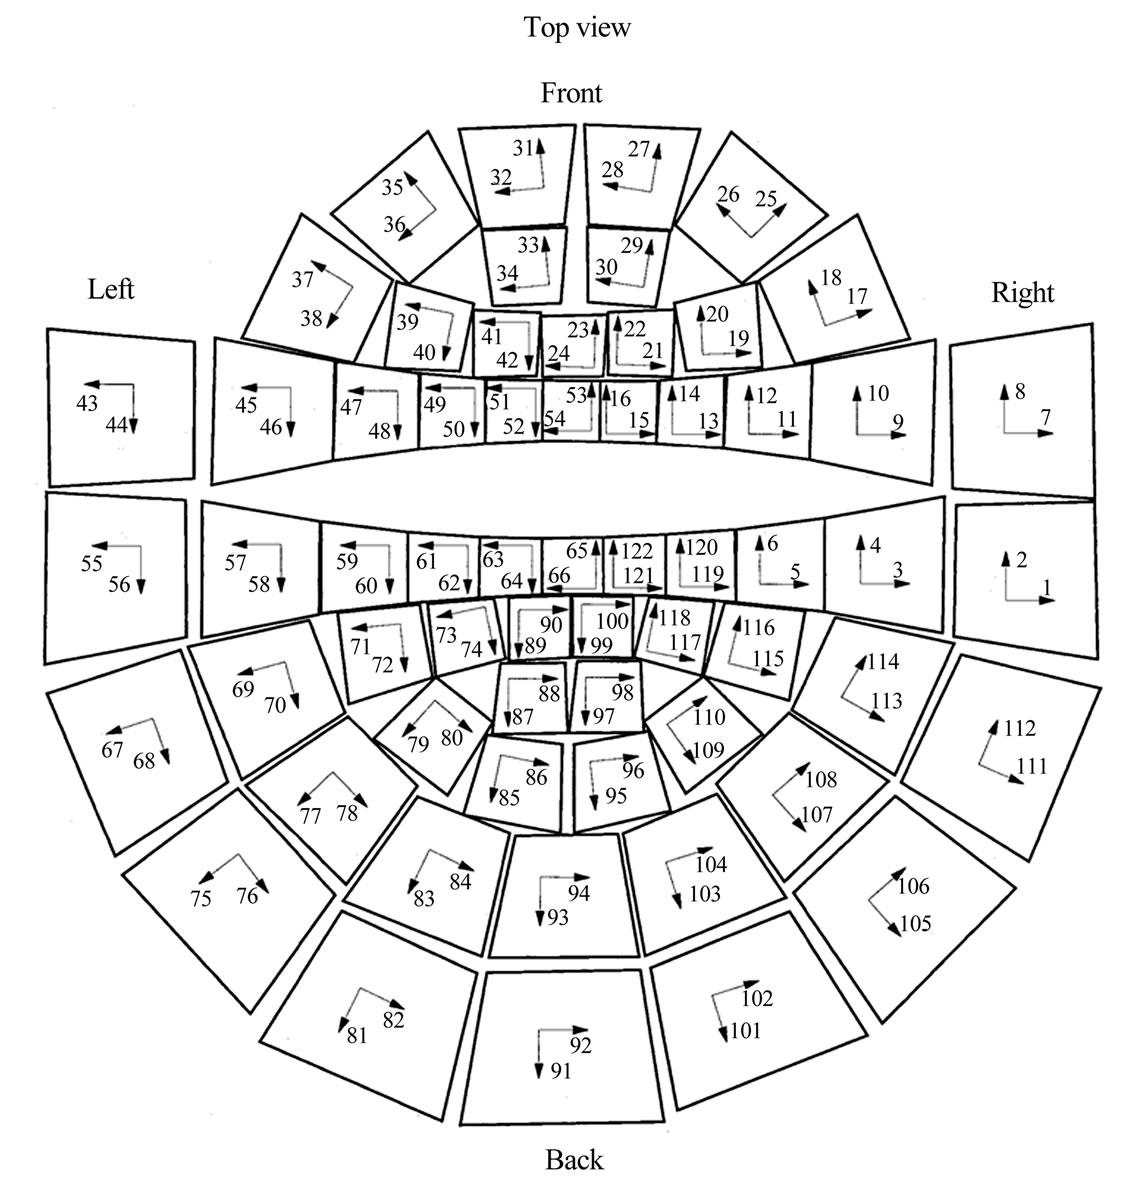
Figure 1. Scan order of the channels; the order into which the channels are read into the memory of the computer. (Neuromag-122 User’s Manual: System Hardware).
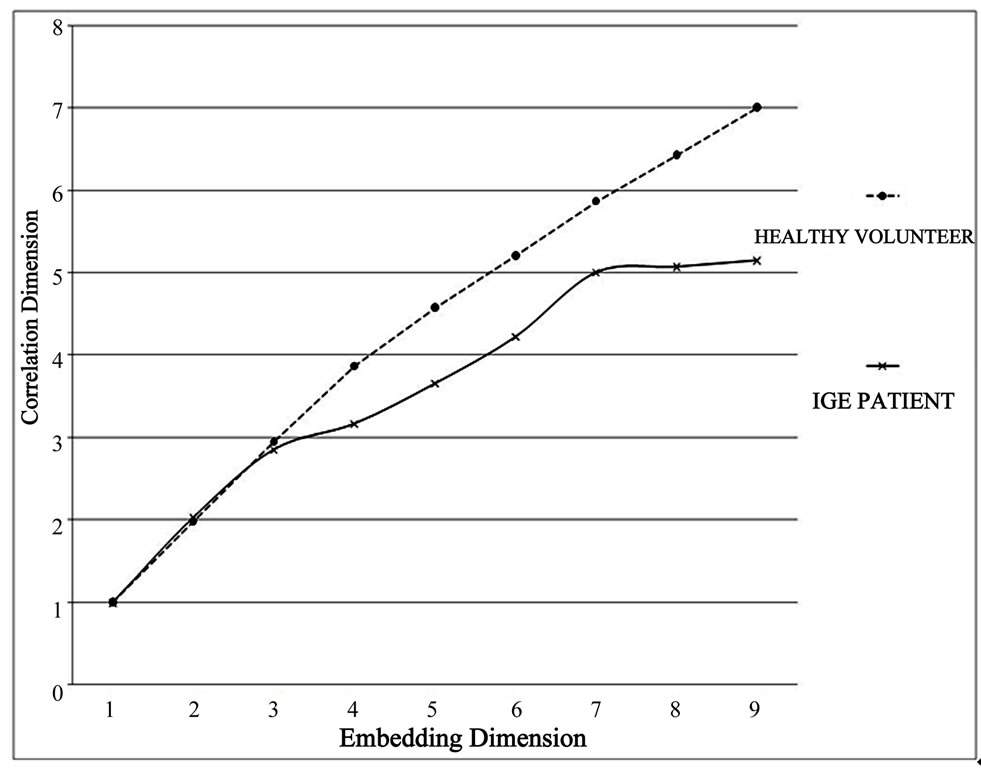
Figure 2. Correlation dimension assessment for different embedding dimensions. The saturated solid line corresponds to an IGE patient whereas the non-saturated dashed line to a healthy volunteer.
relation dimension thus providing these (varying by parameter variation) values. On the other hand, for the patient’s signal it is shown that a plateau of constant dimension reveals itself for mminsat ³ 7. This signifies that an adequate embedding of the underlying system’s dynamic has been achieved in a vector space of 7 dimensions. It is worth noting that while an adequate embedding is achieved only at 7 dimensional vector space, the calculated correalation dimension is approx. D = 5.07. This deceptively low correlation dimension could be attributed to some, unavoidable in realistic time series, temporal correlation of the delay vectors. Even though the delay parameter τ was chosen as the first zero crossing of the autocorrelation function which excluded any linear correlation of the delay vectors, and (as discussed in the appendix) the parameter k of the closest neighbors was chosen so as to maximize the assessed correlation dimension, it appears unavoidable that realistic data would maintain some temporal correlation. For that reason we have chosen not the Correlation Dimension as the invariant of choice for our results but the minimum embedding dimension beyond which saturation occurs (mminsat).
Using the aforementioned methods, MEG channel maps were derived for all the patients. These maps are presented in Figures 3 and 4 for the normal volunteers and the patients respectively. For each patient or volunteer a spatial layout presentation of the MEG channels was drawn with each channel color coded according to the mminsat value. Details of the color scheme are presented in the legend of the figures.
Figure 3 shows no low dimensionality signals in healthy volunteers. Figure 4 exhibits low dimensionality signals diffused throughout the whole of the brain. In order to quantify these results we assumed a worse case scenario that for all the channels not exhibiting saturation the mminsat = 24 since m = 23 was the maximum embedding dimension that our algorithm utilized. Additionally we have averaged the mminsat for all channels of both patients and volunteers summarizing the results to Table 1. A paired samples Student’s t-test was performed resulting in t = −7.42 and p = 0.0002 thus proving that there is a statistically significant difference between the patient sample and the normal sample.
4. Discussion
The data presented in this study add some interesting insights into the dynamics of the MEG signals in different cases of brain pathophysiology and also reinforce the need for further research. From previous works it has been shown that the normal neuronal discharges are of a statistical nature and thus they present no saturation; their fractal dimension is infinite [8]. Further work [3] indicated that in the case of malignant tumors of the brain, the signals from the area of the tumor are more organized and have low dimensionality which increases gradually as the signals are acquired further away from the lesion.
Stam et al. [16] calculated Kolmogorov entropy (K2), the largest Lyapunov exponent (L1) and the correlation dimension (D2), of original EEG epochs and surrogate (phase randomized) data in control subjects, demented patients and Parkinson patients. They found that demented patients had significantly lower D2 and L1 compared to controls.
Lee et al. [17] detected non-linearity in the EEG of schizophrenia with a modified method of surrogate data. EEGs were recorded with electrodes in healthy male subjects and male schizophrenic patients during a resting eye-closed state. A decrease of dimension complexity was found in the EEG of schizophrenia patients compared with controls.
Gomez et al. [18] analyzed MEG background activity in patients with Alzheimer’s disease (AD) using the Lempel-Ziv (LZ) complexity. The MEGs were recorded with a 148-channel whole-head magnetometer in patients with AD and in age-matched control subjects. Results showed that MEG signals from AD patients had lower complexity than control subjects’ MEGs.
Gomez et al. [19] analyzed MEG background activity from AD patients and elderly control subjects using Higuchi’s fractal dimension (HFD). This non-linear measure can be used in biomedical time series to estimate their dimensional complexity. Results showed that MEG signals from AD patients had lower HFD values than control subjects’ recordings.
The above findings are in accordance with our MEG results in IGE patients because they concluded that an underlying pathogeny presented lower complexity in the measured MEG or EEG signals than in those of a normal state. In our study, the abnormal phenomena of the MEG activity in IGE reduce the dimensionality of the patients’ data.
Bob et al. [20] used nonlinear analysis of bilateral electrodermal activity (EDA) during resting state in schizophrenic patients and healthy participants. The results show that quantitative indices of chaotic dynamics (the largest Lyapunov exponents) calculated from EDA signals recorded during rest and the association test are significantly higher in schizophrenia patients than in the control group and increase during the test in comparison to the resting state.
Bob et al. [21] measured bilateral dynamic changes of EDA in rest conditions in schizophrenic patients and healthy subjects. Results of nonlinear and statistical analysis indicate left-side significant differences of positive largest Lyapunov exponents in schizophrenia patients compared to the control group. These data suggest that increased neural chaos in patients with schizophrenia
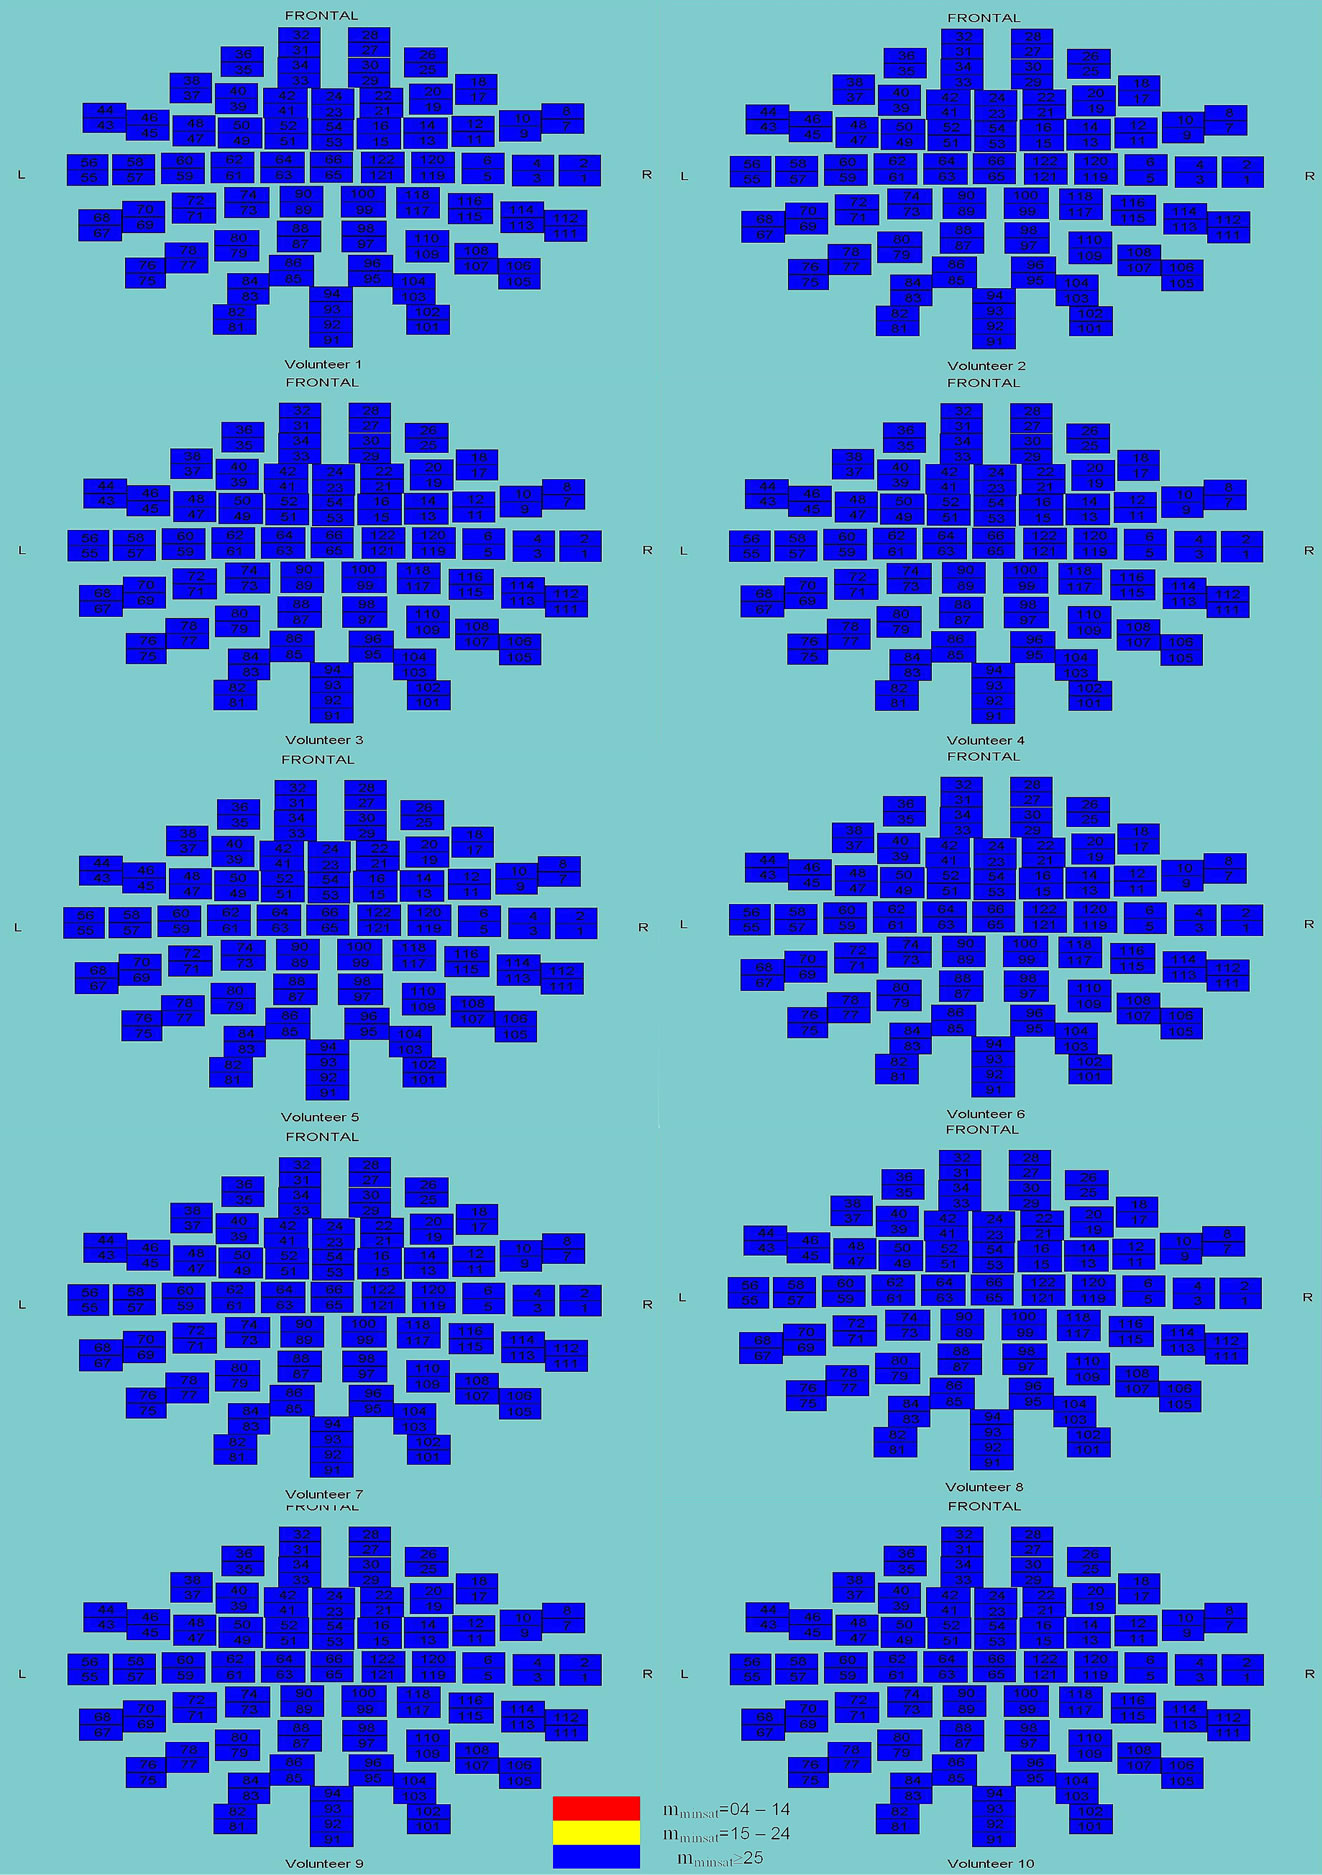
Figure 3. Distribution of mminsat on the MEG channels for the 10 healthy volunteers.
may influence brain processes that can cause random-like disorganization of mental processes.
Kernick [22] reviews an approach to physiological systems with non-linear systems and chaos theory and outlines how these concepts can be applied to the study of migraine. Chaos theory offers a new approach to the study of migraine that complements existing frameworks but may more accurately reflect underlying physiological mechanisms.
Bentzen et al. [23] presented a detailed computer
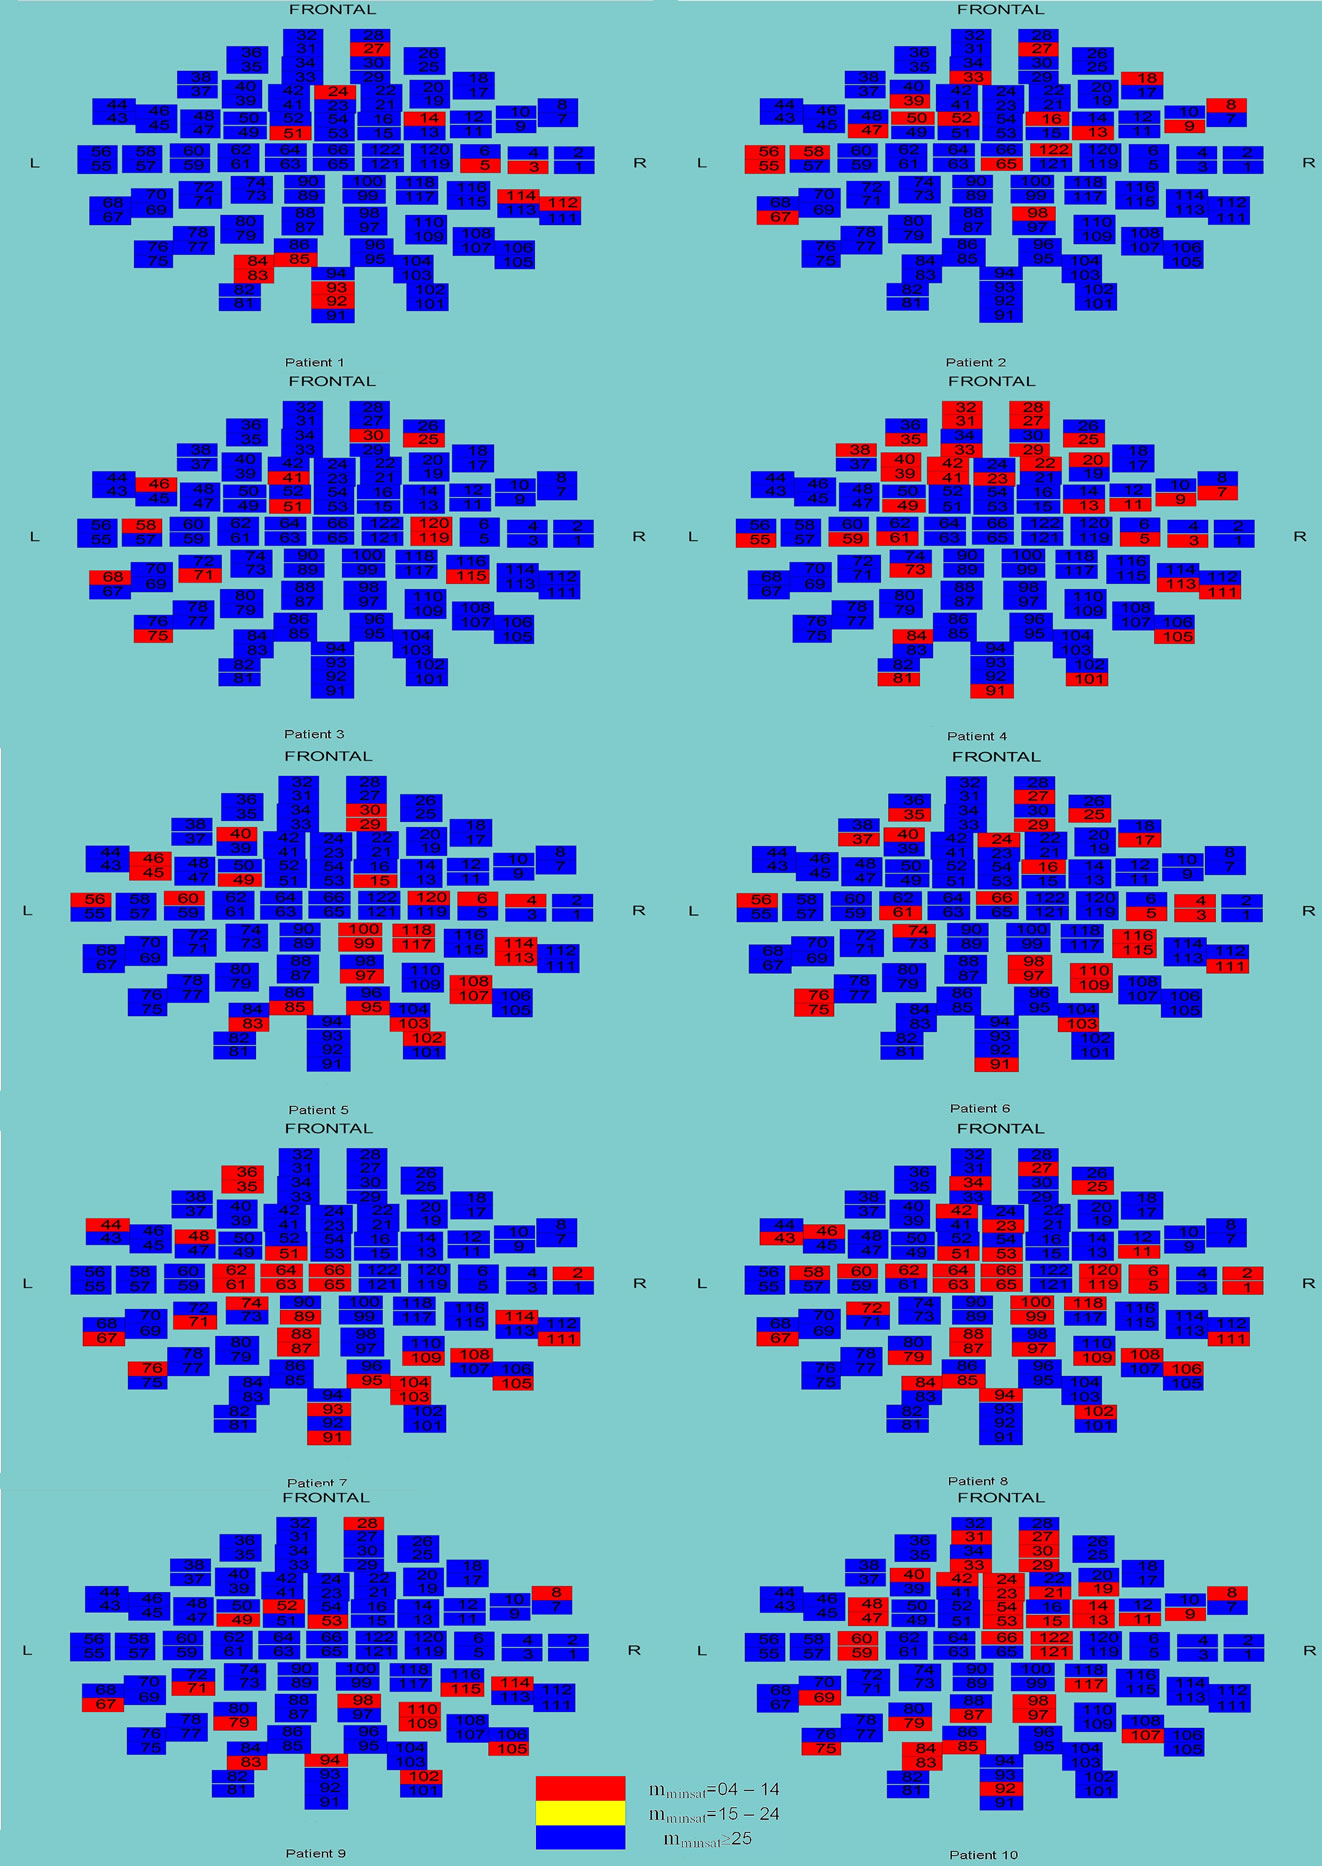
Figure 4. Distribution of mminsat on the MEG channels for the 10 patients.
model, which supports the hypothesis that temporal lobe epilepsy may be caused by failure of glutamate reuptake from the extracellular space. They identified, by chaos analysis, a surprising possibility that muscarinergic receptors can help the system out of a chaotic regime.
The chaos theory suggests that a strong perturbation will cause a rapid transition from the stable attractor of refractory status epilepticus (SE) to the stable attractor representing normal consciousness. In certain ways, SE is analogous to ventricular tachycardia, where the cardiac muscle has an abnormally fast rhythm incompatible with proper cardiac function. Therefore, a brain perturbation, analogous to defibrillation, may be even more useful than anesthesia in refractory SE [24].
Pritchard et al. [25] demonstrated for actual EEG data, a high negative correlation between spatial correlation dimension and the average amount of lag-zero crosscorrelation between “nearest-neighbor” embedding channels (the greater the cross-correlation, the lower the dimension).
Stefan et al. [26] suggested that IGE are generalizing epilepsies predominantly in the frontal lobes regionally accentuated and connected with thalamic network systems. IGE activates a highly specific cortical network, consisting of predominantly mesial and bilateral frontal areas, which are sustained by oscillating thalamo-cortical circuits and in some cases propagate to connected cortex areas. This is, possibly, one of the reasons for the low dimensional complexity of the MEG signals.
Through this current work it has been shown that in the case of IGE the MEG signals acquired from the patients present non localized low dimensionality. The fact that this low dimensionality is demonstrated while the patient is relaxed and conscious (as opposed to the time of a seizure) provides additional support to the hypothesis, that this low dimensionality is correlated with neurophysiological causes and not with transitory neuronal discharge effects. It is true that there are still several clinical and methodological avenues of research before this hypothesis can be clearly substantiated. First of all a larger patient base will reinforce these results, while a more diverse sample, spanning different functional and anatomical brain disorders would provide more solid foundations for this hypothesis. Additionally the refinement of the method and the combination of many different mathematical tools are required to create a robust

Table 1. Distribution of the averaged minimum saturation dimensions for the IGE patients and the controls.
analysis procedure that would have definitive and specific diagnostic results.
Nevertheless, through this discussion a pattern emerges. Although the Chaos hypothesis of Brain dynamics (i.e. The hypothesis that the brain is a dynamical system of very high complexity and that instances of pathogeny in the brain lead it to become a low complexity-high organization system) is still a hypothesis, the results presented in this work along with others [1,3,27] are advocates of this hypothesis.
Furthermore the similarities between the physiological characteristics of the underlying pathophysiology and the mathematical characteristics of the acquired MEG signal (as analyzed by nonlinear methods) suggest that this method, with the necessary refinements has significant diagnostic potential.
REFERENCES
- A. Kotini and P. Anninos, “Detection of Non-Linearity in Schizophrenic Patients Using Magnetoencephalography,” Brain Topography, Vol. 15, No. 2, 2002, pp. 107-113. Hdoi:10.1023/A:1021420507901
- P. A. Anninos, A. V. Adamopoulos, A. Kotini and N. Tsagas, “Nonlinear Analysis of Brain Activity in Magnetically Influenced Parkinson’s Patients,” Brain Topography, Vol. 13, No. 2, 2000, pp. 135-144. Hdoi:10.1023/A:1026611219551
- P. Antoniou, P. A. Anninos, H. Piperidou, A. Adamopoulos, A. Kotini, M. Koukourakis and E. Sivridis, “Non-Linear Analysis of Magnetoencephalographic Signals as a Tool for Assessing Malignant Lesions of the Brain: First Results,” Brain Topography, Vol. 17, No. 2, 2004, pp. 117- 123. Hdoi:10.1007/s10548-004-1009-0H
- D. F. Rose, P. D. Smith and S. Sato, “Magnetoencephalography and Epilepsy Research,” Science, Vol. 238, No. 4825, 1987, pp. 329-335. Hdoi:10.1126/science.3310234H
- P. Anastasiadis, Ph. Anninos and E. Sivridis, “Biomagnetic Activity in Breast Lesions,” The Breast, Vol. 3, No. 3, 1994, pp. 177-180. Hdoi:10.1016/0960-9776(94)90072-8H
- P. A. Anninos, G. Anogianakis, G. Lehnertz, C. H. Pantev and M. Hoke, “Biomagnetic Measurements Using Squids,” International Journal of Neuroscience, Vol. 37, No. 3-4, 1987, pp. 149-168. Hdoi:10.3109/00207458708987144H
- J. P. Eckmann and D. Ruelle, “Ergodic Theory of Chaos and Strange Attractors,” Reviews of Modern Physics, Vol. 57, No. 3, 1985, pp. 617-656. Hdoi:10.1103/RevModPhys.57.617
- P. E. Rapp, “Is There Evidence for Chaos in the Human Central Nervous System,” In: R. Robertson and A. Combs, Eds., Chaos Theory in Psychology and the Life Sciences, Lawrence Erlbaum Associates, Mahwah, 1995, pp. 89- 102.
- R. A. Hrachovy and J. D. Frost Jr., “The EEG in Selected Generalized Seizures,” Journal of Clinical Neurophysiology, Vol. 23, No. 4, 2006, pp. 312-332. Hdoi:10.1097/01.wnp.0000228496.66246.e0
- P. Grassberger and I. Procaccia, “Characterization of Strange Attractors,” Physical Review Letters, Vol. 50, No. 5, 1983, pp. 346-349. Hdoi:10.1103/PhysRevLett.50.346
- P. Grassberger and I. Procaccia, “Measuring the Strangeness of Strange Attractors,” Physica D: Nonlinear Phenomena, Vol. 9, No. 1-2, 1983, pp. 189-208. Hdoi:10.1016/0167-2789(83)90298-1
- P. A. Anninos, N. Tsagas, R. Sandyk and K. Derpapas, “Magnetic Stimulation in the Treatment of Partial Seizures,” International Journal of Neuroscience, Vol. 60, No. 3-4, 1991, pp. 141-171. Hdoi:10.3109/00207459109167029
- C. H. Elger, M. Hoke, K. Lehnertz, C. Pantev, B. Lutkenhoner, P. A. Anninos, et al., “Mapping of MEG Amplitude Spectra, Its Significance for the Diagnosis of Focal Epilepsy,” In: K. Maurer, Ed., Topographic Brain Mapping of EEG and Evoked Potentials, Spinger Verlag, Berlin, 1989, pp. 565-570. Hdoi:10.1007/978-3-642-72658-3_59
- B. D. Josephson, “Possible Effects in Superconducting Tunneling,” Physics Letters, Vol. 1, No. 7, 1962, pp. 252-256. Hdoi:10.1016/0031-9163(62)91369-0H
- F. Takens, “Detecting Strange Attractors in the Turbulence,” In: D. A. Rand and L. S. Young, Eds., Lecture Notes in Mathematics, Springer, Berlin, 1981, pp. 366-381.
- C. J. Stam, B. Jelles, H. A. Achtereekte, S. A. Rombouts, J. P. Slaets and R. W. Keunen, “Investigation of EEG NonLinearity in Dementia and Parkinson’s Disease,” Electroencephalography and Clinical Neurophysiology, Vol. 95, No. 5, 1995, pp. 309-317. Hdoi:10.1016/0013-4694(95)00147-Q
- Y. J. Lee, Y. S. Zhu, Y. H. Xu, M. F. Shen, H. X. Zhang and N. V. Thakor, “Detection of Non-Linearity in the EEG of Schizophrenic Patients,” Clinical Neurophysiology, Vol. 112, No. 7, 2001, pp. 1288-1294. Hdoi:10.1016/S1388-2457(01)00544-2H
- C. Gómez, R. Hornero, D. Abásolo, A. Fernández and M. López, “Complexity Analysis of the Magnetoencephalogram Background Activity in Alzheimer’s Disease Patients,” Medical Engineering & Physics, Vol. 28, No. 9, 2006, pp. 851-859. Hdoi:10.1016/j.medengphy.2006.01.003
- C. Gómez, A. Mediavilla, R. Hornero, D. Abásolo and A. Fernández, “Use of the Higuchi’s Fractal Dimension for The Analysis of MEG Recordings from Alzheimer’s Disease Patients,” Medical Engineering & Physics, Vol. 31, No. 3, 2009, pp. 306-313. Hdoi:10.1016/j.medengphy.2008.06.010
- P. Bob, J. Chladek, M. Susta, K. Glaslova, F. Jagla and M. Kukleta, “Neural Chaos and Schizophrenia,” General Physiology and Biophysics, Vol. 26, No. 2007, pp. 298-305.
- P. Bob, M. Susta, J. Chladek, K. Glaslova and M. Palus “Chaos in Schizophrenia Associations, Reality or Metaphor?” International Journal of Psychophysiology, Vol. 73, No. 3, 2009, pp. 179-185. Hdoi:10.1016/j.ijpsycho.2008.12.013
- D. Kernick, “Migraine—New Perspectives from Chaos Theory,” Cephalalgia, Vol. 25, No. 8, 2005, pp. 561-566. Hdoi:10.1111/j.1468-2982.2005.00934.xH
- N. C. Bentzen, A. M. Zhabotinsky and J. L. Laugesen, “Modeling of Glutamate-Induced Dynamical Patterns,” International Journal of Neural Systems, Vol. 19, No. 6, 2009, pp. 395-407. Hdoi:10.1142/S0129065709002105
- M. Hutchinson and P. D. Swanson, “Chaos Theory and the Treatment of Refractory Status Epilepticus: Who Benefits from Prolonged Anesthesia, and Is There a Better Way?” Medical Hypotheses, Vol. 68, No. 2, 2007, pp. 439- 441. Hdoi:10.1016/j.mehy.2006.07.025H
- W. S. Pritchard, K. K. Krieble and D. W. Duke, “On the Validity of Estimating EEG Correlation Dimension from a Spatial Embedding,” Psychophysiology, Vol. 33, No. 4, 1996, pp. 362-368. Hdoi:10.1111/j.1469-8986.1996.tb01060.x
- H. Stefan, A. Paulini-Ruf, R. Hopfengärtner and S. Rampp, “Network Characteristics of Idiopathic Generalized Epilepsies in Combined MEG/EEG,” Epilepsy Research, Vol. 85, No. 2, 2009, pp. 187-198. Hdoi:10.1016/j.eplepsyres.2009.03.015
- A. Kotini, N. Koutlaki, P. Anninos, A. Adamopoulos, V. Liberis and P. Anastasiadis, “Chaotic Analysis Approach in Neonatal Magneto-Encephalography,” Biology of the Neonate, Vol. 84, No. 2003, pp. 214-221. H doi:10.1159/000072305
- J. Theilert, S. Eubank, A. Longtin, B. Galdrikian and J. D. Farmer, “Testing for Non-Linearity in Time Series: The Method of Surrogate Data,” Physica D: Nonlinear Phenomena, Vol. 58, No. 1-4, 1992, pp. 77-94. Hdoi:10.1016/0167-2789(92)90102-SH.
Appendix
The mathematical framework upon which the results of this paper are based has its foundations on the work of Grassberger and Procaccia. According to their work [10,11], it is possible to explore the underlying dynamics of a non-linear deterministic system from an experimental time series of observations of it. Specifically, for example, for a discrete time series Bi = B(ti) (i = 1,2,···,N) of the MEG, which is measured experimentally, delay vectors Vi as given by the following equation can be constructed in the following fashion:
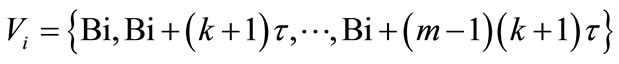 (1)
(1)
It has been proven [10,11] that the topological properties of these vectors when properly constructed give a smooth embedding of the dynamics in a m-dimensional space, and the resulting phase trajectory in the phase space, is the topological equivalent of the original phase space. “Properly constructed” specifically refers to the correct choice of both the delay parameter τ and the parameter k. The reconstruction time τ is a suitable delay parameter, which may be chosen arbitrarily. In our case it was chosen as the first zero crossing of the autocorrelation function which ensures that no linear correlation between the vectors is maintained. The parameter k is chosen by taking into consideration Theilert’s correction [28] of rejecting the k closest neighbors, that are temporally but not dynamically correlated. If the dynamics of the physical system are deterministic but non-linear, the evolution of the Vi, once transients die out, settles on a submanifold which is a fractal set, called the strange attractor. The concept of strange attractors is of great importance in nonlinear dynamics, since its existence or absence is related to the behavior of the system as nonlinearly or linearly deterministic. If a strange attractor exists, it is characterized by several invariant topological parameters. One of these is the correlation dimension D. This parameter is related to the number of variables required to define the space of the attractor within the phase space. The Grassberger-Procaccia method [10,11] is essentially a computational mathematical method of estimating the Correlation Dimension D from an experimental time series by means of the correlation integrals  defined as:
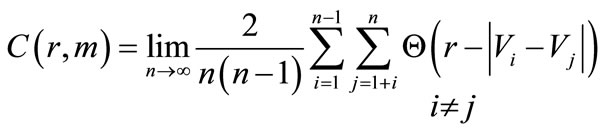 (2)
(2)
where Θ(u) is the Heaviside function defined as (Θ(u) = 1 for u > 0 and Θ(u) = 0 for u £ 0), m is the embedding dimension and n is the number of vectors constructed from a time series with N samples, given by the formula 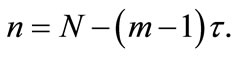 The resulting correlation integral
  is a measure of the spatial correlation of the points on the attractor and it is calculated for different values of r in the range from 0 to rmax, where rmax is the maximum possible distance of two random selected points of the attractor of the selected time series. The rmax is equal to m1/2(xmax−xmin), (assuming that xmax and xmin are the maximum and the minimum recorded values in the time series). For a nonlinear deterministic system the correlation integrals should scale as
 Thus, the correlation dimension D of the attracting submanifold in the reconstruction phase space is given by:
 (3)
(3)
In the case of a signal coming from a nonlinear deterministic dynamical system exhibiting a strange attracttor, there is a saturation value, indicated as a plateau in a graph of these slopes  v’s ln(r), and which remains constant, although the signal is embedded in successively higher-dimensioned phase spaces. The saturation value of the slopes, gives an estimation of the correlation dimension of the attractor, while the minimum value of the embedding dimension above which the graphs of these slopes
  v’s ln(r) overlap provides us with an estimate of the minimum saturation dimension defined as mminsat.
Specifically the correlation integrals (or, more appropriately in computational practice, consecutive correlation sums) are used to determine whether or not a space of sufficient dimensions, the aforementioned m-dimensional space, exists so that a geometrical area can be defined to smoothly embed the full dynamics that produce the measured signal. It has been proven [15] that if such an m-dimensional space exists then the value of this embedding dimension m, along with the Correlation Dimension D are characteristic invariants of the underlying dynamical system.
NOTES
*Corresponding author.