Advances in Chemical Engineering and Science
Vol.3 No.2(2013), Article ID:30492,15 pages DOI:10.4236/aces.2013.32016
Characterization of Tars from the Thermal Processing of Baganuur and Tavan Tolgoi Coals from Mongolia, Using SEC, UV-F, IR and Mass Spectrometry
1Institute of Chemistry and Chemical Technology, Mongolian Academy of Sciences, Ulaanbaatar, Mongolia
2Department of Chemical Engineering, Marmara University, Goztepe Campus, Istanbul, Turkey
3European Commission, Directorate-General Joint Research Centre, Institute for Energy, Petten, The Netherlands
4Instituto Nacional del Carbon, C/Francisco Pintado Fe, Oviedo, Spain
5Chemical Engineering Department, Imperial College London, South Kensington Campus, London, UK
Email: *bpurevsuren.icct@gmail.com
Copyright © 2013 Barnasan Purevsuren et al. This is an open access article distributed under the Creative Commons Attribution License, which permits unrestricted use, distribution, and reproduction in any medium, provided the original work is properly cited.
Received December 28, 2012; revised January 30, 2013; accepted February 20, 2013
Keywords: Mongolian Coals; Tar Preparation; Characterization; Laser Desorption Mass Spectrometry; Thin Layer Chromatography
ABSTRACT
Tars from two Mongolian coals (Tavan Tolgoi and Baganuur) produced by simple distillation have been characterized using size exclusion chromatography (SEC) with elution in both 1-methyl-2-pyrrolidinone (NMP) and a mixed solvent (NMP and chloroform), UV-fluorescence in chloroform and NMP, gas chromatography (GC), mass spectrometry (GCMS, probe-MS and LD-MS with thin layer chromatography) and infra-red spectroscopy. The SEC chromatograms using NMP and the solvent mixture NMP: chloroform indicates that similar conclusions can be drawn from using either eluent. The synchronous UV-fluorescence spectra were shifted to longer wavelengths in chloroform solution than in NMP and chloroform may be the better solvent for these tars prepared without extensive secondary thermal treatment. Infra-red spectra indicated differences between the two coal tars that reflected their different ranks, with more oxygenate groups in the lower rank Baganuur coal. Mass spectrometry (GC-MS and probe-MS) of both coal tars confirmed the presence of aliphatic components as well as aromatics and the relatively extensive alkylation of aromatics. Molecular mass ranges indicated for Baganuur tar by SEC compared well with the mass range by LD-MS although the LD-MS extended to higher mass values. The high mass fractions of the tars were revealed by fractionation by thin layer chromatography with the relevant sections of the developed plates inserted directly into the mass spectrometer; laser desorption was directly from the surface of the plate. LD-MS of the unfractionated samples failed to detect the high mass components because of mass discrimination effects. The high mass components were carried over in the distillation by mass transfer of vapours into the condenser.
1. Introduction
There are substantial coal reserves in Mongolia, which provide the majority of the current energy requirements and will play a key role in the future economic development of the country [1]. A range of coals is commercially available and these include coking coal from Tavan Tolgoi, bituminous coals from Nalaikh and Shariingol, and subbituminous coals from the Shiveeovoo and Baganuur deposits [2,3]. Present resource data show that there are over 20 billion tons of proven coal reserves and estimated resources totaling 150 billion tons. The majority of the reserves are low-rank coals. There are no comercially significant gas or oil reserves in Mongolia, which means that coal use is widespread. The current total annual consumption is 7.8 mt∙y−1, with the major portion being used for power generation using stoker fired equipment. The absence of gas is particularly significant in Ulanbaatur and other settlements, where the domestic use of coal for heating and cooking creates pollution and associated health effects [4,5].
The Baganuur sub-bituminous coal reserves are exploited by opencast mining in the central economic region of Mongolia. The Baganuur deposit has been mined since 1978 and is located 110 km east of Ulaanbaatar. The coal reserves of the deposit are approximately 600 million tons, with coal seam thicknesses in the range 10.3 to 17.2 m, in the central part of the deposit. The overburden thickness is 10 - 60 m. The Baganuur coal is used for direct combustion and is the main fuel to the biggest power plant in Ulaanbaatar. The use of this coal for gas and liquids production using gasification and pyrolysis is now being considered. Tavan Tolgoi coal is a coking coal [6] with very different properties to those of Baganuur coal.
The tars from the two coals were generated by simple distillation in Mongolia and some analyses were performed there. The analytical work has been extended during a recent academic visit to Imperial College London (by BP) to further characterize the tars using some advanced techniques. Tars from these coals have not been investigated previously by the advanced mass spectrometric and liquid chromatographic methods developed in London.
Coal tars and petroleum residues present extremely complex chemical mixtures and represent a considerable challenge for analysis. Recent work has involved the development of size exclusion chromatography (SEC) using 1-methyl-2-pyrrolidinone (NMP) as eluent for coal tars and using the eluent mixture NMP:chloroform (6:1 volume ratio) for petroleum asphaltene fractions insoluble in NMP [7,8]. The reason for the insolubility of asphaltene fractions in NMP appears to be the extensive alkylation of petroleum asphaltenes compared with coal tars that have relatively short alkyl groups [9]. The calibration of SEC using polystyrene standards has been shown to provide a good estimate of coal tar pitch fractions up to a molecular mass of about 3000 u [10]. Coal tar pitch from the high-temperature coking of coal tends to contain mainly methyl groups with some dimethyl or ethyl groups and smaller quantities of C3-alkyl groups whereas low-temperature coal tars exhibit considerably longer alkyl groups. Although the SEC analysis with NMP has been used to analyse a low temperature tar, the mixed solvent has not been used previously to analyse a relatively highly alkylated coal tar. In this work, both eluent systems have been used. Laser desorption mass spectrometry has been applied to the analysis of coal tars and petroleum liquids in our previous work and recently has been used to ablate and ionize fractions of these materials directly from thin layer plates following development to separate large immobile material from smaller mobile molecules. This has proved necessary to generate mass spectra of the largest molecules that would be lost through mass discrimination effects if the whole sample was examined without fractionation. The need to reduce the polydispersity of samples before laser desorption mass spectrometry to avoid mass discrimination has been shown in the literature. Briefly, Garozzo et al. [11] showed that agreement between molecular mass distributions of polysaccharides determined by MALDI-MS and SEC was improved if polydispersities were low. Similarly Montaudo et al. [12] found that molecular mass distributions of polydimethylsiloxanes determined by MALDI and SEC agreed if polydispersities were low, while Nielen and Malucha [13] showed that synthetic polymers with a polydispersity greater than 1.1 could not be reliably characterized by MALDI-MS. The high mass components of blends of two polymers of narrow polydispersity suffered from mass discrimination [14], giving lower intensities than expected for the high mass ions. Another problem with laser desorption is the formation of ionized clusters of molecules when using too high laser fluences or thick sample layers. Hortal et al. [15,16] and Martinez-Haya et al. [17] showed that the LD-MS spectrum of an asphaltene depended on the concentration of species in the sample and on the laser fluence applied. The thickness of sample applied to the target plate was a factor in the formation of aggregates or clusters of molecules in the reactive gas plume formed by the laser shot; thin layers were less likely to form cluster ions than thick layers. High laser fluences were more likely to lead to cluster ion formation than fluences slightly above ionization threshold.
The tars were generated from the two coals used in this work by simple distillation, by heating in a retort until the tar was expelled from the coal and collected from a condenser in a receiver. Tar production occurred at different temperatures for each coal and the tars should be considered as ‘initial production’ tars and approximately equal to low temperature tars since their production was at the lowest temperature of production for both coals. There was little secondary thermal treatment of the tar vapours after emission from the coal, thereby preserving the alkylation to a large extent. Distillation of tars stopped when production ended, at 600˚C for Baganuur coal and 900˚C for Tavan Tolgai, these temperatures being those of the furnace rather than the coal bed. The tars were examined by gas chromatography, GC-MS, probe-MS (Baganuur only) laser desorption mass spectrometry both directly and on the tars fractionated using thin layer chromatography, size exclusion chromatography and UV-fluorescence and infra-red spectroscopy.
2. Experimental
2.1. Coal Samples
The Baganuur coal deposit has been mined since 1978 and is located 110 km east of Ulaanbaatar. The coal reserves of the deposit are approximately 600 million tons, with coal seam thicknesses in the range 10.3 to 17.2 m, in the central part of the deposit. The overburden thickness is 10 - 60 m and the method of removal is opencast mining.
The Tavan Tolgoi coking coal deposit is located in the territory of Bayn-ovoo village of South-Gobi province of Mongolia. The investigated reserve is about 6.5 billion tons. TT coal deposit is located also about 700 km from Ulaanbatar city to the South-Gobi desert area of Mongolia. The coal sample was taken from the coal seam No. VIII being exploited at the present time, where the average soil thickness is about 0.5 - 3.0 m and coal seam thickness is about 2.0 - 40.0 m and 3 - 5 km long and it is an opencast mine.
2.2. Pyrolysis Reactor (Mongolian Academy of Sciences)
The pyrolysis of Baganuur coal was investigated in a laboratory scale, vertical cylindrical retort made of stainless steel, with a capacity of 1000 g of sample. The retort was placed in an electric furnace (model SNOL), which could operate at up to 900˚C. A chrome-alumel thermocouple was placed in the furnace against the retort to measure the actual heating temperature and for control purposes. The outlet of the retort was connected to an aircooled iron tube, followed by a water-cooled laboratory glass condenser with a collection vessel for the condensate (pitch and pyrolysis water). The coal charge was about 500 g of 2 - 3 mm pieces. The pyrolysis experiments using BN coal were carried out up to 600˚C and the heating rate to temperature was 20˚C∙min−1. The yields of products, including solid residue (coal char), tar (pitch) and pyrolysis water were determined by weighing, with the yield of gases estimated by difference [18]. The pyrolysis experiments with TT coal were carried out up to 900˚C in the same equipment with the same heating rate. In both cases, the upper temperature corresponded to the end of tar evolution as seen by the cessation of condensation in the distillation apparatus. A schematic diagram of the pyrolysis apparatus has been shown previously [19]. We have noted elsewhere [20] that tar evolution in general is complete by a temperature of 700˚C except where the rate of temperature rise was too fast for the coal temperature to keep up. In the present equipment, the thermocouple was placed between the furnace and the retort and reflected the furnace temperature rather than the coal bed temperature and in consequence, the recorded tar evolution temperatures appear too high. However, the differences in decomposition temperature reflect the lower temperatures needed to decompose the lower rank coal. The results of the pyrolyses are shown in Table 1 for gas, tar and char yields.
2.3. Fuel Analysis
The proximate and ultimate analyses of Baganuur and Tavan Tolgoi coals are shown in Table 2. Values are as determined, with elemental daf values in parentheses.
Table 1. The pyrolysis of Baganuur and Tavan Tolgoi coals.
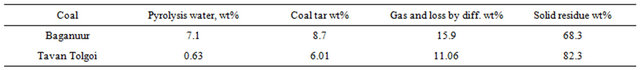
Table 2. Analysis of the coal samples.
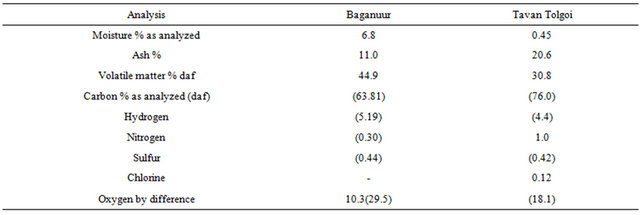
Daf—dry-ash-free values in parentheses.
The analysis confirms the low rank of the Baganuur coal. The coal has a low S and N content, which indicates that lower levels of emissions of environmentally sensitive compounds will form.
2.4. Analytical Methods
2.4.1. Size-Exclusion Chromatography
A 30 cm long, 7.5 mm o.d. column, packed with 20 micron polystyrene polymer particles (Mixed A; Polymer Laboratories Ltd, UK), was operated at room temperature with an eluent flow rate of 0.50 mL∙min−1 using a PerkinElmer LC250 isocratic pump. The solvent was 1-methyl- 2-pyrrolidinone (NMP-peptide synthesis grade; Rathburn Chemicals, UK). Detection was by a Perkin-Elmer LC290 variable wavelength UV-absorption detector, set at 450 nm and an Applied Biosystems diode array detector set at 280, 300, 350 and 370 nm. The method has been described [21,22]. In addition, a method developed using a mixed solvent, NMP and chloroform (6:1 volumes) with a Mixed-E column [7] was applied to a Mixed-D column [8] since this solvent mixture can elute from the SEC column that portion of petroleum asphaltenes insoluble in NMP alone. The intention was to investigate differences that may be revealed between SEC in NMP alone and in the mixed solvent for coal tars containing aliphatic groups, rather than petroleum asphaltenes. The conditions of operation of the Mixed-D column with the mixed solvent were a temperature of 80˚C and a flow rate of 0.5 mL∙min−1 with detection by UV-absorbance using a variable wavelength detector. The particle size of the column packing was 5 micron polymer beads (polystyrene-polydivinylbenzene co-polymer, the same co-polymer as the Mixed-A and Mixed-E columns) and has the advantage that the resolution of molecular sizes is better for smaller sizes using the Mixed-D compared with the Mixed-A column.
2.4.2. UV-Fluorescence Spectroscopy
The procedure has been described elsewhere [23]. The Perkin-Elmer LS50 luminescence spectrometer was set with a slit width of 25 nm, to scan at 240 nm∙min−1; synchronous spectra were acquired at a constant wavelength difference of 20 nm. A quartz cell with 1 cm path length was used. The spectrometer featured automatic correction for changes in source intensity as a function of wavelength. Emission, excitation, and synchronous spectra of the samples were obtained in NMP and chloroform, for the coal tars; only synchronous spectra are shown. Solutions were diluted with NMP or chloroform to avoid self-absorption effects: dilution was increased until the fluorescence signal intensity began to both decrease in intensity and the relative intensities of the different maxima in the spectra ceased to change.
2.4.3. IR-Spectrum of the Coal Tar
The FTIR spectra were collected at room temperature using a single element mercury cadmium telluride (MCT) detector with a continuous scan EQUINOX 55 spectrometer from Bruker Optics. Measurements were carried out using a modified diamond ATR accessory (“Supercritical fluid analyser”, Specac Ltd.) with 4 cm−1 spectral resolution, a spectral range of 3800 - 700 cm−1 and 64 scans to give a reasonable signal to noise ratio. Time taken for each measurement was ca. 60 s.
2.4.4. Thin Layer Chromatography
Thin layer chromatography has been used extensively in the work at Imperial College [24-33]. In more recent work [34-38] analytical plates from Whatman with flexible backing have been used. In this work, the developed plate could be either scraped to allow recovery of the fraction into solution or cut into small pieces to allow selected fractions to be stuck onto the laser target plate of the Bruker mass spectrometer for direct laser desorption from the silica surface. The advantage of this method was that the intractable, relatively immobile material was dispersed thinly over the silica and was less likely to generate cluster ions as laser fluence increased. Also these intractable fractions tended to be impossible to recover completely into solution.
2.4.5. Gas Chromatography
The equipment used was an ATI Unicam 610 Series GC with an HT5-GC column [SGE supplied by Jones Chromatography, 25 m length, diameter 0.32 mm i.d., film thickness 0.1 µm]. The column temperature programme was from 40˚C (held 4 min) to 350˚C at 10˚C∙min−1, held 20 min. The method has been described [39,40].
2.4.6. GC/MS and Heated—Probe MS Analysis
The mass spectrometer was a Varian Saturn quadrupole instrument in tandem with HP gas chromatograph (5890 Series II); electron ionization at 70 eV was used for both tars. The column used for the Baganuur tar was a GC1 polydimethylsiloxane phase with 0.25 µm phase thickness, 25 M in length and 0.25 mm i.d. The oven temperature was programmed from 50˚C (held 1 min) at 4˚C∙min−1 to 300˚C and held for 17 min. The helium carrier gas flow rate was 1 mL∙min−1. The GC injector temperature was at 280˚C and the GC/MS interface temperature was 300˚C. The volume of sample injected as a toluene solution was 1 µL with split ratio of 30:1. The same mass spectrometer was used to examine the Tavan Tolgai tar, but with a 25 M HP1 phase column (Agilent) of internal diameter 0.22 mm and a film thickness of 11 µm. The Baganuur sample was examined by heated probe on a Jeol AX505W double-focusing mass spectrometer with electron ionization at 70 eV; the probe temperature increased from ambient to 400˚C while the mass spectrometer scanned repeatedly over the approximate mass range (m/z) 40 to 800.
2.4.7. Laser-Desorption Mass Spectrometry
The Bruker Daltonics Reflex IV TOF-MS was used to examine the tars. The accelerating voltage was 20 kV and the use of delayed ion extraction was applied with delays of 200, 400 or 600 ns. The mass range scanned was up to m/z 300,000. A high mass detector was used in the linear time of flight mode. The laser was a nitrogen laser with a wavelength of 337 nm, used in pulsed mode. Both tars were examined directly and after fractionation by TLC using flexible plates. After development of the chromatogram using chloroform, four bands were observed corresponding to immobile (fraction 1) or partially mobile (fractions 2 and 3) to very mobile in chloroform (fraction 4). Portions of the plate representing each of these fractions were cut out and stuck to the target plate of the mass spectrometer. The method has been described [35]. Laser desorption mass spectra of the fractions were generated using different laser powers to obtain the best spectrum for each fraction. An ion extraction delay of 600 nsec was used. No matrix was used since the black tars absorbed the laser wavelength with the smaller molecules of the tar acting as an effective matrix. It was not clear if the heaviest fraction, fraction 1, desorbed and ionized completely.
3. Results and Discussion
3.1. Tars Formed from Baganuur and Tavan Tolgoi Coals
Table 1 shows the yields of char, tar, water and gas from the laboratory scale retort. Baganuur coal, the lower rank sample, gave more gas, water and tar (31.7% by weight) and in consequence, less char or residue, than Tavan Tolgai coal where total volatiles were 17.7% by weight, under the conditions used. In the following discussion, the temperatures recorded for gas and tar evolution are those of the control thermocouple between the furnace and the retort, rather than temperatures of the coal bed.
The pyrolysis temperature for BN coal was 500˚C at atmospheric pressure. Decomposition started at about 200˚C with gas evolution, with tar evolved from 350˚C up to 600˚C. The BN tar produced was expected to contain significant quantities of alkanes and relatively highly alkylated aromatics, compared with tars produced by the high temperature coking of coal.
The pyrolysis temperature for TT coal was 900˚C at atmospheric pressure. Decomposition to give gas started at about 360˚C, with evolution of tar from about 600˚C up to 900˚C. This tar would be markedly different from the BN tar, being from a different higher rank coal. Tars from these coals have not been investigated previously but in neither case was the evolved tar subjected to severe secondary thermal treatment after evolution and therefore, alkyl groups were expected to remain intact. Tars evolved from the high temperature coking of coal do experience severe secondary thermal treatment after evolution and alkyl groups are removed, leaving the unsubstituted aromatic systems as the main components.
In both cases, the tar yields determined from the pyrolysis equipment were significantly lower than the proximate volatile yields (Table 2) while the sum of tar and gas was approximately half the proximate volatile yields. The reason for these differences lies in the different geometries of the proximate analysis and the current pyrolysis experiment. The proximate analysis uses a small sample of coal (1 gram) in a crucible with a loose-fitting lid that is placed into a hot oven for a specific length of time. Temperature rise is rapid and volatiles escape easily from the crucible. The test requires that the difference between the initial weight of coal and the weight of coke or char remaining after cooling defines the volatile content and residual char yield. The pyrolysis experiment used in this work involved relatively slow heating of a large coal mass (500 g) in a retort with a long path length between volatile release at the coal surface and escape from the retort into the tar condenser. The formation of char from the volatile material is enhanced under these conditions [20] because of the long path length between emission of volatiles at the coal particle surface and escape into the vapour phase above the coal bed. In the case of both coals, the water collected in the pyrolysis was approximately the same as the proximate moisture.
3.2. Size Exclusion Chromatography SEC in NMP Solvent
The molecular mass distributions of the coal tars were examined by size exclusion chromatography (SEC) in NMP solution at five detector wavelengths, the results are presented in Figure 1. The signal at the wavelengths 450 and 280 nm were essentially of zero strength, possibly indicating that the largest aromatic chromophores expected to absorb at 450 nm were absent from these tars. At 280 nm, it is probable that the NMP was opaque and insignificant light reached the detector. The SEC chromatograms were obtained using a Mixed-A column and it shows that the major part of the samples eluted between 20 and 25 min, with a smaller peak between about 14 - 16 min. The major peak at 20 - 26 min corresponds to the lower molecular mass components of the tars whereas the early eluting peak at 14 - 16 min corresponds to material excluded from the porosity of the column, i.e. high molecular mass or size. The mass range of the early peak components, estimated using the polystyrene calibration curve, was approximately 1.5 - 0.1 Mu.
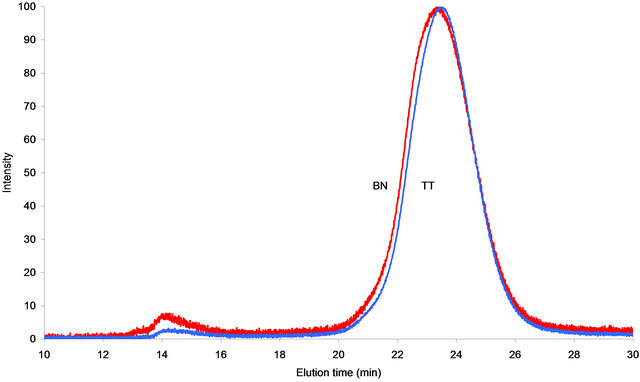
Figure 1. SEC of the coal tar pitches from Baganuur and Tavan Tolgoi coals Mixed-A column, NMP solvent series 2 - 300 nm.
The gap between the two peaks has been interpreted to show a change of conformation between small and large molecules such that the excluded molecules may be three-dimensional rather than planar [8,20]. The fraction represented by the later peak, according to the calibration, ranges from around 4300 u to a peak of intensity at about 2 - 300 u and down to smaller molecular weight compounds. The aliphatic types shown by GC-MS and probe mass spectrometry would not be revealed by SEC using NMP and UV absorbance as the detection method.
The Baganuur and Tavan Tolgoi tars on the Mixed-A column in NMP solvent show the expected bimodal distributions with a valley of zero intensity from 17 - 19 min. The differences between the tars are not great, and the most obvious difference is the proportion of material excluded from the column porosity; the Tavan Tolgoi tar has the least signal in this region. The average molecular size of the main part of the Baganuur tar, between 20 and 27 min, is slightly larger than that of the Tavan Tolgoi tar.
3.3. SEC in NMP: Chloroform Mixed Solvent [6:1 Vol]
The chromatograms obtained for both coal tars using the mixed solvent and the Mixed-D column are compared in Figure 2. The Mixed-D column is more suitable for resolving the sizes of relatively small molecules than the Mixed-A column, shown in Figure 1. This is shown by the differences in the chromatograms of Figure 2 between 16 and 25 min. These differences reflect the small differences seen in Figure 1 where the Baganuur tar was seen to be of slightly larger size than the Tavan Tolgoi tar. In Figure 2, the relatively proportions of the two partly resolved peaks at 21 and 22 min indicate that the Baganuur tar has the larger average molecular size of the two tars. Also the Tavan Tolgoi tar has the smaller proportion of excluded material of the two. Because the Baganuur coal is of lower rank than the Tavan Tolgoi, it is expected that the alkylation would be more extensive in the Baganuur coal and in the distilled tar.
The chromatograms in the mixed solvent show more structure than observed in NMP and on the Mixed-A column, possibly because the Mixed-D column is more suited to the analysis of small molecules than Mixed-A. The excluded peak in the Tavan Tolgoi tar eluted earlier than the equivalent material in the Baganuur tar suggesting larger sized molecules in the excluded material of the Tavan Tolgoi tar. However, in general terms, the chromatograms in the two solvent systems show the same features, with the Baganuur tar of slightly larger size than the Tavan Tolgoi tar. It seems that the alkylation of the aromatic systems of these two tars makes little difference to the chromatograms using either eluent system.
3.4. UV-Fluorescence Spectroscopy
The synchronous spectra for the Baganuur and Tavan Tolgoi tars are compared in Figure 3, in solution in chloroform and in NMP.
The spectra of the two tars in Figure 3 indicate that the tar from Tavan Tolgoi coal is composed of slightly
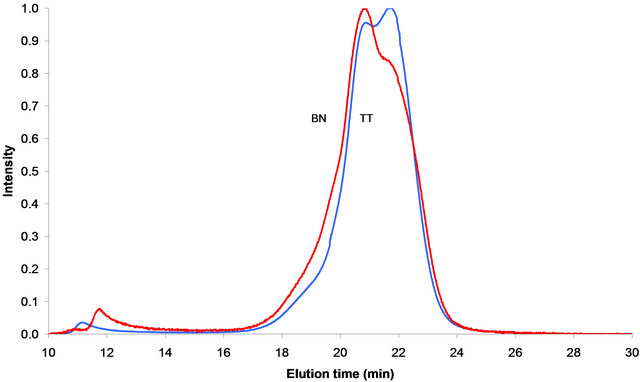
Figure 2. SEC chromatograms in the mixed solvent and on the Mixed-D column at 300 nm UV-A, Baganuur is B and Tavan Tolgoi is T.
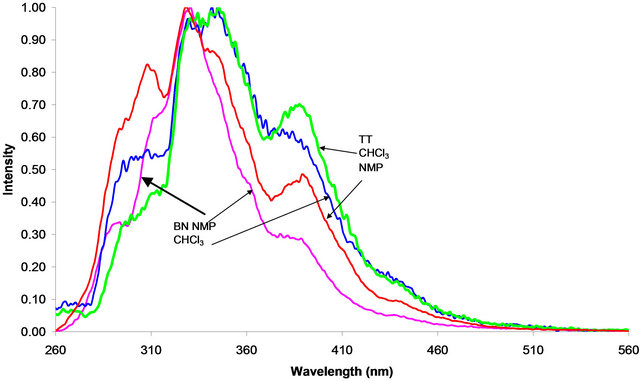
Figure 3. Synchronous UV-F spectra of the two coal tars, Baganuur (BN) and Tavan Tolgoi (TT) in CHCl3 and NMP solutions.
larger aromatic clusters than detected in the Baganuur tar. The synchronous UV-F spectra in NMP shown in Figure 3 indicate that the Tavan Tolgoi tar has considerably larger aromatic chromophores than the Baganuur coal tar. Comparison of the spectra of each tar in the two solvents in Figure 3 indicates that the chloroform solvent dissolved larger aromatic chromophores than did NMP since the fluorescence extended to longer wavelengths. These larger aromatic systems presumably did not dissolve so easily in NMP because the tars show relatively extensive alkylation compared with high-temperature tars, suggesting that chloroform is the better solvent for these highly alkylated coal tars, with spectra showing a shift to longer wavelengths than in NMP solution. It is expected that the aromatic clusters of the higher rank coal would be more extensive than those of the low rank coal.
3.5. Results of FTIR
The spectra of the two coal tars presented in Figure 4 show similar spectral features but of different intensities for different characteristic bands, indicating different amount of chemical functional groups in the two samples [41]. The broad peak observed at 3350 cm−1 is mainly assigned to -OH stretching mode and indicates some differences in terms of the oxygen functionalities; more oxygen is present in the Baganuur tar than the Tavan Tolgoi with the greater intensity in this band for the
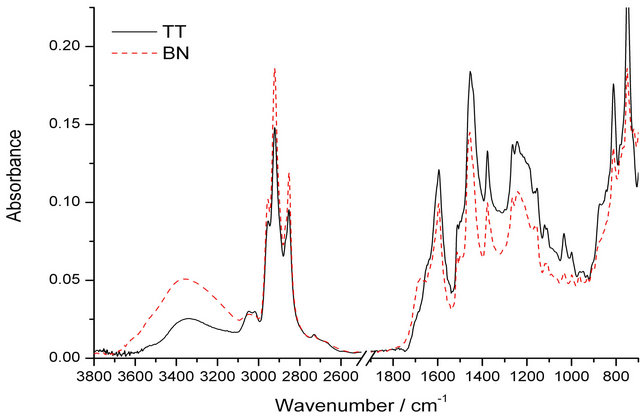
Figure 4. FT-ir of the coal tars.
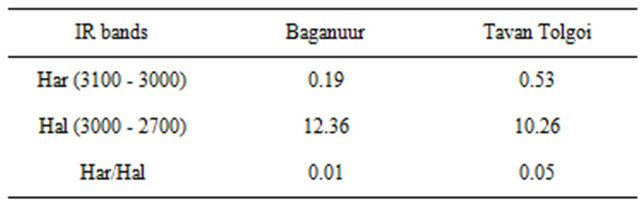
lower rank Baganuur coal as expected. The GC-MS results below show that phenols were more important in the Tavan Tolgoi tar than the Baganuur tar and the FTIR result shows that phenolic groups were incorporated into aromatic structures of Baganuur tar larger than phenol itself that were not sufficiently volatile to pass through the GC column. Different forms of CHx stretching were found in the region between 3100 - 2750 cm−1. The band at 3030 cm−1 is assigned to the aromatic CH stretching while the bands at 2920 and 2850 cm−1 are assigned to asymmetric and symmetric modes of aliphatic CH stretching respectively. Thus the integrated areas of these two spectral ranges are often used in estimating the aromaticity of a carbonaceous material [42,43]. The Har and Hal are the integrated area of the of the IR absorbance at 3100 - 3000 cm−1 and 3000 - 2700 cm−1 respectively. From these values of Baganuur and Tavan Tolgoi coal tars shown in Table 3, it can be observed that Baganuur has more aliphatic functional groups as compared to Tavan Tolgoi. Also the Tavan Tolgoi tar is more aromatic than the Baganuur tar, again as expected from the relative rank positions.
The band at 1680 cm−1 can be assigned to the carbonyl functional group with more intensity for the Baganuur tar, while the peak at 1600 cm−1 is the characteristic peak of the C=C functional group, with the greater intensity for the Tavan Tolgoi tar. These differences again reflect the increased rank and maturity of the Tavan Tolgoi coal compared with the Baganuur coal. The IR absorption bands in the 900 to 700 cm−1 are assigned to the out-ofplane vibration of aromatic CH bonds and can be useful in observing changes in aromatic substitution [44].
The out of plane -CH3 vibrations near 800 cm−1 indicate differences in methyl substitution. Tavan Tolgoi showed higher absorbance for all three bands at 875 cm−1, 810 cm−1 and 750 cm−1 assigned for isolated C-H group, 2 neighboring C-H groups and 4 neighboring C-H groups. It correlates with the comparison of the C-H aromatic peak at 3030 cm−1, with the Tavan Tolgoi tar the more aromatic and condensed than the Baganuur tar.
These spectra of the different tars clearly reflect the differences in rank of the two coals. Although the tars were produced at different temperatures and they are not primary tars (in the sense of having no thermal degradation), they do retain many of the characteristics of the coals and therefore the other analytical results obtained may also be assumed to reflect similar characteristics of the coals.
3.6. Gas Chromatography Results
The gas chromatograms are shown in Figures 5(a) and (b). The sequences of evenly spaced peaks are likely to be n-alkanes and the relative intensities in the two tars are quite different. The coking Tavan Tolgoi coal has the more complex chromatogram than the low rank Baganuur coal tar. These alkanes are not detected by SEC using UV-absorbance detection. The Tavan Tolgoi tar
Table 3. Relative areas of aliphatic and aromatic stretching modes and aromaticities.
(a) BN tar

(b) TT tar
Figure 5. Gas chromatograms of (a) BN and (b) TT tars.
shows considerably more evidence of aromatics as partly resolved groups of peaks than the Baganuur tar.
3.7. Mass Spectrometry of Baganuur and Tavan Tolgoi Tars
GC-MS
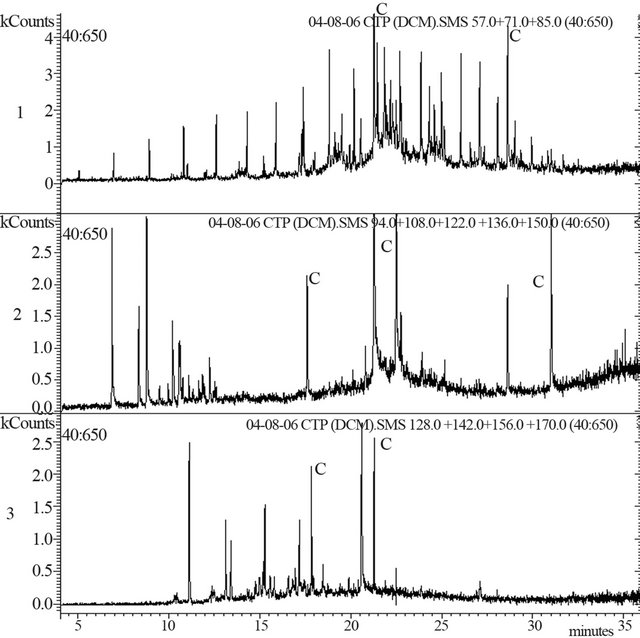
The Baganuur sample was contaminated by phthalate esters and these were the most prominent components of the sample emerging from the gas chromatograph. How-ever, it was possible to analyse the peaks corresponding to the tar but the total ion chromatogram is not shown. Selected ion chromatograms for alkanes, phenols and naphthalenes are shown in Figure 6(a); contaminant peaks are marked as “C”. The total ion chromatogram
 (a)
(a) (b)
(b)
Figure 6. (a): Baganuur tar single ion chromatograms for 1) alkanes [m/z 57 + 71 + 85], 2) phenols [m/z 94 + 108 + 122 + 136 + 150] and 3) naphthalenes [m/z 128 + 142 + 156 + 170]. Contaminant peaks shown as C; (b): Tavan Tolgoi tar, total ion chromatogram 1) and selected ion chromatograms for alkanes 2), phenols 3) and naphthalenes 4).
closely resembled the gas chromatogram shown in Figure 5, but with phthalate contamination. Components of the coal tar included phenols from phenol to C3-alkyl phenols and methyl naphthalenes as well as a series of n-alkanes and cyclic alkanes. Alkanes ranged from C7 at about 5 min to C28 at 33 min. The relative intensities of the alkane series compared with phenols and naphthalenes, were 1.6:1:1 respectively.
The Tavan Tolgoi tar sample total ion chromatogram is shown as Figure 6(b), part 1. A series of n-alkanes is present as shown by Figure 6 part 2, where the sum of ions of m/z 57, 71 and 85 ( ,
, and
and ) characteristic of alkanes is shown. The range of alkanes is from C7H16 at 3 min to C25H52 at 40 min. Phenols are the major peaks of the chromatogram and part 2 shows the sum of ion intensities for m/z 94, 108, 122, 136 and 150, corresponding to phenol, C6H6O, cresols C7H8O, xylenol isomers C8H10O, C3-alkyl phenols C9H12O and C10H14O respectively. Naphthalenes are also significant and part 4 shows the sum of ion intensities for m/z 128, 142, 156 and 170 corresponding to naphthalene C10H8, methyl naphthalenes, C11H10, dimethyl naphthalenes, C12H12 and C3-alkyl naphthalenes C13H14. Larger aromatics were not prominent in the chromatogram and phenanthrene was detected following the n-alkane C15H32 at 22.4 min. Pentacyclic alkanes were detected as a fragment ion at m/z 191 at about 45 min, near the upper limit of the chromatogram. The relative intensities of the alkane ion series compared with phenol and naphthalene ion series were 1:2.5:1 respectively, showing that alkanes were of relatively lower significance in this tar than observed in the Baganuur tar. The relative prominence of phenols in this tar is unexpected since the oxygen content of Baganuur coal (29.5%) is higher than that of Tavan Tolgoi coal (18.1%). The molecular environment of oxygen in the lower rank coal and hence in the tar is unlikely to be phenolic but would be transformed by maturation of the coal as rank increased into more phenolic environments.
3.8. Probe Mass Spectrometry of Baganuur Tar
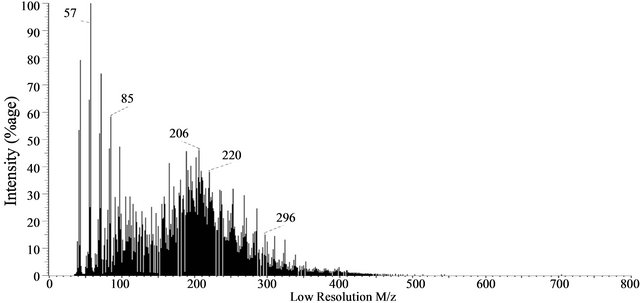
Three mass spectra taken from the sequence of 120 (20, 50, 90) show that the tar contains alkanes, cycloalkanes and pentacyclictriterpanes (indicated by ion at m/z 191 in spectrum 50) as well as a complex sequence of aromatics up to m/z 700. Several prominent ions are evident in these spectra, including m/z 285 and 300, 396, 566 and 584 but their molecular formulae have not been established. The ion at m/z 300 cannot be coronene isomers because the ion at 285 corresponds to loss of a methyl group. The complexity of components identifies the tar as a relatively highly alkylated tar, particularly by the absence of prominent peaks for PAH. The mass spectra are shown in Figure 7.
3.9. Laser-Desorption Mass Spectrometry of Both Tars
The mass spectra of the Baganuur tar and the four fractions from the TLC fractionation are shown in Figure 8(a). The mass spectrum of the whole tar (spectrum 0) shows a continuous mass range from about m/z 150 to more than m/z 1000 with a maximum intensity at about m/z 300, while the various fractions show ranges of ions at much lower intensities. The low sample thickness on the TLC plate is partly responsible for the low ion intensities of the fractions. Fraction 1 shows a very wide range of ions, from m/z 100 up to m/z 10,000; it is probable
 (a)
(a)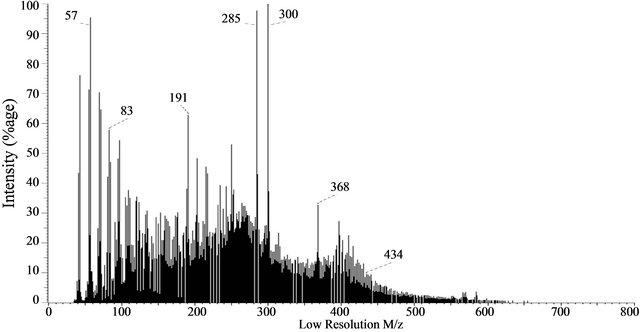 (b)
(b) (c)
(c)
Figure 7. Probe mass spectra at different stages of the experiment: (a) 20th scan, (b) 50th scan and (c) 90th of 120 scans, Baganuur tar.
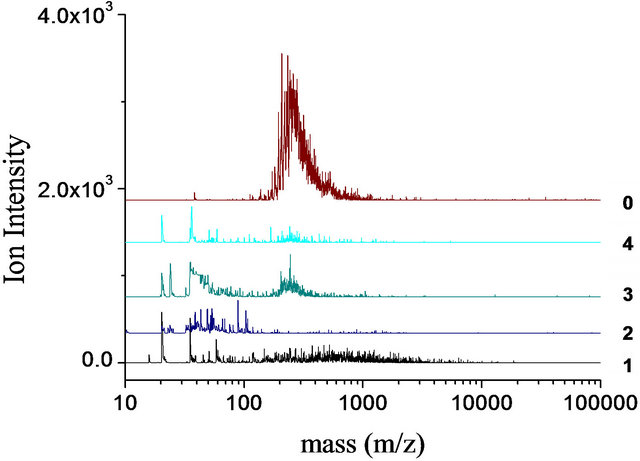
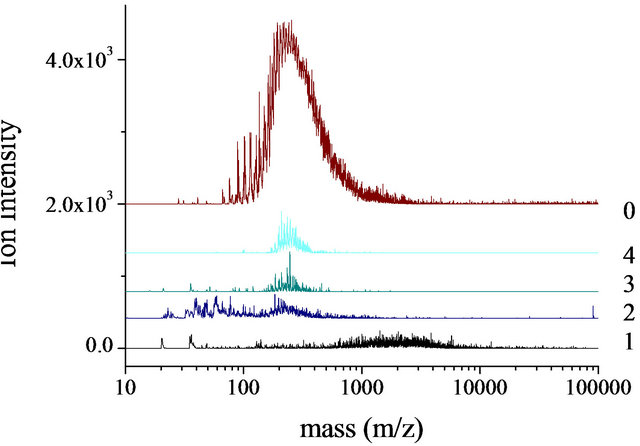
Figure 8. LD-mass spectra of TLC fractions (1 - 4) and whole tar (0) laser power in linear mode with HIMASS voltage 7.0 kV. Ion intensity vs mass. Upper spectrum, Baganuur tar and lower spectrum, Tavan Tolgoi tar.
that the low-mass ions are fragments caused by the high laser power used but it is not clear if the whole range of molecular masses has been ionized given the very low ion intensities. The identification of small quantities of large materials in Fraction 1 (that were not detected in the whole sample) above m/z 1000 up to 10,000 is a consequence of removing the small molecules by fractionation. Mass discrimination effects would prevent the simultaneous ionization of small and large molecules in such a polydisperse mixture. The fraction 2 of the TLC separation does not appear to have ionized and it is possible this material would require a matrix to get sufficient ion signal. The mass spectra of the more mobile fractions 3 and 4 closely resembles the overall sample spectrum. The main range of intense ions of the whole tar corresponds well with the probe-MS data up to m/z 700 as the upper mass limit, after which value, the LD-mass spectrum shows a continuous mass range with intensity falling towards higher masses.
The mass spectrum of the Tavan Tolgoi tar is shown in Figure 8(b) together with the four fractions from the TLC fractionation. The whole tar, spectrum 0, extends from about m/z 100 up to m/z 1000 with a maximum intensity at about m/z 200 - 300. The mass spectra of the more mobile fractions 3 and 4 resemble the spectrum of the whole tar. Fraction 2 shows evidence of fragmentation at low masses as well as a slightly wider range of mass than fraction 3. Fraction 1 extends from m/z 700 to 10,000 with some fragmentation evident and a maximum intensity at about m/z 2000 - 3000. This range of ion masses exceeds that of the whole tar and indicates the presence of mass discrimination effects in the spectrum of the unfractionated sample such that the ionization preferentially favours the formation of low mass ions. This high mass fraction 1 can only be detected by removal of small molecules before ionization.
The presence of small quantities of high-mass material in both samples (fractions 1) may be attributed to the carry-over of large molecules by mass transfer during the distillation of the coals to generate tar. A similar carryover of pitch in the commercial distillation of creosote and anthracene oils has been detected by the combination of LD-MS and TLC fractionation [35]. The relation between these mass spectra and the SEC chromatograms of Figures 1 and 2 is not clear; in Figure 1, the lift-off of signal from baseline for the tars is 4340 u while in Figure 2, the equivalent value is 7660 u. Within the errors of estimation of the methods (SEC and LD-MS) these values are in reasonable agreement.
3.10. Comparison with Other Coal Tars
Recent work [45] has examined a coal tar pitch sample using similar methods to those employed here. The pitch was fractionated into heptane-soluble, toluene-soluble and toluene-insoluble materials. SEC using Mixed-D and -A columns of Baganuur and Tavan Tolgoi tars showed that the two tars on Mixed-A eluted over similar time ranges as the pitch heptane and toluene-soluble fractions, while the pitch toluene-insolubles eluted much earlier, showing that larger aromatic systems were present in this pitch fraction. On Mixed-D the Baganuur and Tavan Tolgoi tars eluted slightly earlier than the pitch heptaneand toluene-soluble fractions, but later than the tolueneinsoluble fraction. This indicates that the Baganuur and Tavan Tolgoi tars contained some relatively large molecules, but in lower proportion than that of the tolueneinsoluble fraction of pitch (41% of the pitch).
GC-MS only detected the heptane-soluble fraction with residual heptane-soluble material detected in the toluene-soluble fraction. It may be assumed in the present work that the GC-MS data refer to the heptanesoluble fraction only. In terms of UV-fluorescence spectroscopy, the present tars show synchronous fluorescence between 280 and 510 nm with the major intensity between 310 and 360 nm and a subsidiary maximum near 390 - 400 nm. In contrast, the pitch spectrum showed synchronous fluorescence from 280 to 630 nm with intensity maxima for heptaneand toluene-soluble fractions near 380 nm while the toluene-insoluble fraction gave a maximum intensity at 480 nm. Clearly, the Baganuur and Tavan Tolgoi tars do not contain such large aromatic systems as the pitch sample. This difference reflects the more extreme thermal treatment of the pitch, derived from the high temperature coking of coal with subsequent destructive distillation to isolate the pitch as the involatile residue.
Mass ranges of the Baganuur and Tavan Tolgoi tars indicated by LD-MS were up to about m/z 1,000 for the whole tars but fractionation by planar chromatography indicated that the immobile fraction contained much larger mass material, up to m/z 10,000. Similar findings for the pitch [45] indicated the largest molecular ion masses, up to m/z 10,000 were in the toluene-insoluble fraction.
One question requiring answer is why do the distillate tars from these two coals have an excluded peak in the SEC chromatograms? This peak is normally thought to consist of fairly high molecular mass material, possibly of three-dimensional structures. Distillate fractions would not be expected to contain high mass molecules. These distillations did not use fractionating columns so the upper temperature limit of the distillation did not provide a sharp cut-off in terms of molecular mass or boiling point. We have shown [35] that the coal tar distillate fractions, creosote oil and anthracene oil from different sources of coal tar, both contained some pitch-like material, indicating that there is significant mass transfer of the distillation residue into the distillate fraction under commercial conditions of distillation. It would therefore be surprising if in the present tars, there was not some carryover of involatile tarry material with the volatile tar, as shown by the planar chromatography fractionation. An excluded peak was detected in the pyrolysis tar from animal bones [46] and it is apparent that such molecules are regular components of commercial distillates.
4. Conclusion
The tars from two Mongolian coals of different ranks (a coking coal and a low rank coal) have been generated in simple apparatus and examined by a variety of analytical methods. The two tars show many similarities given the different carbon contents of the coals. Mass ranges of the tars as indicated by SEC in NMP and in the mixed solvent agree approximately with the mass ranges shown by LD-MS. For both tar samples the majority of the material corresponds to the small molecules expected from the use of distillation. SEC indicated the presence of some material not expected in distillate samples and corresponding to a carry-over of involatile tar by the mass of volatile small molecules. The use of fractionation by TLC before laser ionization has shown the presence of some relatively high-mass components that were not detected in the unfractionated tars by LD-MS, a result of mass discrimination when trying to analyse a sample of wide polydispersity. The infra red spectra clearly reflect the expected differences in rank of the two coals used, with more oxygenated functions for Baganuur and more aromaticity and condensed aromatic systems for the Tavan Tolgoi tar. UV-fluorescence spectroscopy also indicated that the aromatic groups of the Tavan Tolgoi tar were larger and more extensive than the aromatics of the Baganuur tar because the synchronous spectra were shifted further to longer wavelengths than the spectra of Baganuur tar.
5. Acknowledgements
We acknowledge the award of a Royal Society Fellowship to PB to provide funding to visit Imperial College.
REFERENCES
- B.Purevsuren, “Coal Is the Main Source of Energy in Mongolia,” 2nd Korea-Mongolian Symposium on Energy Technologies, Yonsei University, Seoul, 26 June 2007, pp. 13-20.
- B. Avid, B. Purevsuren, M. Born, J. Dugarjav, Ya. Davaajav and A. Tuvshinjargal, “Pyrolysis and TGA Analysis of Shivee Ovee Coal from Mongolia,” Journal of Thermal Analysis and Calorimetry, Vol. 68, No. 3, 2002, pp. 877-885. doi:10.1023/A:1016130203799
- B. Avid, B. Purevsuren, N. Paterson, Y. Zhuo, D. Peralta, A. A. Herod, D. R. Dugwell and R. Kandiyoti, “An Exploratory Investigation of the Performance of ShiveeOvoo Coal and Khoot Oil Shale from Mongolia,” Fuel, Vol. 83, No. 7-8, 2004, pp. 1105-1111. doi:10.1016/j.fuel.2003.11.001
- “Fuel and Energy Sector Profile, Fuel and Energy Authority,” Ulaanbaatar, 2002.
- B. Avid, Y. Sato, K. Maruyama, Y. Yamada and B. Purevsuren, “Effective Utilisation of Mongolian Coal by Upgrading in a Solvent,” Fuel Processing Technology, Vol. 85, No. 8-10, 2004, pp. 933-945. doi:10.1016/j.fuproc.2003.10.010
- J. Dugarjav, “Coking Properties of Tavantolgoi Coal,” Report of the Institute of Chemistry, Mongolian Academy of Science, 1995, pp. 17-22. (in English)
- S. Paul-Dauphin, F. Karaca, T. J. Morgan, M. MillanAgorio, A. A. Herod and R. Kandiyoti, “Probing Size Exclusion Mechanisms of Complex Hydrocarbon Mixtures: The Effect of Altering Eluent Compositions,” Energy & Fuels, Vol. 21, No. 6, 2007, pp. 3484-3489. doi:10.1021/ef700410e
- C. Berrueco, S. Venditti, T. J. Morgan, P. Álvarez, M. Millan, A. A. Herod, R. Kandiyoti, “Calibration of Size Exclusion Chromatography Columns with NMP/Chloroform Mixtures as Eluent: Applications to Petroleum Derived Samples,” Energy & Fuels, Vol. 22, No. 5, 2008, pp. 3265-3274. doi:10.1021/ef8003703
- T. J. Morgan, A. George, P. Alvarez, A. A. Herod, M. Millan and R. Kandiyoti, “Isolation of Size Exclusion Chromatography Elution-Fractions of Coal and Petroleum-Derived Samples and Analysis by Laser Desorption Mass Spectrometry,” Energy & Fuels, Vol. 23, No. 12, 2009, pp. 6003-6014. doi:10.1021/ef9006966
- C. A. Islas, I. Suelves, M. Millan, B. Apicella, A. A. Herod and R. Kandiyoti, “Matching Average Masses of Pitch Fractions of Narrow Polydispersity Derived from Matrix-Assisted Laser Desorption Ionisation Time of Flight Mass Spectrometry, with the Polystyrene Calibration of SEC,” Journal of Separation Science, Vol. 26, No. 15-16, 2003, pp. 1422-1428. doi:10.1002/jssc.200301470
- D. Garozzo, G. Impallomeni, E. Spina, L. Sturiale and F. Zanetti, “Matrix-Assisted Laser Desorption/Ionization Mass Spectrometry of Polysaccharides,” Rapid Communications in Mass Spectrometry, Vol. 9, No. 10, 1995, pp. 937-941. doi:10.1002/rcm.1290091014
- G. Montaudo, M. S. Montaudo, C. Pugsli and F. Samperi, “Molecular Weight Distribution of Poly(dimethylsiloxane) by Combining Matrix-Assisted Laser Desorption/Ionization Time-of-Flight Mass Spectrometry with Gel-Permeation Chromatography Fractionation,” Rapid Communications in Mass Spectrometry, Vol. 9, No. 12, 1995, pp. 1158-1163. doi:10.1002/rcm.1290091215
- M. W. F. Nielen and S. Malucha, “Characterization of Polydisperse Synthetic Polymers by Size-Exclusion Chromatography/Matrix-Assisted Laser Desorption/Ionization Time-of-Flight Mass Spectrometry,” Rapid Communications in Mass Spectrometry, Vol. 11, No. 11, 1997, pp. 1194-1204. doi:10.1002/(SICI)1097-0231(199707)11:11<1194::AID-RCM935>3.0.CO;2-L
- M. Domin, R. Moreea, M.-J. Lazaro, A. A. Herod and R. Kandiyoti, “Effect of Polydispersity on the Characterisation of Coal-Derived Liquids by MALDI-TOF-MS: Inferences from Results for Mixtures of Polystyrene Molecular Mass Standards,” Rapid Communications in Mass Spectrometry, Vol. 11, No. 17, 1997, pp. 1845-1852. doi:10.1002/(SICI)1097-0231(199711)11:17<1845::AID-RCM10>3.0.CO;2-R
- A. R. Hortal, B. Martinez-Haya, M. D. Lobato, J. M. Pedrosa and S. Lago, “On the Determination of Molecular Weight Distributions of Asphaltenes and Their Aggregates in Laser Desorption Ionization Experiments,” Journal of Mass Spectrometry, Vol. 41, No. 7, 2006, pp. 960- 968. doi:10.1002/jms.1056
- A. R. Hortal, P. Hurtado, B. Martinez-Haya and O. C. Mullins, “Molecular-Weight Distributions of Coal and Petroleum Asphaltenes from Laser Desorption/Ionization Experiments,” Energy & Fuels, Vol. 21, No. 5, 2007, pp. 2863-2868. doi:10.1021/ef700225s
- B. Martinez-Haya, A. R. Hortal, P. Hurtado, M. D. Lobato and J. M. Pedrosa, “Laser Desorption/Ionization Determination of Molecular Weight Distributions of Polyaromatic Carbonaceous Compounds and Their Aggregates,” Journal of Mass Spectrometry, Vol. 42, No. 6, 2007, pp. 701-713. doi:10.1002/jms.1226
- Ya. Davaajav, “Investigation on Pyrolyisis of Some Organic Raw Materials,” PhD Thesis, University of Ulaanbaatar, 2006.
- B. Purevsuren, Ya. Davaajav, F. Karaca, T. J. Morgan, A. George, A. A. Herod and R. Kandiyoti, “Pyrolysis of Waste Polypropylene and Characterization of the Tar,” European Journal of Mass Spectrometry, Vol. 15, No. 1, 2009, pp. 23-33. doi:10.1255/ejms.975
- R. Kandiyoti, A. A. Herod and K. D. Bartle, “Solid Fuels and Heavy Hydrocarbon Liquids—Thermal Characterization and Analysis,” Elsevier, Oxford, 2006, Chapter 8.
- F. Karaca, C. A. Islas, M. Millan, M. Behrouzi, T. J. Morgan, A. A. Herod and R. Kandiyoti, “The Calibration of Size Exclusion Chromatography Columns: Molecular Mass Distributions of Heavy Hydrocarbon Liquids,” Energy & Fuels, Vol. 18, No. 3, 2004, pp. 778-788. doi:10.1021/ef030178h
- A. A. Herod, K. D. Bartle and R. Kandiyoti, “The Characterization of Heavy Hydrocarbons by Chromatographic and Mass Spectrometric Methods: An Overview,” Energy & Fuels, Vol. 21, No. 4, 2007, pp. 2176-2203. doi:10.1021/ef060642t
- C.-Z. Li, F. Wu, B. Xu and R. Kandiyoti, “Characterization of Successive Time/Temperature-Resolved Liquefaction Extract Fractions Released from Coal in a FlowingSolvent Reactor,” Fuel, Vol. 74, No. 1, 1995, pp. 37-45. doi:10.1016/0016-2361(94)P4328-Y
- A. A. Herod and R. Kandiyoti, “Fractionation by Planar Chromatography of a Coal Tar Pitch for Characterisation by Size Exclusion Chromatography, UV-Fluorescence and Probe-Mass Spectrometry,” Journal of Chromatography A, Vol. 708, No. 1, 1995, pp. 143-160. doi:10.1016/0021-9673(95)00356-R
- A. A. Herod, S.-F. Zhang, D. M. Carter, M. Domin, M. J. Cocksedge, J. E. Parker, C. A. F. Johnson, P. John, G. P. Smith, B. R. Johnson, K. D. Bartle and R. Kandiyoti, “Matrix-Assisted Laser Desorption/Ionisation Mass Spectrometry of Pitch Fractions Separated by Planar Chromatography,” Rapid Communications in Mass Spectrometry, Vol. 10, No. 2, 1996, pp. 171-177. doi:10.1002/(SICI)1097-0231(19960131)10:2<171::AID-RCM450>3.0.CO;2-K
- A. J. Herod, T. C. Gibb, A. A. Herod, J. Shearman, C. Dubau, S.-F. Zhang and R. Kandiyoti, “Planar Chromatography as a Fractionation Method for Mossbauer Spectroscopy of a Coal Liquefaction Digest,” Journal of Planar Chromatography, Vol. 9, 1996, pp. 361-367.
- J.-P. Deelchand, Z. Naqvi, C. Dubau, J. Shearman, M.-J. Lazaro, A. A. Herod, H. Read and R. Kandiyoti, “Planar Chromatographic Separation of Petroleum Residues and Coal-Derived Liquids,” Journal of Chromatography A, Vol. 830, No. 2, 1999, pp. 397-414. doi:10.1016/S0021-9673(98)00927-3
- M. J. Lazaro, M. Domin , A. A. Herod and R. Kandiyoti, “Fractionation of a Wood Tar by Planar Chromatography for the Characterisation of Large Molecular Mass Materials,” Journal of Chromatography A, Vol. 840, No. 1, 1999, pp. 107-115. doi:10.1016/S0021-9673(99)00175-2
- M.-J. Lazaro, A. A. Herod and R. Kandiyoti, “Comparison of the Fractionation of a Coal Tar Pitch by Solvent Solubility and by Planar Chromatography,” Fuel, Vol. 78, No. 7, 1999, pp. 795-801. doi:10.1016/S0016-2361(98)00201-4
- I. Suelves, C. A. Islas, M. Millan, C. Galmes, J. F. Carter, A. A. Herod and R. Kandiyoti, “Chromatographic Separations Enabling the Structural Characterisation of Heavy Petroleum Residues,” Fuel, Vol. 82, No. 1, 2003, pp. 1-14. doi:10.1016/S0016-2361(02)00198-9
- F. Karaca, M. Behrouzi, T. J. Morgan, A. A. Herod and R. Kandiyoti, “The Effect of Salts on the SEC Profiles of Heavy Hydrocarbon Liquids: New Approach with Salts Dissolved in Solvents Used for Planar Chromatography,” Energy & Fuels, Vol. 19, No. 1, 2005, pp. 187-199. doi:10.1021/ef0498263
- F. Karaca, T. J. Morgan, M. Behrouzi, A. A. Herod and R. Kandiyoti, “Effect of Several Salts on the Elution Behaviour of Heavy Hydrocarbon Liquids During Size Exclusion Chromatography with 1-Methyl-2-Pyrrolidinone as Eluent,” Fuel, Vol. 84, No. 14-15, 2005, pp. 1805- 1811. doi:10.1016/j.fuel.2005.04.008
- W. Li, T. J Morgan, A. A. Herod and R. Kandiyoti, “TLC of Pitch and a Petroleum Vacuum Residue-Relation Between Mobility and Molecular Size Shown by SEC,” Journal of Chromatography A, Vol. 1024, No. 1-2, 2004, pp. 227-243. doi:10.1016/j.chroma.2003.10.020
- T. J. Morgan, “Molecular Mass and Structural Characterization of Heavy Hydrocarbon Materials,” PhD Thesis, Imperial College London, 2008.
- T. J. Morgan, A. George, P. Alvarez, M. Millan, A. A. Herod and R. Kandiyoti, “Characterization of Molecular mass Ranges of Two Coal Tar Distillate Fractions (Creosote and Anthracene Oils) and Aromatic Standards by LD-MS, GC-MS, Probe-MS & Size Exclusion Chromatography,” Energy & Fuels, Vol. 22, No. 5, 2008, pp. 3275-3292. doi:10.1021/ef800333v
- A. A. Herod, T. J. Morgan, P. Alvarez, A. George, M. Millan and R. Kandiyoti, “Analysis of Maya Crude Oil,” Preprints ACS Fuel Divison, National Meeting, Salt Lake City, 22-26 March 2009, pp. 28-29.
- P. Álvarez, C. Berrueco, S. Venditti, A. George, T. J. Morgan, M. Millan, A. A. Herod and R. Kandiyoti, “Syncrude Characterization,” Preprints ACS Fuel Division, National Meeting, Salt Lake City, 22-26 March 2009, pp. 33-34.
- P. Álvarez, C. Berrueco, S. Venditti, T. J. Morgan, F. H. Tay, S. G. Kazarian, A. George, M. Millan, A. A. Herod and R. Kandiyoti, “Structural & Molecular Mass Characterization of Syncrude Fractions from Athabasca Oil Sands,” Paper in Preparation, 2009.
- K. Madhusudan Reddy, B. Wei and C. Song, “HighTemperature Simulated Distillation GC Analysis of Petroleum Resids and Their Products from Catalytic Upgrading Over Co-Mo/Al2O3 Catalyst,” Catalysis Today, Vol. 43 No. 3-4, 1998, pp. 187-202. doi:10.1016/S0920-5861(98)00148-5
- D. C. Villalanti, J. C. Raia and J. B. Maynard, “High Temperature Simulated Distillation Applications in Petroleum Characterization,” In: R. A. Meyers, Ed., Encyclopedia of Analytical Chemistry, John Wiley & Sons Ltd., Chichester, 2000, pp. 6727-6741.
- B. H. Stuart, “Infrared Spectroscopy: Fundamentals and Applications,” 1st Edition, John Wiley & Sons UK, 2004. doi:10.1002/0470011149
- M. J. Inglesias, A. Jimenez, F. Laggoun-Defarge, I. SuarezRuiz, “FTIR Study of Pure Vitrains and Associated Coals,” Energy & Fuels, Vol. 9, No. 3, 1995, pp. 458-465. doi:10.1021/ef00051a010
- Z. S. Li, P. M. Fredericks, L. Rintoul and C. R. Ward, “Application of Attenuated Total Reflectance MicroFourier Transform Infrared (ATR-FTIR) Spectroscopy to the Study of Coal Macerals: Examples from the Bowen Basin, Australia,” International Journal of Coal Geology, Vol. 70, No. 1-3, 2007, pp. 87-94. doi:10.1016/j.coal.2006.01.006
- M. D. Guillen, M. J. Iglesias, A. Dominguez and C. G. Blanco, “Semi-Quantitative FTIR Analysis of a Coal Tar Pitch and Its Extracts and Residues in Several Organic Solvents,” Energy & Fuels, Vol. 6, No. 4, 1992, p. 518. doi:10.1021/ef00034a025
- F. Karaca, T. J. Morgan, A. George, I. D. Bull, A. A. Herod, M. Millan and R. Kandiyoti, “Molecular Mass Ranges of Coal Tar Pitch Fractions by Mass Spectrometry and Size Exclusion Chromatography,” Rapid Communications in Mass Spectrometry, Vol. 23 No. 13, 2009, pp. 2087-2098. doi:10.1002/rcm.4104
- B. Purevsuren, A. A. Herod, R. Kandiyoti, T. J. Morgan, B. Avid, T. Gerelmaa and Y. Davaajav, “The Characterisation of Tar from the Pyrolysis of Animal Bones,” Fuel, Vol. 83, No. 7-8, 2004, pp. 799-805. doi:10.1016/j.fuel.2003.10.011
NOTES
*Corresponding author.