Agricultural Sciences
Vol.3 No.8(2012), Article ID:25456,10 pages DOI:10.4236/as.2012.38120
Spatial variation of carbon dioxide fluxes in corn and soybean fields
![]()
1Laboratory Director and Plant Physiologist, USDA-ARS, National Laboratory for Agriculture and the Environment, University Blvd, Ames, USA; *Corresponding Author: jerry.hatfield@ars.usda.gov
2Soil Microbiologist, USDA-ARS, National Laboratory for Agriculture and the Environment, University Blvd, Ames, USA; tim.parkin@ars.usda.gov
Received 16 August 2012; revised 30 September 2012; accepted 30 October 2012
Keywords: Spatial Variation; Transects; Soil Organic Matter; Soil Temperature; Soil Moisture; Soil Texture
ABSTRACT
Spatial variation of soil carbon dioxide (CO2) flux during a growing season within corn and soybean canopies has not been quantified. These cropping systems are the most intense in the United States and the potential for carbon (C) sequestration in these systems through changes in soil management practices create an opportunity for reduction in greenhouse gas emissions; however, the need to understand the variation in fields is critical to evaluating changes in management systems. A study was designed to evaluate the spatial variation in soil CO2 fluxes along two transects in corn and soybean fields. Samples were collected every 5 m along a 100 m transect between the rows of the crop and also along a transect in which the plants had been removed to reduce the potential of root respiration. Soil CO2 fluxes were collected at each position with air temperature, soil temperature at 0.05 m, and soil water content (0 - 0.06 m). At the end of the season, soil samples for the upper 0.1 m were collected for soil organic C content, pH, sand, silt, and clay contents. On each day measurements were made, the observed CO2 emissions were scaled by dividing the CO2 flux at each position by the mean CO2 flux of the entire transect. Observed CO2 fluxes were significantly larger in the row than in the fallow position for both crops. There were no differences between the corn and soybean fallow transects; however, the corn row samples were larger than the soybean row samples. No consistent spatial patterns were observed in the CO2 fluxes or any of the soil properties over the course of the study. When the CO2 flux data were combined over the season, there was a significant spatial pattern in the fallow transects for both crops but not for the row transects. Sampling for CO2 flux values in cropping systems has to consider the presence of a crop canopy and the amount of root respiration.
1. INTRODUCTION
Interest in climate change mitigation strategies has prompted a renewed study in the amount of carbon (C) sequestered in the soil. Agricultural practices which could potentially increase C sequestration in soil are of great interest because of the need to quantify the impact of different agricultural practices on C dynamics in agriculture as part of the mitigation strategies for C sequestration [1]. Quantification of the carbon dioxide (CO2) fluxes at the soil surface has been studied in many different ways ranging from soil chambers [2], soil sampling [3], to micrometeorological methods [4]. All of these offer different methods of providing a quantification of the CO2 fluxes; however, a question remains about the density of the measurements required to obtain a reliable estimate of the fluxes across a landscape and among different agricultural practices.
Tillage practices and N fertilization can impact CO2 fluxes from soil in a semiarid climate [5]. Increases in CO2 fluxes were observed following tillage with the differences among years due to the variation in soil water content. Additionally, it was observed that after rainfall events CO2 fluxes were determined by soil temperature. However, the length of the time the higher CO2 fluxes were sustained was determined by the rate of soil water loss [5]. The primary effect of tillage systems was due to the impact of the tillage system on the production of biomass which could be converted into soil organic C rather than the act of tilling the soil. In their study, they observed an interaction between tillage and soil water content suggesting that the dynamics of soil water affected by residue management may be an overriding factor affecting CO2 fluxes. Observations of increases in CO2 flux from soil after tillage may be related to disruption of the aggregates and exposure of organic material in the soil to decomposition [6]. Changes in CO2 flux from soil are related to various soil factors; however, there is little information available on the spatial variation of CO2 fluxes across a landscape.
Measured soil respiration at three different landscape positions [2] revealed that was not a significant position effect; however, there was a significant crop effect with greater CO2 fluxes from the corn (Zea mays L.) compared to the soybean (Glycine max (L.) Merr.) fields [2]. This study concluded that the crop effect masked the landscape effect in their observations [2].
Measurements of soil respiration in a mixed wood forest over a combination of temporal and spatial scales indicated that temperature was the dominant seasonal factor with soil water content creating a confounding effect on the temperature patterns [7]. Spatial variability in this study had a seasonal component and was related to the mean soil CO2 flux and related most closely to spatial variation in the C:N ratio [7]. The conclusion from these studies was that soil CO2 fluxes need to be evaluated at a variety of temporal and spatial scales. In a rainforest setting temporal variability of soil CO2 fluxes was related to soil water condition and rainfall history while the spatial variation exhibited a negative relationship to soil water content [8]. The dynamics of soil CO2 flux in a Mediterranean steppe across different surface covers were related to soil water content among the different positions [9]. Measurements of temporal and spatial variation of soil CO2 fluxes across a seed bed and at the field scale revealed the seasonal pattern was related to crop development while the field scale variation was related more closely to soil water content [10]. Although, there have been several studies on spatial and temporal variation of soil CO2 fluxes these have been conducted in non-agricultural environments.
Previous observations by [2] in central Iowa provided a background for our development of an effort to quantify the seasonal and spatial patterns of CO2 flux from soil across transects within corn and soybean fields. The objectives of this study were to evaluate the spatial distribution of soil CO2 flux over a growing season in corn and soybean canopies at two row positions, within the row and fallow areas where the plants had been removed to eliminate the potential respiration from the plant roots.
2. METHODS AND MATERIALS
2.1. Establishment of Transects
Transects were established after planting in 2007 in both corn and soybean production fields located south of Ames, Iowa. The study was conducted in the Walnut Creek Watershed in central Iowa located 5 km south of Ames, Iowa (41˚75¢ N, 93˚41¢W) as part of ongoing long-term monitoring efforts to assess interactions of crop water use, CO2 uptake, and yield for corn and soy- beans. Walnut Creek Watershed is a 5100 ha watershed of intensive corn and soybean production fields ranging in size from 40 - 160 ha. The location of the watershed within Iowa is on the Des Moines lobe landform as shown the following diagram (Figure 1). These two crops occupy approximately 85% of the land area in the watershed. The topography of the watershed and surrounding areas are characterized by flat to gently rolling terrain with elevations in the watershed ranging from 265 - 363 m with the lowest elevations situated on the eastern end of the watershed where the Walnut Creek drains. Details of production, tillage and nutrient management systems within the watershed are described in [11].
Positions of the sampling points were located along transects as shown in the following diagram (Figure 2). Sampling points were positioned every 5 m for a total distance of 100 m along the slope. These sampling points were positioned to represent a within row position between the 76 cm rows of either corn or soybean and between the rows of the crops in which the two rows of the crop were removed. This provided an area for sampling to eliminate the respiration from the plant root system.
Weather conditions during the sampling period in this study had temperatures which were near normal for Ames with an average maximum of 29.5 C (29.0 C normal) in July and 29.0 (27.8 C normal) in August with average minimum temperatures of 17.6 C (23.2 C normal) in July and 18.6 C (21.0 normal) in August which were cooler than normal. Precipitation totals were 66 mm (112 mm normal) in July and 168 mm (115.6 mm normal) in August which was drier than normal during July but
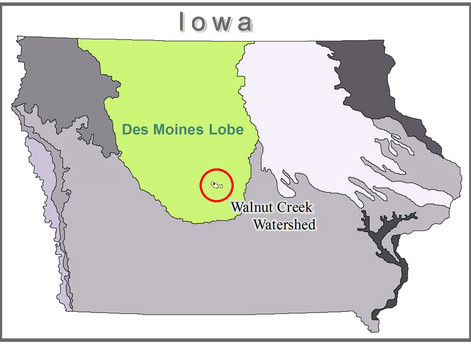
Figure 1. Location of the study site in Iowa on the Des Moines lobe landform.
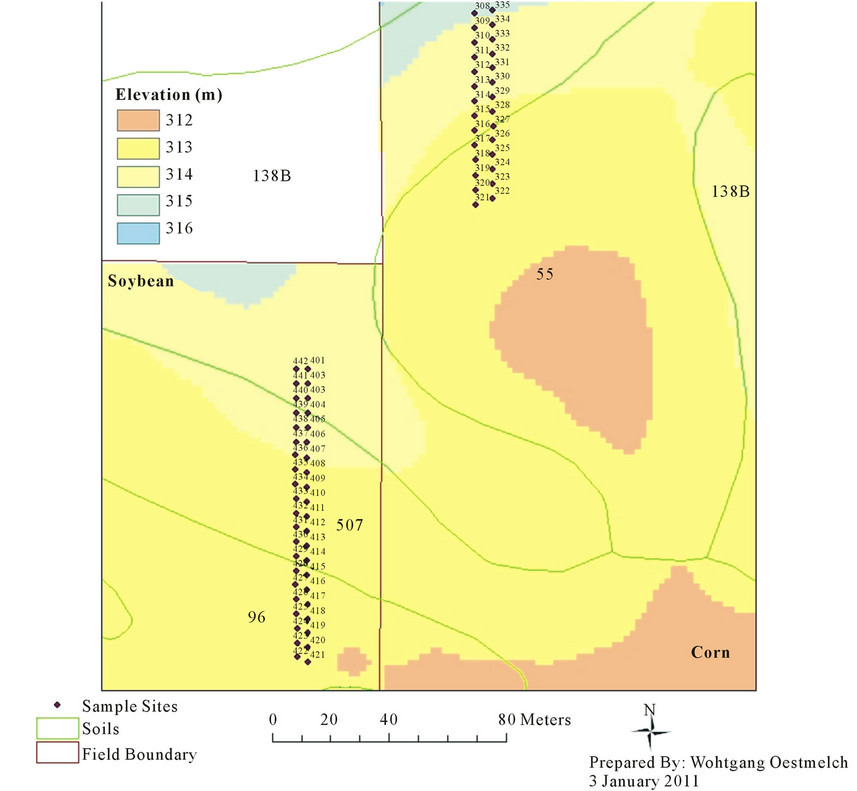
Figure 2. Position of the corn and soybean transects in the field near Ames, Iowa.
above normal for the August period. These weather conditions during the sampling period could be considered as representative for the Ames location.
2.2. Soil Information
At each sampling point, soil samples were collected from the upper 0.1 m and analyzed for organic C content, pH, sand, silt, and clay content, and texture. Air-dried samples were ground with a roller mill for organic C and N determination by dry combustion with a Carlo-Erba NA 1500 CHN elemental analyzer (Haakes Buchler Instruments, Paterson, NJ) after removal of carbonates [12]. Soil pH was measured in 1:1 distilled water to soil slurries. Soil texture analyses were performed by Midwest Laboratories, Inc. (Omaha, NE).
2.3. CO2 Flux Measurement
Soil CO2 fluxes were measured using vented chambers (27 cm diameter) placed on the soil surface for 3 min. A polyethylene skirt attached to the outside of the chamber extended in a concentric ring approximately 30 cm out from the chamber wall and was held on the soil with a length of chain to seal the chambers at the soil surface [13]. Headspace gas of the chambers was circulated through a portable infrared analyzer (model CI-301. CID Inc., Vancouver, Washington) to quantify CO2 concentrations. Carbon dioxide fluxes were calculated by performing linear regression on the CO2 concentration versus time data or by the nonlinear procedure of [14]. At each measurement location, soil water content (0 - 0.06 m) was measured with a Delta-T ML2 Theta probe (Dynamax, Houston, Texas) along with soil temperature (0.05 m) and air temperature. The CO2 flux measurements along transects took several hours to complete on each sampling date. Measurements along transects in the soybean field typically started at 8:30 am and ended around 11:30 am. Measurements in the corn field usually began approximately 12:00 pm and ended at 3:00 pm. During the day soil and air temperatures changed (often
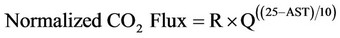
>20˚C changes in air temperature and >15˚C changes in soil temperature). To adjust for changing soil temperatures during the measurement cycle we used Eq. 1 to compute CO2 flux rates normalized to 25˚C according to the procedure of [15].
 (1)
(1)
where R is the measured CO2 flux at a specific location, AST is the average of the 0.05 m soil and air temperature at the time and location the flux (R) was measured, and Q is the Q10 factor. For these calculations a value of Q = 2 was used.
On each day measurements were made and observed CO2 emissions were scaled by dividing the CO2 flux at each position by the mean CO2 flux of the entire transect. Scaled CO2 fluxes were average (by sample position) over the season, and the average scaled CO2 fluxes at each position were used in semivariogram analyses of spatial variability. Soil water contents were scaled in a manner similar to CO2 flux.
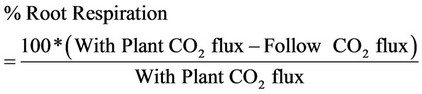
The contribution of root respiration to total respiration was estimated by subtracting the CO2 emission at each position in the fallow transect from its corresponding flux in the “with-plant” transect. Contributions of root respiration are presented as a percentage of the total respiration (Eq. 2).
 (2)
(2)
2.4. Statistical Analysis
Data collected from the different dates were analyzed with correlation, linear regression models, and T-tests using the SAS 9.2 programs (SAS Institute Inc., Cary, NC). Spatial analysis was conducted on the transect data using the GS+ version 9 software (Gamma Sigma Design Software LLC, Plainwell, Michigan).
3. RESULTS AND DECISION
Means and standard deviations of organic C, sand, siltclay, pH, and texture along each of the transects in this study are shown in Table 1. Within each field there were no differences between the fallow or planted transects. Also, there were no differences in sand, silt, clay, or texture values between the two fields. However, organic C and pH were significantly higher in the soybean field than the corn field. There was variation in the soil properties along transects as shown in Figure 3 for corn transects and Figure 4 for soybean transects. There was a major change in the organic C content with distance up the slope changing from 0.05 g·g–1 to 0.025 g·g–1 along a distance of 100 m. The changes in pH were not quite as large and changed from greater than 6 to nearly 5.5 at the top of the slope (Figure 3). Variation of organic C and pH over the soybean transect exhibited a different pattern (Figure 4). The patterns for OC and pH showed nearly constant values for the first 40 m of the transect and then declined linearly to the top of the slope (Figure 4). The range in the organic C content was similar between the corn and soybean transects; however, the pH values showed values above 7 for the first 40 m of the transect (Figure 4). In each field, there were no significant differences (P < 0.05) between the planted and fallow transects for either OC or pH.
3.1. Temporal Variation along Transects
Scaling of the CO2 fluxes to account for the temperature variation during the collection times removed some of the variation; however, there was still a large amount of variation within a transect as shown for DOY 191 along the soybean transect (Figure 5). Variation on DOY 191 was typical of all of the days we evaluated during this study. Temporal variation among days showed there was a variation among days and also between row and fallow positions (Figure 6).
Within both the corn and soybean transects, CO2 flux from the row positions was larger than the fallow positions. There was a large variation among the samples collected within each transect as evidenced by the large standard deviation about the means (Figure 6). Values for CO2 flux from the transects showed similar values to
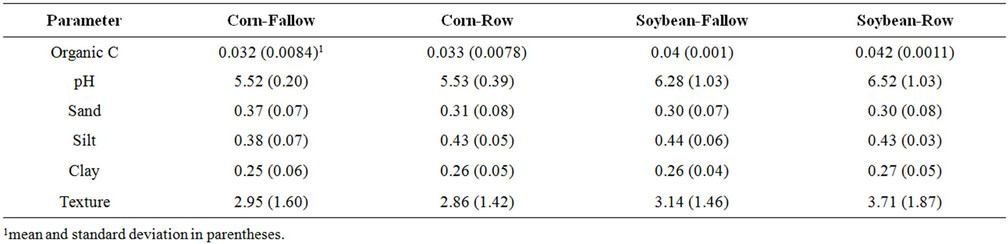
Table 1. Mean and standard deviations for soil properties along the corn and soybean transects.
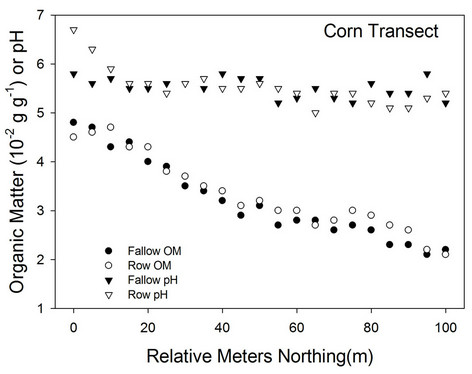
Figure 3. Spatial variation in organic C and pH along the two transects for the corn field in 2007.
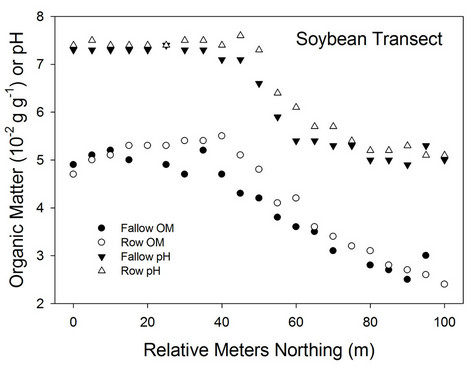
Figure 4. Spatial variation in organic C and pH along the two transects for the soybean field in 2007.
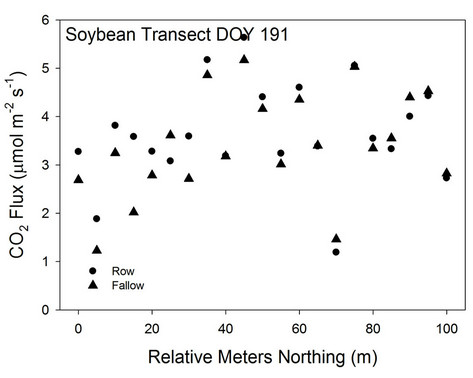
Figure 5. Variation in CO2 flux along the transects within the row and in the fallow portions of the transect on DOY 191.
those reported in previous research [2,10] for cropped surfaces. T-test between the two transects within a day showed that all days had significant differences except for the soybean data on DOY 218 (Table 2). In this study, CO2 fluxes from the corn rows were significantly less than from the soybean rows except for two days (Figure 6). This is different than reported by our earlier study [2]. Seasonal averages across all of the dates showed the CO2 fluxes from the corn row were 4.8 µmol m–2·s–1 and from the fallow transect were 2.5 µmol m–2·s–1 with slightly higher CO2 fluxes from the soybean row transect of 5.8 µmol m–2·s–1 and from the fallow transect of 3.1 µmol m–2·s–1. The ratios of the fallow transect to the row transect was 0.51 in the corn transects and 0.53 in the soybean transect showing a contribution from the roots of nearly half of the CO2 fluxes.
Variations between the row and fallow transects suggested that these differences may be related to the spatial differences in soil water content along the transects. There was a large difference along the transects as shown for a typical sequence for DOY 218 in the soybean field
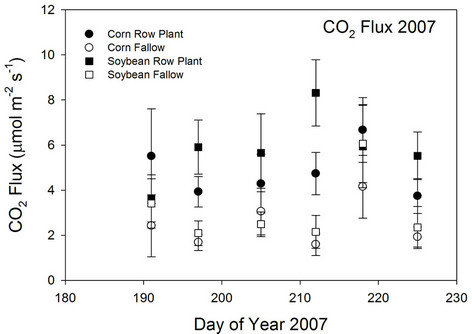
Figure 6. Temporal distribution of the CO2 flux from the corn and soybean transects collected from the row and fallow transects.
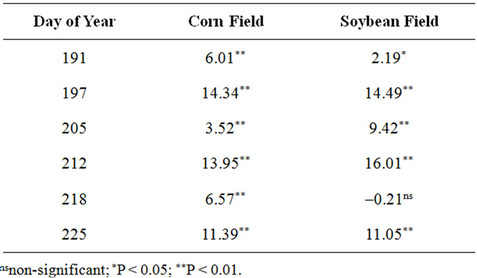
Table 2. T-tests of differences between row and fallow CO2 Fluxes collected from corn and soybean fields in central Iowa in 2007.
(Figure 7). Similar to the CO2 values there were significant differences among days and between the row and fallow position (Figure 8). There were significant differences between the row and fallow positions on some of the days and between the samples collected in the corn row vs. the soybean row; however, the fallow transects were not significant on all days (Table 3). Both the CO2 and soil water content values show a large amount of variation among days and within the transects (Figures 6 and 8).
3.2. Spatial Variation along Transects
To evaluate the spatial variation along transects and determine if there were consistent spatial correlation among the samples, we conducted analyses on the mean values of CO2 flux and volumetric soil water content over all of the sampling dates. Spatial analysis also included the soil properties collected along transects. Spatial analyses of
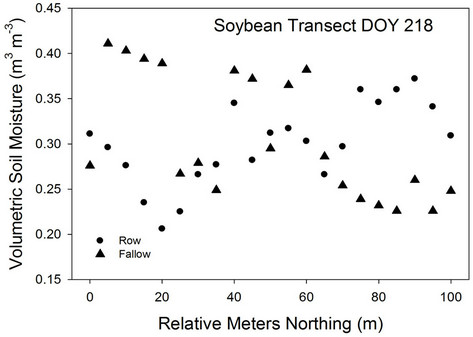
Figure 7. Spatial variation of volumetric soil water content along the row and fallow transect in the soybean transect on DOY 218.
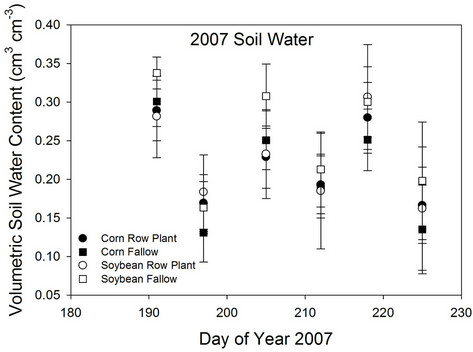
Figure 8. Temporal distribution of the mean and standard deviation of volumetric soil water content from the corn and soybean transects collected from the row and fallow positions.
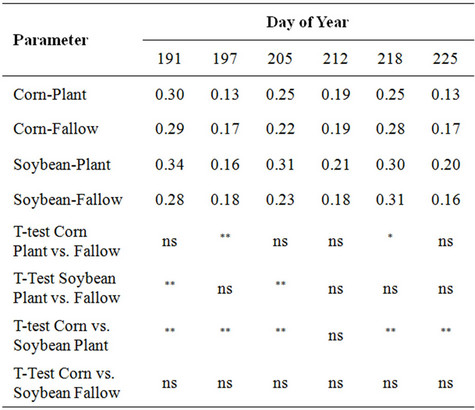
Table 3. Soil water content and T-tests for combinations of soil water content in the upper 0.1 m collected from the row and fallow positions in corn and soybean fields in 2007.
soil properties have been reported in other studies; however, there are no evaluations of the spatial variation of CO2 fluxes along transects. Reference [16] found organic C, pH, and total N showed a strong spatial dependence across two fields in central Iowa in a similar landscape to our study field. They observed a spatial dependence at lag distances of less than 100 m in these fields. There was a large amount of variation along transects even after the data were normalized. Reference [17] conducted a study observing the N2O emissions across hummocky terrain and observed a moderate spatial dependence with those values having a strong spatial dependence caused by the topography of site. Spatial analysis is often conducted across fields and within this study our transects were confined to a distance of 100 m to examine the spatial dependence along a transect within a field landscape.
Assessment of the spatial structure of the variability of the soil properties was done using semivariogram analysis. In the soybean field the variability associated with organic C, sand and pH exhibited strong spatial structure in both the planted and fallow transects (Figure 9). The variability associated with average scaled soil water content and CO2 flux appeared to spatially independent in the planted transect; however in the fallow transect variability of these parameters had spatial structure. In the corn field soil water the semivariograms of organic C and sand were similar to those observed in the soybean field (Figure 9).
However, variability of pH in the corn field transect that contained plants did not show strong spatial dependence. The spatial dependence of soil water content was weak in the transect with corn plants, and was stronger in the transect without corn. Like the soybean field, the variability of average scaled CO2 flux was spatially independent in the planted transect, but did show spatial dependence in the fallow transect. It would be expected that there would be a stronger relationship between the organic C and CO2 fluxes; however, in this study there was no consistent relationship over the different days. An explanation for this could be attributed to the fact that there are other factors affecting CO2 fluxes from the soil a singular relationship does not exist in these soils.
3.3. Relationship of CO2 Flux to Other Variables
At each position along the transect, observations were collected of air temperature, soil temperature at 0.05 m, and soil water content for the upper 0.06 m of the profile.
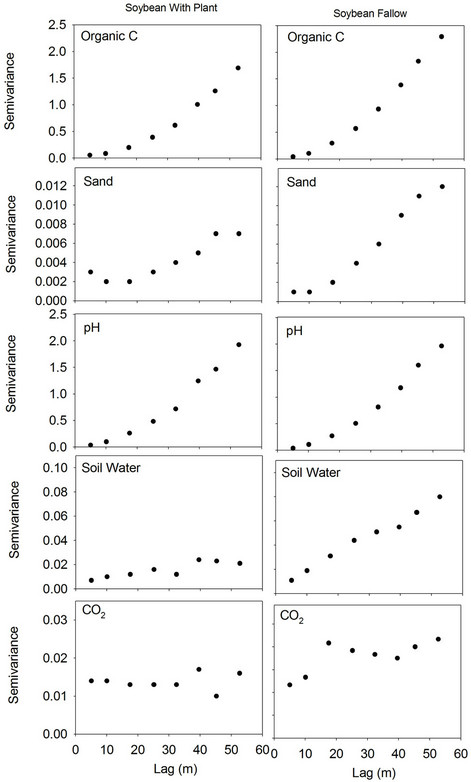
Figure 9. Semivariograms of organic carbon, sand, pH, soil water content, and CO2 flux along the with-plant and fallow transects in the soybean field. On each sampling date soil water contents and CO2 fluxes were scaled. The scaled values of soil water content or CO2 flux were averaged at each position over the season. The mean scaled values were used to compute the semivariograms.
There was minor variation in the observed values for these three variables along the transect and no significant spatial relationships were found for either corn or soybean fields. There were different patterns between soil water content in the row versus fallow transects. Since soil water content had been shown in previous studies to be the primary factor affecting soil CO2 fluxes we focused on soil water content in relation to CO2 flux. In the fallow transect for soybean there was a curvilinear relationship between the CO2 flux and soil water content with the maximum flux between 0.2 to 0.25 g·g–1 and declined as soil water contents increased (Figure 11). However, the scatter was very large for data from the fallow transect along with the row transect (Figure 12). There was a different pattern for the row observations for the soybean field with an increase in CO2 flux until soil
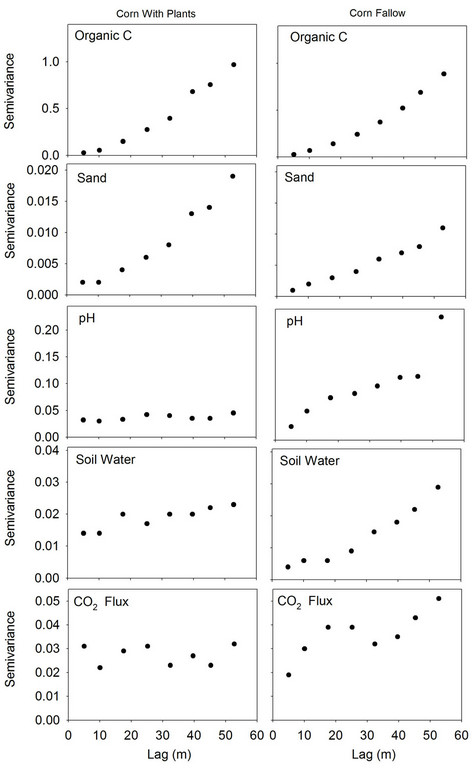
Figure 10. Semivariograms of organic carbon, sand, pH, soil water content, and CO2 flux along the with-plant and fallow transects in the corn field. On each sampling date soil water contents and CO2 fluxes were scaled. The scaled values of soil water content or CO2 flux were averaged at each position over the season. The mean scaled values were used to compute the semivariograms.
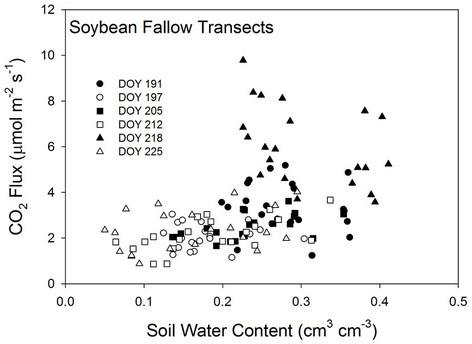
Figure 11. Variation of soil water content along the soybean fallow transects compared to CO2 fluxes collected during 2007.
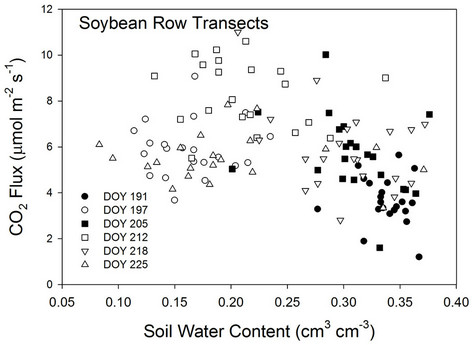
Figure 12. Variation of soil water content along the soybean row transects compared to CO2 fluxes collected during 2007.
water contents reached 0.25 g·g–1 and then there was no defined relationship and the observations had a very large amount of scatter (Figure 12). Similar results were found in the corn canopies and among the three variables; soil water content, air temperature, or soil temperature, only soil temperature exhibited some degree of a signifycant relationship.
When we applied an analysis of the number of samples required to detect a difference between the two transects within a crop, we found that a similar number of a minimum of 15 different observations were required to detect a difference. The number of samples required for these variables is the same as the CO2 flux data which suggests that although we didn’t see a significant relationship, there is a requirement for the same number of samples to be collected. However, within the fallow fields there was evidence of a spatial structure in the variability suggesting that a more rigorous approach would be to block the samples by landscape position and collect a series of samples at a distance of 10 - 15 m apart and use these samples to estimate a variance term.
Correlation analysis using the average CO2 fluxes revealed no consistent relationships among these variables (OC, pH, position, sand, and soil water content) (Table 4). It would appear that the CO2 fluxes are most closely related to the presence of plants from which we could infer root respiration is the primary factor causing the difference between the row and fallow transects and there was more root respiration from the soybean plants than the corn plants. This conclusion is supported by the semivariogram analyses, which indicate that the presence of living plants impacted the structure of the spatial variability of soil water and CO2 flux. The contributions of root respiration to total soil CO2 flux at each sampling times were estimated by subtracting the fallow CO2 flux at each position along the transect from the CO2 flux of the corresponding position in the planted landscape. Averages of the percentage contribution of root respiration in each field and on each sample day are presented in Table 5. When averaged over the sampling season, root contribution to total CO2 flux was approximately 50% in both
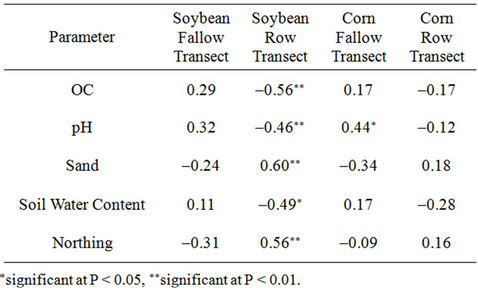
Table 4. Correlation values among soil parameters and average CO2 fluxes from the soil for corn and soybean fields within the row and in a fallow area along a transect in a central Iowa field.
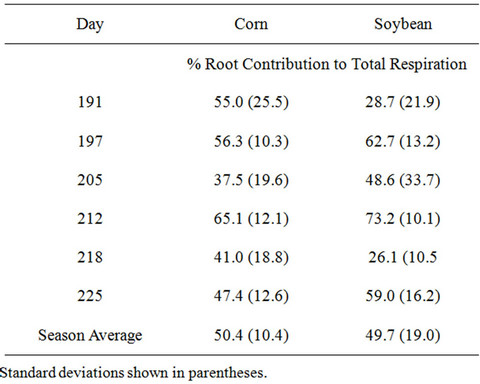
Table 5. Contribution of root respiration to total respiration.
both the soybean fields. These values are similar to those reported in other studies. In a study of root and soil respiration in corn plots, [18] found that approximately 30 days after planting, root-associated respiration accounted for approximately 10% of the total soil respiration, but 50 days after planting (DOY 195) root activity accounted for approximately 50% of the total soil respiration. These results were confirmed in a later study conducted on a different soil, where [19] report that for maize in eastern Canada, root respiration was negligible over the first 30 days from planting, but during the next 30 days of plant growth the contribution of root respiration increased linearly to a maximum of 45% and remained constant until plant senescence. Assessment of the partitioning of soil respiration between corn roots and soil-based processes performed by [20] showed similar results, with corn roots accounting for approximately 42% of the total soil respiration.
4. CONCLUSIONS
Spatial variation of CO2 flux from transects in corn and soybean canopies collected from both between the row and in a fallow area created by removing rows of plants and thus eliminating the effect of roots on soil respiration revealed that the row positions had signifycantly higher CO2 fluxes than the fallow transects. These data were scaled to account for the long time of data collection and the changing air and soil temperatures within the transects. There was no consistent spatial pattern to the CO2 fluxes except when the average values across all sampling dates were used and then there was only a significant spatial pattern in the fallow transects for both the corn and soybean fields. These analyses showed there was a random pattern at distances less than 25 m which means random samples could be collected within a short distance to characterize a field. There was no consistent pattern along the transects and observations of soil organic C, pH, sand, silt, and clay content showed no significant spatial pattern for these data. There were differences between the row and fallow transects for soil water content. However, the relationship of CO2 flux to soil water content was different for the row transect compared to the fallow transect. In both cases, there was a large amount of scatter in the data for the scaled CO2 flux data.
These observations show that random samples along short distances could be collected and used to quantify the field average; however, given the variation present in the data a minimum of 10 samples should be collected to precisely estimate the mean value of any of the parameters in these fields. We would recommend that collection of a large number of random samples would be useful to compare among treatment differences in agricultural fields.
5. ACKNOWLEDGEMENTS
We are grateful for efforts of Otis Smith, DeeAnn Hehr, Russ Parkin, Wolf Oesterreich, and Bert Swalla who collected and analyzed these data during this study. Without their dedication to providing valuable research support these studies would not be possible.
REFERENCES
- West, T.O. and Marland, G.A. (2002) Synthesis of carbon sequestration, carbon emissions and net carbon flux in agriculture: comparing tillage practices in the United States. Agriculture, Ecosystems and Environment, 91, 217- 232. doi:10.1016/S0167-8809(01)00233-X
- Parkin, T.B., Kaspar, T.C., Senwo, Z., Prueger, J.H. and Hatfield, J.L. (2005) Relationship of soil respiration to crop and landscape in the walnut creek watershed. Journal of Hydrometeorology, 6, 812-824. doi:10.1175/JHM459.1
- Buyanovsky, G.A., Kucera, C.L. and Wagner, G.H. (1985) Comparative carbon balance in natural and agricultural ecosystems. Bulletin of the Ecological Society of America, 66, 149-150.
- Baldocchi, D., et al. (2001) Fluxnet: A new tool to study the temporal and spatial variability of ecosystem scale carbon dioxide, water vapor and energy flux densities. Bulletin of the American Meteorological Society, 82, 2415-2434. doi:10.1175/1520-0477(2001)082<2415:FANTTS>2.3.CO;2
- Morell, F.J., Alvaro-Fuentes, J., Lampurlanes, J. and Cantero-Martinez, C. (2010) Soil CO2 fluxes following tillage and rainfall events in a semiarid Mediterranean agroecosystem: Effects of tillage systems and nitrogen fertilization. Agriculture, Ecosystems and Environment, 139, 167- 173. doi:10.1016/j.agee.2010.07.015
- La Scala Jr., N., Lopes, A., Spokas, K., Bolonhezi, D., Archer, D.W. and Reicosky, D.C. (2008) Short-term temporal changes of soil carbon losses after tillage described by a first-order decay model. Soil and Tillage Research, 99, 108-118. doi:10.1016/j.still.2008.01.006
- Khomik, M., Altaf Arain, M., and McCaughey, J.H. (2006) Temporal and spatial variability of soil respiration in a boreal mixed wood forest. Agricultural and Forest Meteorology, 140, 244-256. doi:10.1016/j.agrformet.2006.08.006
- Itoh, M., Kosugi, Y., Takanashi, S., Hayashi, Y., Kanemitsu, S., Osaka, K., Tani, M. and Nik. A.R. (2010) Temporal and spatial variations of soil carbon dioxide, methane, and nitrous oxide fluxes in a Southeast Asian tropical rainforest. Biogeosciences, 7, 6847-6887. doi:10.5194/bgd-7-6847-2010
- Maestre, F.T. and Cortina, J. (2003) Small scale spatial variation in soil CO2 flux in a Mediterranean semiarid steppe. Applied Soil Ecology, 23, 199-209. doi:10.1016/S0929-1393(03)00050-7
- Lee, J., Hopmans, J.W., van Kessel, C., King, A.P., Evatt, K.J., Louie, D., Rolston, D.E. and Six, J. (2009) Tillage and seasonal emissions of CO2, N2O and NO across a seed bed and at the field scale in a mediterranean climate. Agriculture, Ecosystem and Environment, 129, 378-390. doi:10.1016/j.agee.2008.10.012
- Hatfield, J.L., Jaynes, D.B., Burkart, M.R., Cambardella, C.A., Moorman, T.B., Prueger, J.H. and Smith, M.A. (1999) Water quality in walnut creek watershed: Setting and farming practices. Journal of Environmental Quality, 28, 11-24. doi:10.2134/jeq1999.00472425002800010002x
- Nelson, D.W. and Sommers, L.E. (1996) Total carbon, organic carbon, and organic matter. In: Sparks, D.L., et al., Eds., Methods of Soil Analysis. Part 3, SSSA Book Series, Madison, 961-1010.
- Matthias, A.D., Blackmer, A.M. and Bremner, J.M. (1980) A simple chamber technique for field measurement of emission of nitrous oxide from soil. Journal of Environmental Quality, 9, 251-256. doi:10.2134/jeq1980.00472425000900020017x
- Hutchinson, G.L. and Mosier, A.R. (1981) Improved soil cover method for field measurement of nitrous oxide fluxes. Soil Science Society of America Journal, 45, 311- 316. doi:10.2136/sssaj1981.03615995004500020017x
- Parkin, T.B., Doran, J.W. and Franco-Vizcaino, E. (1996) Field and laboratory tests of soil respiration. In: Doran, J.W. and Jones, A.J. Eds., Methods for Assessing Soil Quality, SSSA Special Publication, Madison, 231-245.
- Cambardella, C.A., Moorman, T.B., Novak, J.M., Parkin, T.B. and Karlen, D.L. (1994) Field-scale variability of soil properties in central Iowa soils. Soil Science Society of America Journal, 58, 1501-1511. doi:10.2136/sssaj1994.03615995005800050033x
- Yates, T.T., Si, B.C., Farrell, R.E. and Pennock, D.J. (2006) Probability distribution and spatial dependence of nitrous oxide emission: Temporal change in hummocky terrain. Soil Science Society of America Journal, 70, 753-762. doi:10.2136/sssaj2005.0214
- Rochette, P. and Flanagan, L.B. (1997) Quantifying rhizosphere respiration in a corn crop under field conditions. Soil Science Society of America Journal, 61, 466-474. doi:10.2136/sssaj1997.03615995006100020014x
- Rochette, P., Flanagan, L.B. and Gregorich, F.B. (1999) Separating soil respiration into plant and soil components using analyses of the natural abundance of carbon-13. Soil Science Society of America Journal, 63, 1207-1213. doi:10.2136/sssaj1999.6351207x
- Prueger, J.H., Hatfield, J.L., Parkin, T.B., Kustas, W.P. and Kaspar, T.C. (2004) Carbon dioxide dynamics during a growing season in Midwestern cropping systems. Environmental Management, 33, 330-343. doi:10.1007/s00267-003-9142-1