Agricultural Sciences
Vol.3 No.2(2012), Article ID:18379,8 pages DOI:10.4236/as.2012.32019
Agrometeorological wheat yield prediction in rainfed Potohar region of Pakistan
![]()
Pakistan Meteorological Department, Islamabad, Pakistan; *Corresponding Author: kazmi_dildar@yahoo.com
Received 4 December 2011; revised 30 January 2012; accepted 10 February 2012
Keywords: Potohar plateau; wheat yield prediction; agrometeorological parameters; SPSS
ABSTRACT
The reliable early estimates of production had always been the prime concerns of growers on one hand and planners as well as policy makers for import/export on the other hand. This study represents a linear regression model making use of meteorological parameters at critical stages of crop’s life cycle to predict the wheat yield about two months earlier than the harvesting. A statistical based software “Statistical Package for Social Sciences” (SPSS) and MS-excel were employed as working tools. Decadal (ten days) agrometeorological data for Rabi season (for the period 1993-2011) being observed at Regional Agromet Centre, Rawalpindi have been utilized. The parameters studied for correlation were mainly rainfall (amount and days), air temperature (minimum, maximum, mean), heat units (on phenological basis), relative humidity, wind speed, sunshine duration, reference crop evapotranspiration etc. Finally, minimum temperature, sunshine duration and rainfall amount in January (tillering and stem extension phase) proved to be the reliable predictors for the final yield. The correlation coefficients for these parameters on individual basis resulted within the acceptable range where as in aggregate it remained 0.87, an optimistic value.
1. INTRODUCTION
In Pakistan, the total cultivable area is 34.54 million hectares (Mha) (39.3% of total land area), of which 23.38 Mha is under cultivation. An area of approximately 4.22 Mha (4.8% of the total land area) is under forest cover. On average in Pakistan agriculture sector contributes about 25% to gross domestic product (GDP) and almost 44% of the country’s working force is being engaged directly or indirectly. The largest cropped area is under wheat cultivation, which is over 8.6 Mha [1].
Wheat is the major food crop and staple diet in Pakistan, grown under irrigated as well as rainfed conditions from October to April. Pakistan is basically an arid country and agriculture is mainly dependent upon canal irrigation. Although, the contribution of rainfed areas to national production is minimal (about 12%), yet it is the livelihood of local population. The Potohar plateau represents the rainfed areas of the north Punjab. The reliable early estimates of production had always been the prime concerns of growers on one hand and planners as well as policy makers for import/export on the other hand. Several attempts made by different scientists from diverse disciplines to forecast wheat yield much earlier than its maturity achieving has achieved partial success but not as much is done from agrometeorological aspect.
The HKH (Himalaya-Karakorum-Hindukush) frozen water reserves are the water tank over the roof whose operation is regulated with temperature. Unfortunately its thermostat has been tempered with global warming and it has started changing much of solid mass into liquid flowing downstream. Accelerated depletion of solid mass has been exposing threat to future generations by a paucity of this precious commodity essential for all the living creatures [2].
In case of wheat high temperature anomalies have been observed during January-April, resulting in rapid maturation of crop, and more rainfall in summer (especially late months) providing early wheat planting opportunities. Analysis of historical climate data indicated that there is opportunity for the improvements in wheat planting window and selection of wheat varieties/cultivars to be adjusted accordingly [3]. Recorded extreme events during the last decade of 20th century depict consistency in terms of intensity and frequency. The history’s worst drought with extremely high air temperatures and without snow cover during winter 2001, history’s worst flash floods on in July 23, 2001 in Rawalpindi/Islamabad due to Cloud burst, are the few sound evidences of increased intensity of extreme events [4]. The greatest and most unpredictable risks in the mountain areas are expected to come from more frequent extreme events, such as forest fires, floods, avalanches, and landslides. These extremes have also enhanced severe water losses due to changes in evaporation and precipitation patterns, and caused water needs to outstrip supply [5].
Being a prominent food crop, wheat is very important for any country especially for country like Pakistan, a source of staple food for the entire population. Pakistan is one of the top 10 wheat producers of the world. Wheat is grown almost all over Pakistan on about eight Mha in Rabi or winter season. Of this total area, about six million is irrigated and the rest is rainfed. Wheat, whose production determines the food security, claims three times the area and twice the value added share of the next two crops, cotton and rice, which are Pakistan’s two main export earners [6].
A large tract of the cultivated area falls under rainfed and depends on rainfall for crop production. Rainfed areas are mainly concentrated in Potohar Plateau, northern mountains and Baluchistan plateau forming the largest contiguous block of dry-land farming in Pakistan. Rain is responsible for the dynamics of underground water which is pumped for irrigation during dry spells to support crop growth and development.
In most parts of the Indo-Gangetic plains of India, where wheat is currently produced, climatic factors allow a potential yield between 12.0 and 19.5 tonnes per hectare. The potential is higher in the northwestern regions and adjoining Kashmir as compared to the eastern regions and is related to temperature, solar radiation and water availability during crop season. These results are based on the mean weather data and water requirement is varying from north to south of India. Therefore, small deviations in these estimates are possible at some locations due to climatic variability [7].
The life cycle of wheat crop in the plains of Pakistan approximately covers the period of October to April while in mountainous regions having October to May. Wheatgrowing in Pakistan is a gamble in high temperatures. After the monsoon, the sowing of wheat is regulated by the point reached in the gradual cooling of the seed bed. Towards harvest, the crop has to ripen under a rapidly ascending temperature when hot dry winds are frequent. At both ends, therefore, the growth period is temperature limited, a fact which not only restricts the choice of varieties to early maturing types, which grow rapidly, but also influences the geographical distribution of the crop [8].
Barani (rainfed) crop production is relatively more risky due to climatic constraints as such farmers are conservative in use of inputs on their crops. The scarcity as well as variability of rainfall over the temporal and special scale is its main reason. Water stress at reproductive stage retards the growth and also adversely affects the yield of the wheat crop [9]. Rainfed area contributes only about 12% of the total wheat production of the country. The Punjab province contributes over 71% of the national wheat production while the Punjab Barani tract contributes 25% of the wheat production in the province. The Potohar plateau represents the rainfed areas of the northern Punjab [10]. Under developed countries are mainly affected by the variable weather pattern and climate change. These are the regions like monsoon affected areas and ENSO affected areas, which have high rates of seasonal variations in weather. Because of this anomalous behavior of weather and climate, they are prone to face economic crises like food security etc. [11].
2. AREA OF STUDY
The Potohar plateau is bounded in the north by the Kala-Chitta and the Margalla ranges, in the east by the Jhelum River, in the south by the Salt Range and in the west by the Indus River. It has an elevation of about 500 to 1000 m above the mean sea level (MSL). Most of the area of the plateau slopes from north to east and drains through the Soan River into the Indus River. However, the south-eastern portion of the plateau slopes towards the east and drains into the Jhelum River.
In the east and south, the boundaries of the basin are connected to Sohawa-Chakwal, Choa Saidan Shah-Kallar Kahar Sections and Mianwali Area. The major cities and towns in the area are Islamabad, Rawalpindi, Murree, Chakwal, Talagang, Pindi Gheb and Kahuta [12]. The tehsils (administrative unit) of Rawlpindi District are Murree, Kahuta, Taxilla, Kotli Sattian and Gujar Khan.
Rawalpindi is an important meteorological station of Potohar plateau, located in the northern Punjab. The plateau represents the rainfed areas of the north Punjab which lies in the track of summer monsoon as well as winter rainy systems (Figure 1). Although the winter rains in the region are lower in quantity as compared to the summer rains, but they impose a positive impact on Rabi crops like wheat. Winter rains occur at lower intensity in longer wet spells, allowing most of the water to be absorbed by the soil and leaving negligible amount for runoff. The region is not fed by any big or small river, therefore the farming is completely dependent on rainfall. The farmers of this area are not much rich to manage their water demands by alternate ways.
3. MOTIVE AND OBJECTIVES
Since the start of crop sowing the farmers have great concern in knowing the quality and quantity of their yield (grain yield or economic yield) as early as possible before the harvesting stage. It is considered beneficial or
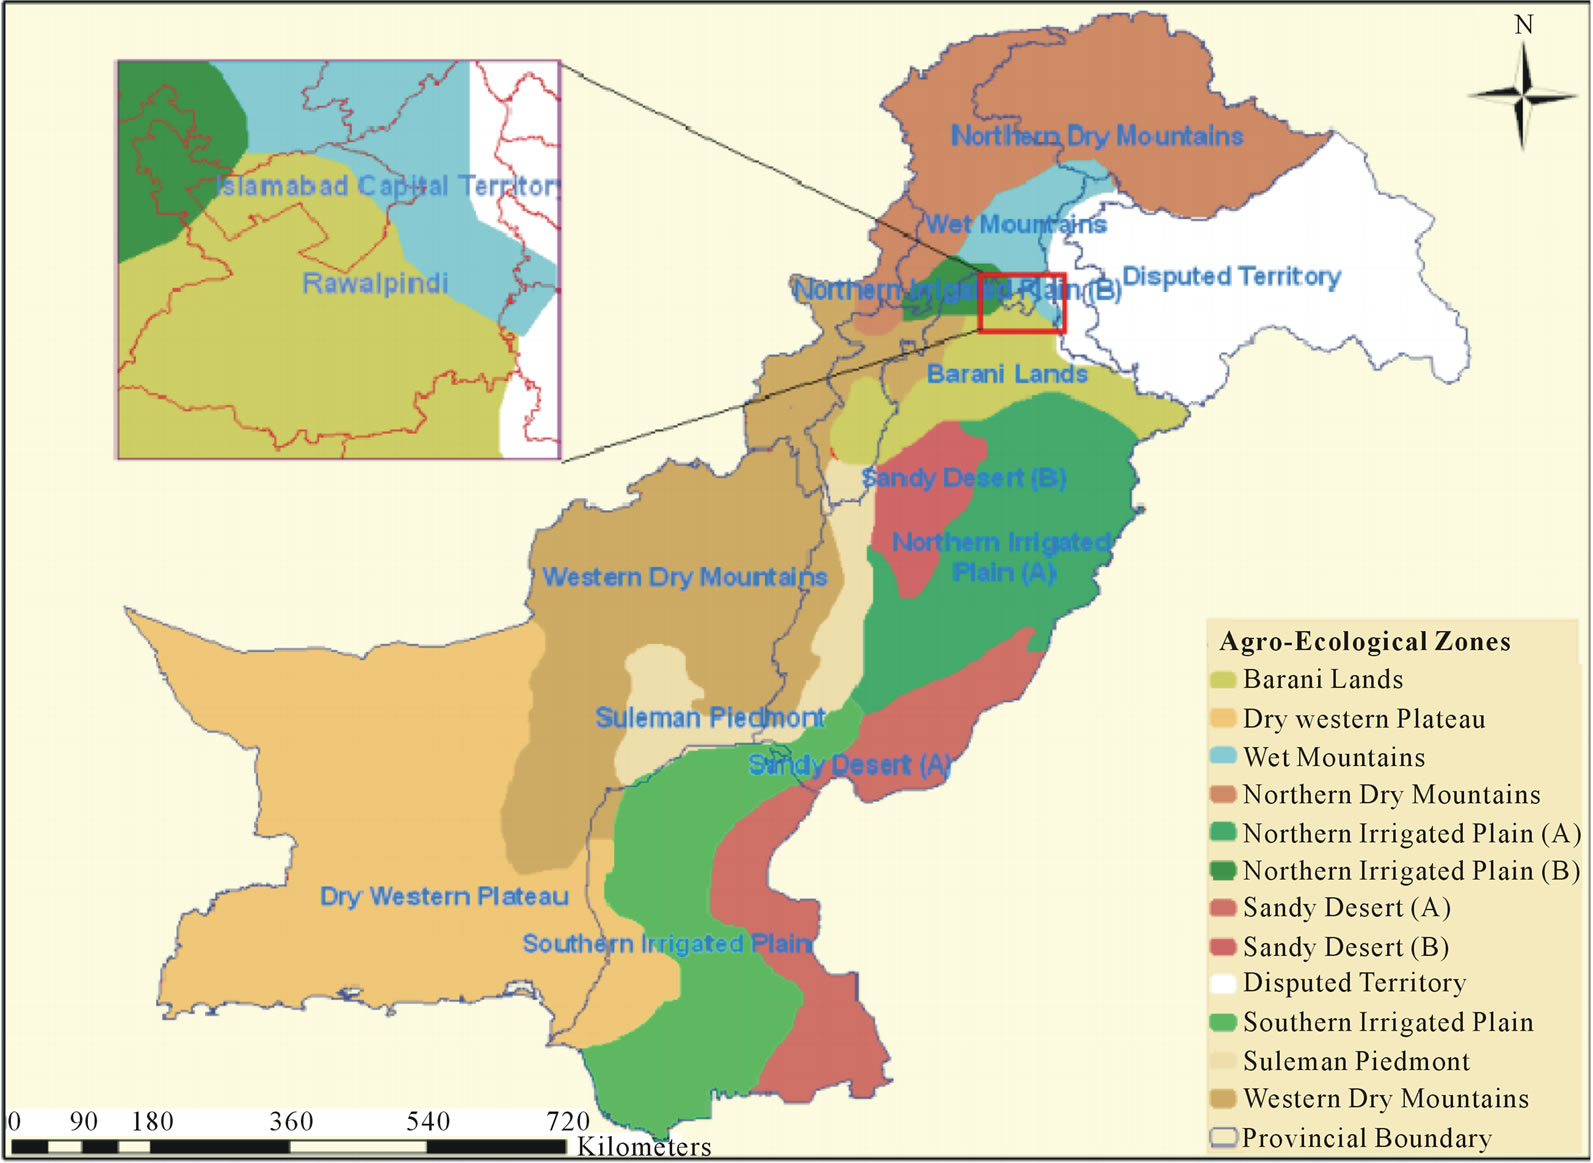
Figure 1. Agro-ecological zones of Pakistan [13].
fruitful that yield prediction should be made at least two months earlier than maturity. This may be for the early assessment of food demand of farmer’s family at smaller scale to the demands of a country at a wider scale. It becomes the need of the hour to predict the size and quality of harvests of the cereal crops specially, which remains the best source of food all over the world. Knowing in advance the expected yield of cereal crops like wheat, the policy makers can be able to make better policies in the national interest, keeping in view the part of the foreign exchange to be spared for import of any commodity if necessary.
Internationally much work has been done in the field of yield prediction by using meteorological and agronomic parameters. But area as well as crop specific study in a systematic way for Potohar region has not been initiated so far. Also all the relationships or equations which have already been worked out are either very complex or they require a huge amount of data for many kinds of agrometeorological parameters. Such kind of data may not be available at a smaller observing station. It is also highly desirable that, the wheat yield prediction for this specific region should be made by the end of February positively. So that, the planner and farmers of rainfed areas (Potohar) could manage their harvests for domestic consumptions and also for export in case of surplus as well as timely import if yield drops to meet the annual requirements.
In general weather parameters have impacts on a grown crop and consequently the final yield. But this impact is more pronounced in rainfed areas as water is the limiting factor. There are a number of correlations already developed regarding weather pattern and the crops growth or final yield. But specifically for the rainfed region of Pakistan, no significant effort has been made so far. Keeping in view this situation an effort has been made to work out a simple weather-yield (wheat) relationship.
4. METHODOLOGY
Decadal (ten days) agrometeorological data for the last 17 years, pertaining to Rabi season (from 1993-2011) recorded at Regional Agromet Centre (RAMC), Rawalpindi have been utilized. Wheat crop during 2009-2010 was totally failed due to prolong drought conditions in the region, for that reason it has been excluded from the study. In that particular season timely sowing as well as some early & significant stages of the crop badly affected due to persistent drought in the area. Rabi season in Potohar extends from November to April corresponding with winter rains from December to March. At an RAMC, the meteorological data is recorded thrice a day i.e. 0300, 0900 & 1200 UTC. Yield data recorded at National Agricultural Research Centre (NARC) and RAMC, Rawalpindi have been used in this study. The approach employed is purely statistical. For statistical analysis MS-Excel and SPSS software were employed.
Initially all the available agrometeorological data was analyzed individually on monthly as well as decadal (ten days) basis. The parameters studied for correlation were mainly rainfall (amount and days), air temperature (minimum, maximum, mean), heat units (on phenological basis), relative humidity, wind speed, sunshine duration, reference crop evapotranspiration (ETo) etc. On identification of a good correlation between the weather parameters and wheat yield, multiple regressions were employed to draw a equation for simplicity.
Rainfall is considered most important factor than rest of the meteorological parameters in driving the growth and ultimately the final yield of wheat crop. But from the statistical data analysis it is found that some other parameters like decadal minimum temperature and decadal sunshine duration are also very important. From the analysis of 17 years data, it is found that some decades of January & March are very important regarding rainfall, minimum (or night) temperature and sunshine duration.
Multiple Correlations by “SPSS” Model
SPSS is a data analyzing software through which different types of data may be analyzed on statistical basis, like in MS-Excel. In this study, the yield prediction of wheat on meteorological basis was the main intention, therefore this model is utilized to find out the yield predictors. The approach was to investigate which of the meteorological parameters are the prominent contributors towards the final wheat yield. For this purpose the decadal based agromet data of last 17 years for Rabi months i.e. November to April (which has shown significant correlation with wheat yield) fed as input for the model. The yield data (Kg/Ha) treated as dependant variable and the method employed is linear regression.
1) Linear Regression estimates the coefficients of the linear equation, involving one or more independent variables, which best predict the value of the dependent variable [14].
The model’s output is shown here in which the following abbreviations are used:
RAIN.J2 = Rainfall in millimeters for 2nd decade of January (1994-2011).
SSH.J3 = Total sunshine hours for 3rd decade of January (1994-2011).
Tmin.J1 = Mean minimum temperature for 1st decade of January (1994-2011).
The value for R2 (correlation coefficient) shows how strong is the correlation held between a predictor or independent variable and the dependant. The sign of R indicates the slope of the regression line. If the correlation coefficient is close to 1, it shows a very good correlation and its values above 0.49 are considered acceptable. It can be seen in table 1 that all the values for R2 on individual as well as aggregate basis lie within the acceptable range, touching 0.87 which is very optimistic. Therefore the above predictors can be used for drawing a regression equation.
2) Regression equation After analysis a simple linear equation has been determined, which may be a useful tool for yield prediction of wheat crop in the region.
Y = a × X1 + b × X2 + c × X3
+ Constant/Adjusting factor where Y = Yield in Kg/Hectare, X1 = Sunshine Hours during 3rd decade of January;
X2 = Min Temperature during 1st decade of January;
X3 = Sunshine Hours during 1st decade of March.
Note: values for the coefficients “a”, “b”, “c” and constant are as given in SPSS output file.
5. RESULTS AND DISCUSSION
In this section the most significant analyses are being discussed. Also only those correlations are being highlighted which show their significance for correlations by the SPSS model.
5.1. Correlation between Rainfall and Wheat Yield
Rain is considered an important driver behind the growth and development of wheat crop in rainfed as well as irrigated conditions. In rainfed areas the crop is completely dependent on rain, since land preparation to the time of maturity. In irrigated fields rain provides clean environmental conditions to support optimum photographic activity for better biomass and grain yield. As every crop requires water for its life cycle to move on smoothly, but in rainfed areas like Potohar the only source of water is rain. Therefore, its importance is more
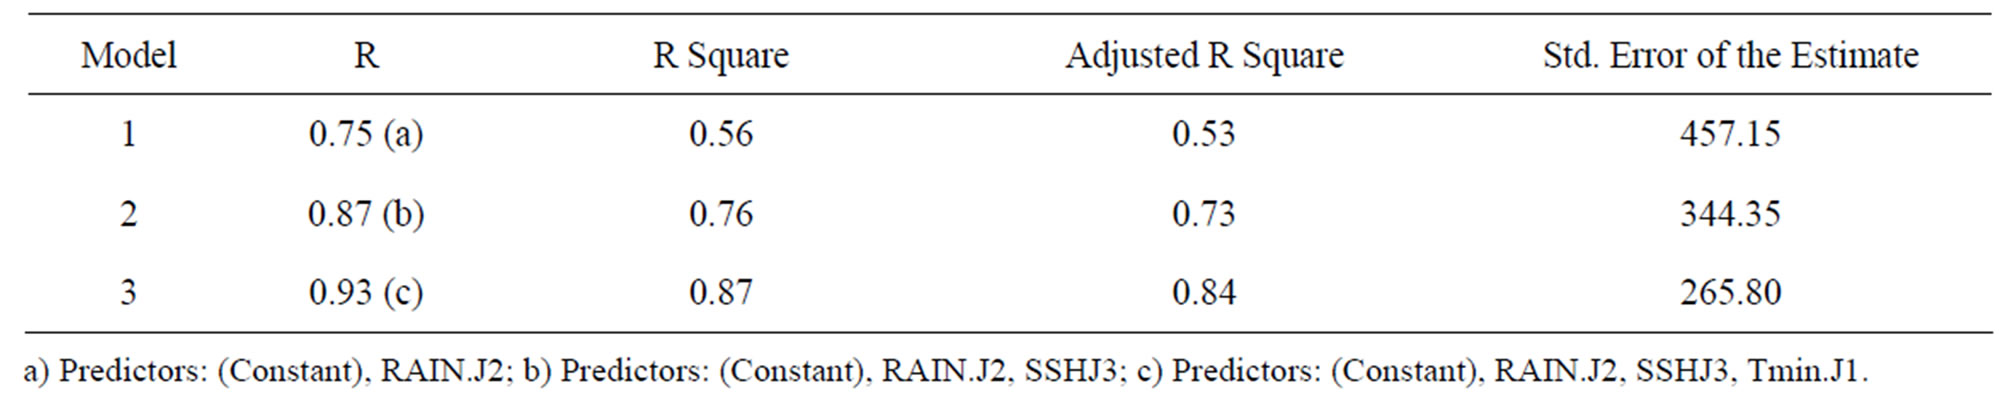
Table 1. Regression values for predictors, from output file of SPSS.
pronounced in these areas for a prominent cereal and cash crop like wheat.
Luckily, Potohar is situated in the track of summer monsoon currents and winter monsoon systems as well. As a result generally optimum rains occur throughout the year. In this area normally about 60% of the annual rain occurs during summer monsoon while about 40% rain occurred during winter when wheat is grown [15]. Higher rainfall variance seems to be the main factor behind dryland yield fluctuations. Amount and distribution of rainfall in time and space during a crop season are very important. Distribution of rainfall becomes more significant for the lands with low water holding capability and also in the seasons with adequate soil moisture available at planting [16].
Rainfalls during 2nd decade of January during the study period have shown very good correlation with wheat crop or yield (figure 2). It is a surprising result that fewer rains in the 2nd decade of January may produce good yield in the end. It might be because of the photosynthesis, as prevailing cloudiness hinders this activity and dry matter production remains low which results in lower yields. Although, it is well known fact that the most critical stage of wheat is reproductive phase when a little shortage of water results into significant deficit in yield, yet the tillering phase is also equally sensitive to precipitation in reverse order.
5.2. Correlation between Minimum Temperature and Wheat Yield
There are many disadvantages of freezing temperatures like the decrease in photosynthesis and decrease in the discharge of Carbon Dioxide from the leaves etc. In fact, mild frosts are not so dangerous for green plants but severe frosts can cause leaf’s death. Also the cold is considered more dangerous to the plants growth at earlier stages and in turn to the final yield at more advanced stages. Dormancy period may be produced some time in the crop’s life cycle, if very low temperatures below biological zero sustained for many days. Low minimum temperatures in January are considered very important. For wheat crop, low temperatures at early stage i.e. in January are favourable for tillering process. Due to low temperatures areal vegetation retards and new tillers from the root-buds appear. Greater number of tillers per plant means greater spikes/grains and higher yield per hectare. In other words, increase in the number of plants per unit area results into higher economic yields both in terms of grain and hay weight. Both these facts make the dependence more complex, resulting into poor correlation.
In Potohar region the frost phenomena is generally observed during the month of January, best indicators for coldness. Therefore, minimum temperature is analyzed on decadal basis as monthly value cannot show the requisite picture of its impact on wheat growth. It can be seen that whenever it remained 2˚C or above the final yield produced good or above normal (Figures 3(a) and (b)). Therefore, we may conclude, if minimum temperature stays at 2˚C or higher, good yield may be expected. But this theory (minimum temperature verses yield) may be better explained by the multiple regression method through SPSS model.
5.3. Correlation between Sunshine Duration and Wheat Yield
Duration of bright sunshine hours (or generally sunshine hours) is also very important factor relative to the
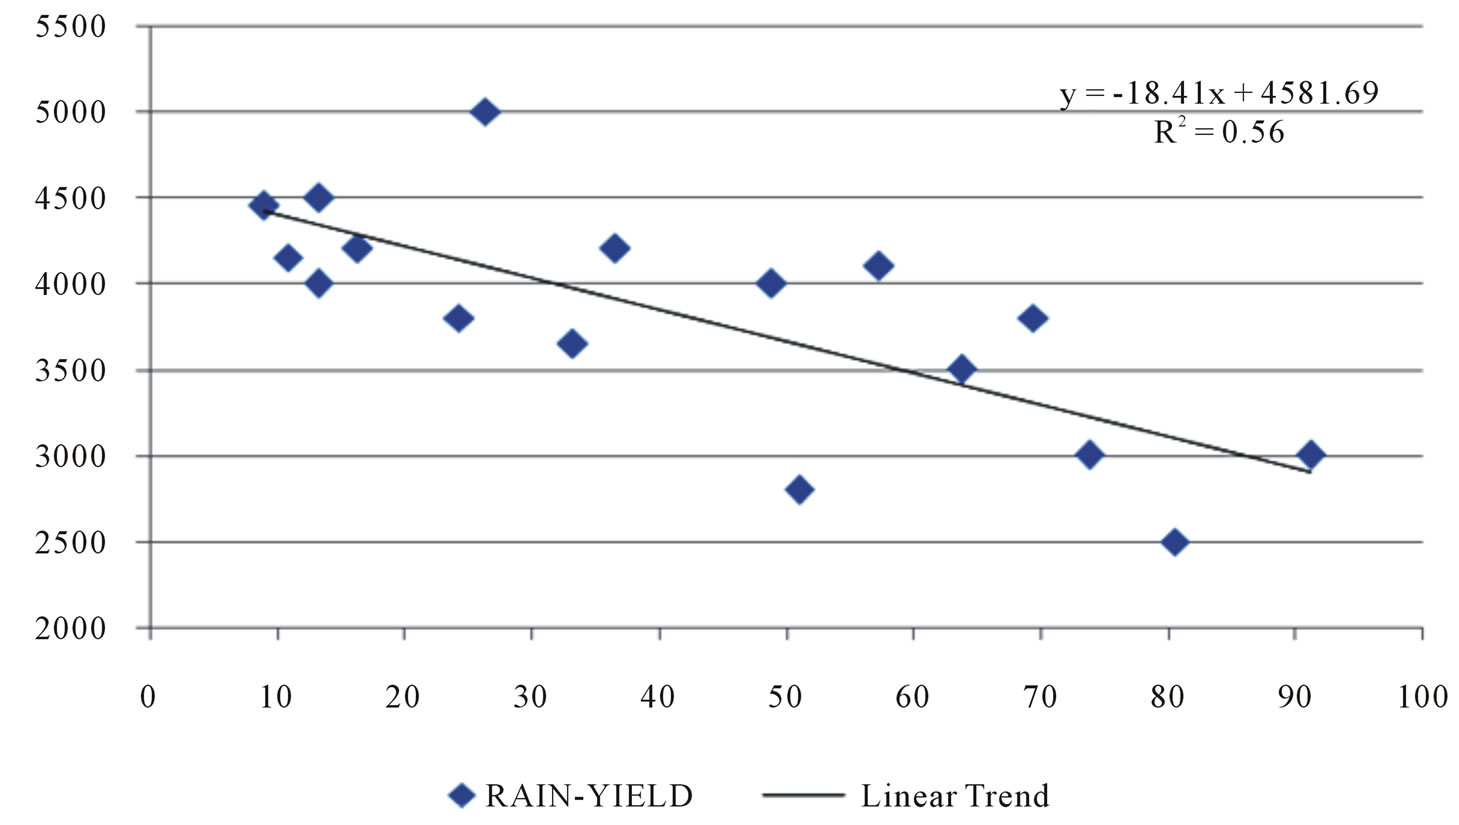
Figure 2. Rainfall (mm) during 2nd decade of January verses wheat yield (Kg/Ha) obtained for the period 1994-2011.
 (a)
(a)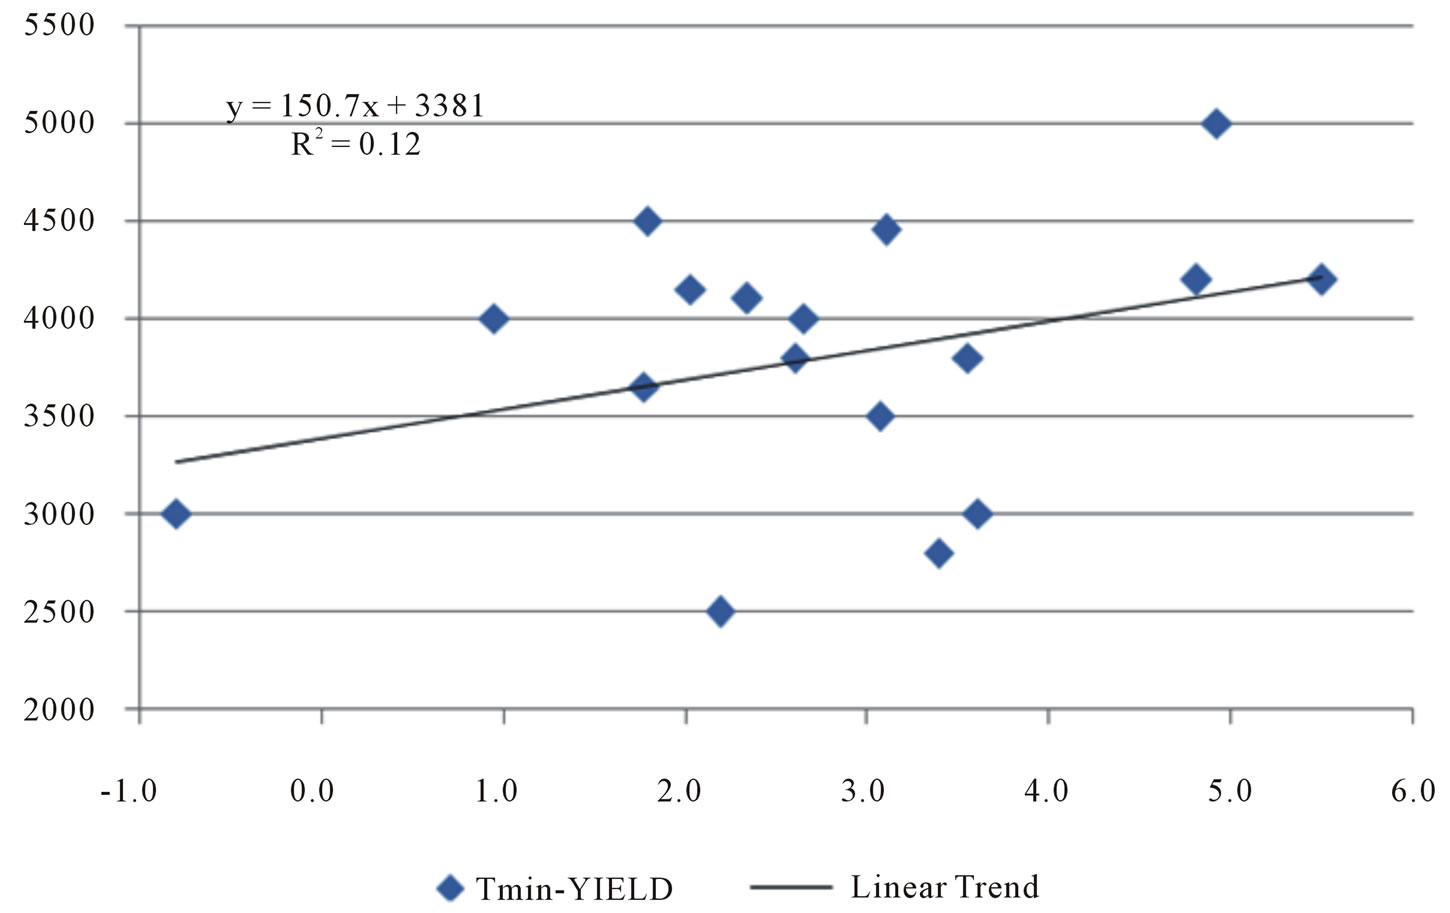 (b)
(b)
Figure 3. Comparison of mean minimum temp (˚C) during first 10 days of January verses yield (Kg/Ha) in corresponding year during 1994-2011 (a) and correlation between yield and the minimum temperature during first decade of January (b).
final yield, as they affect greenery or water contents directly. It plays a major role in driving temperature and consequently ETo in the particular area. And it is a well known fact that temperature and ETo are very important factors for the growth of any crop, especially in rainfed areas. Also photosynthesis process (a key player for healthy growth of a crop) is mainly dependant on good sunshine and less cloudiness. That is why sunshine hours are included in the discussion and being examined on decadal basis against the final yield produced during last 17 years. For better elaboration the dependency of the final crop on sunshine hours, regression method is once again being employed.
On the 17 years data base we can say that for a better final yield of wheat crop sunshine for long durations is desirable during the 3rd decade of January. It is evident from the figure 4, that when the sunshine duration remains higher during 3rd decade of January a better yield produced at the end. The situation suggests that clear skies at this stage are desirable which increase the day

Figure 4. Sunshine hours during 2nd decade of January verses wheat yield obtained for the period 1994-2011.
time temperature and drops the night time temperature.
5.4. Linear Regression and Yield Estimation
Weather and crop’s growth relationship is significant at some particular phenological stages. It is the weather which may be used as an input for the purpose of yield prediction in crop modeling, rather than the climate. Prediction of seasonal weather is indeed a hard job but it can be used as input for a crop model. After establishing a relation between the seasonal weather pattern and the yield obtained, a better modeling may be carried out [11]. It is a well known fact that the months of January and February are very important for wheat crop in this area. These are the months during which tillering stage of wheat is in action for this region. Later on the heading, shooting and reproductive stages are the most significant stages in life cycle of wheat crop. Favorable temperature conditions for wheat at heading give rise to higher number of grains per spike and let the grain to gain proper size and weight under optimal water supply, consequently good yield may be expected at the end [17].
There are some meteorological as well as agronomic parameters considered significant for wheat crop and ultimately the final yield. Taking all such kinds of available meteorological parameters whether they were observed directly (min/max temperature, rainfall, relative humidity, sunshine hours, wind velocity etc.) or calculated (heat units, ETo etc.), analysis was made on monthly and decadal basis. But surprisingly only a few of them were found playing significant role in affecting final wheat yield.
After data analysis by SPSS and MS-Excel, the month of January is found to be the most significant for yield prediction of wheat. Rainfall, minimum temperature and sunshine duration for different decades of the month are found predictors for the final yield in the end. Through SPSS model a simple linear equation has been determined for wheat yield prediction in the area. It can be seen from Figure 5 that simulated or projected values are very close to the observed actual values for yield.
The accuracy rate remained generally above 90% in hind cast experiment and only once in 2007-2008 this remained 88%, during the last 17 years period. Although there may be a number of agronomic and meteorological reasons behind this slightly lower rate of accuracy during the particular Rabi season (2007-2008), yet it is significant at 95% and 99% confidence levels. The sunshine duration and minimum temperatures remained the highest with almost average rainfall, as compared to the rest of the seasons. That is, in this particular season, two of the three predictors were at their extreme i.e. minimum temperature and sunshine duration. The model could not incorporate the influence of these extremes effectively to evaluate the relevant yield up to the mark. This unusual situation may be the reason for under-estimation of yield by SPSS in this cropping season.
6. CONCLUSION
It is important to note that in scientific research, significance level of 0.05 (confidence level of above 95%) considered as an upper limit [18]. For the considered period all the values for significance are less than 0.05 or in other words confidence levels remain higher than 95%, almost 99% or above. Therefore, it can be said that the equation drawn after running the SPSS is valid for the yield prediction with 99% confidence level. Also the data for these meteorological parameters is easily available, therefore this simple linear regression model can be considered as a better tool for wheat yield prediction in rainfed Potohar plateau of Pakistan. Same technique may

Figure 5. Projected and obtained wheat yield (Kg/Ha) for the period 1994-2011.
be tested for other rainfed areas and after verification through hind cast, it can be put in operation.
REFERENCES
- GoP. (2008) Economic Survey of Pakistan (2007-08). Ministry of Finance, Government of Pakistan, Islamabad.
- Rasul, G., Dahe, Q. and Chaudhry, Q.Z. (2008) Global warming and melting glaciers along southern slopes of HKH range. Pakistan Journal of Meteorology, 5, 63-76.
- Aslam, A., Asim, M., Meinke, H. and Kisana, N.S. (2004) Applying climate information to enhance wheat based farming in rain-fed areas of Pakistan, New directions for a diverse planet. Proceedings of the 4th International Crop Science Congress, Brisbane, 26 September-1 October 2004. www.cropscience.org.au
- Chaudhry, Q.Z., Sheikh, M.M., Bari, A. and Hayat, A. (2001) History’s worst drought conditions prevailed over Pakistan. http://www.pakmet.com.pk/journal/historworstdrought2001report.htm
- IPCC. (2001) Climate change 2001. The scientific basis: Third assessment report. Intergovernmental Panel on Climate Change, Geneva.
- Dowswell, C. (1989) Wheat research and development in Pakistan. Collaboration Program, Pakistan Agriculture Research Council/CIMMYT, Islamabad.
- Aggarwal, P.K., Talukdar, K.K. and Mall, R.K. (2000) Potential yields of rice-wheat system in the Indo-Gangetic plains of India. Rice-Wheat Consortium for the IndoGangetic Plains, New Delhi.
- Howard, A. (1924) Crop production in India: A critical survey of its problems. Oxford University Press, Oxford.
- Rasul, G. (1993) Water requirement of wheat crop in Pakistan. Journal of Energy and Applied Sciences, 12.
- Rashid, M., Bashir, S. and Akhtar, K. (1998) Plant nutrient management under rainfed conditions. Proceedings of Symposium on Plant Nutrition Management for Sustainable Agricultural Growth, Islamabad, 8-10 December 1997.
- Challinor, A.J., Slingo, J.M., Wheeler, T.R., Craufurd, P.Q. and Grimes, D.I.F. (2003) Toward a combined seasonal weather and crop productivity forecasting system: Determination of the working spatial scale. Journal of Applied Meteorology, 42, 175-192.
- Sheikh, A.A., Ashraf, M. and Bahzad, A. (2007) Assessment of water resources and development of strategic water utilization plan in Region for its sustainable management. Pakistan Council of Research in Water Resources (PCRWR), Islamabad.
- PARC. (1980) Agro-ecological regions of Pakistan. Pakistan Agricultural Research Council, Islamabad.
- SPSS-13.0 (2004) Tutorial for SPSS-13.0 software.
- Chaudhry, Q.Z. (1991) Analysis and seasonal prediction of monsoon in Pakistan. Ph.D. Dissertation, University of Philippines, Quezon City.
- Pratley, J. (2003) Principles of field crop production. Oxford University Press, Oxford.
- Kazmi, D.H. and G. Rasul, (2009) Early yield assessment of wheat on meteorological basis for Potohar Region, Pakistan Journal of Meteorology, 6, 73-87.
- Muhammad, F. (2000) Statistical methods and data analysis. Kitab Markiz, Faisalabad.