International Journal of Geosciences
Vol.3 No.5(2012), Article ID:24938,7 pages DOI:10.4236/ijg.2012.35104
Interaction Properties of Geosynthetic with Different Backfill Soils
Department of Environmental Science & Technology, Mie University, Tsu, Japan
Email: *mbhfsbau@gmail.com
Received August 22, 2012; revised September 25, 2012; accepted October 21, 2012
Keywords: Geosynthetic; Toyoura Sand; Direct Shear Test; Interface Shear Strength; Dilatancy Behaviour
ABSTRACT
Characterization of a geosynthetic is necessary for its effective use in various field application of reinforced soil structure. In this paper, a new type of geosynthetic has been evaluated for its interaction properties for different backfill soils using direct shear device. The test results are compared based on the type of soils, inclusions, and interface mechanical properties. Three backfills soils (sandy, clayey, and pure sand) in combination with four different geosynthetics (one geotextile and three geogrids) were tested at various loading conditions in direct shear. Test results reveal that the stress-deformation behaviour of the geotextile and geogrid interfaces with sandy and clayey backfills can be defined as hyperbolic. For the pure sand-geogrid interfaces, the relationship is followed by displacement hardening and softening behaviour. The dilatancy behaviour of a particular soil-geosynthetic interface is found similar at all normal stresses. Both contractive and dilative nature is observed for the interfaces with pure sand. On the contrary, only negative dilatancy or contractive behaviour is observed for sandy and clayey backfills with the same geosynthetics. The test results reveal that the relationship of the interface shear strength with the normal stress is not linear in most cases. Based on the test results, a simplified nonlinear equation is proposed for the soil-geosynthetic interface shear strength envelops which was in good agreement with the experimental data.
1. Introduction
The practice of reinforcing the soil with various tensile inclusions has been widely implemented in geotechnical engineering for the last few decades. The interaction between soil and reinforcement is of utmost importance for the design and performance of reinforced soil structures, and this interaction can be very complex depending on the nature and properties of the reinforcement. Various types of geosynthetic materials have been used for soil reinforcement including geotextiles (woven and nonwoven), geogrids and geocells. Whatever the reinforcement and backfill materials are used for the design of a reinforced soil structure, the interaction properties of soilreinforcement interface play an important role. The interaction mechanism between the reinforcement and the soil can be classified into two types; sliding of soil over the reinforcement and pullout of reinforcement from the soil [1]. The direct shear and pullout tests are widely used methods to study quantitatively these interaction mechanisms.
Practically, the direct shear test is a suitable mean to study the interaction between soil and reinforcement because it can simulate the shear mechanism along a potential failure plane in reinforced earth structure. Proper representation of the soil-geosynthetic interfaces under direct shear mode is also important for numerical simulation of the deformation response for retaining structures.
The shear strength of soil-geosynthetic interfaces has been investigated using direct shear tests by a number of researchers [1-8]. They used various types of geosynthetic materials like High density polyethylene (HDPE), poly propylene (PP), Polyester (PET) yarns coated with PVC, etc. The present study dealt with a new type of geosynthetic which is made from basalt fiber. A series of direct shear tests on the geosynthetic interfaces with different type of backfill soils have been conducted in the laboratory. Based on the test results, the stress-displacement behaviour of the interfaces along with different mechanical characteristics has been evaluated and discussed briefly.
2. Materials and Methods
2.1. Backfill Materials
Three types of soils were used as backfill material in this study. Air-dry pure silica sand named as Toyoura sand, one sandy and one clayey soil have been used to evaluate the interface behaviour with the same geosynthetic materials. Before conducting the interface direct shear tests, the physical properties of the soils were tested in the laboratory. The tests of physical properties reveal that Toyoura sand has no fine content less than 0.075 mm with effective diameter D10 of 0.01 mm, D30 of 0.15 mm, D60 of 0.19 mm, the uniformity coefficient (Cu) of 15.45, and the coefficient of curvature of the gradation curve (Cc) of 9.89. The specific gravity, maximum and minimum void ratio are Gs = 2.64, emax = 0.98 and emin = 0.61, respectively. The water content of sand was less than 1%, which corresponds to air-dried condition. The optimum water content of sandy and clayey soils was 12% and 15%, respectively. Figure 1 represents the gradation curves of the experimental soils. According to JGS engineering classification system, the sandy and clayey soils are classified as SF and CL, respectively. The major physical properties of the soils are listed in Table 1.
2.2. Geosynthetic Specimens
One woven geotextile and three geogrids, made of Basalt fiber, are used in this study. These materials possess good property of elasticity and stretch tension with good resistance to acid, alkali, heat and vibration. It has also
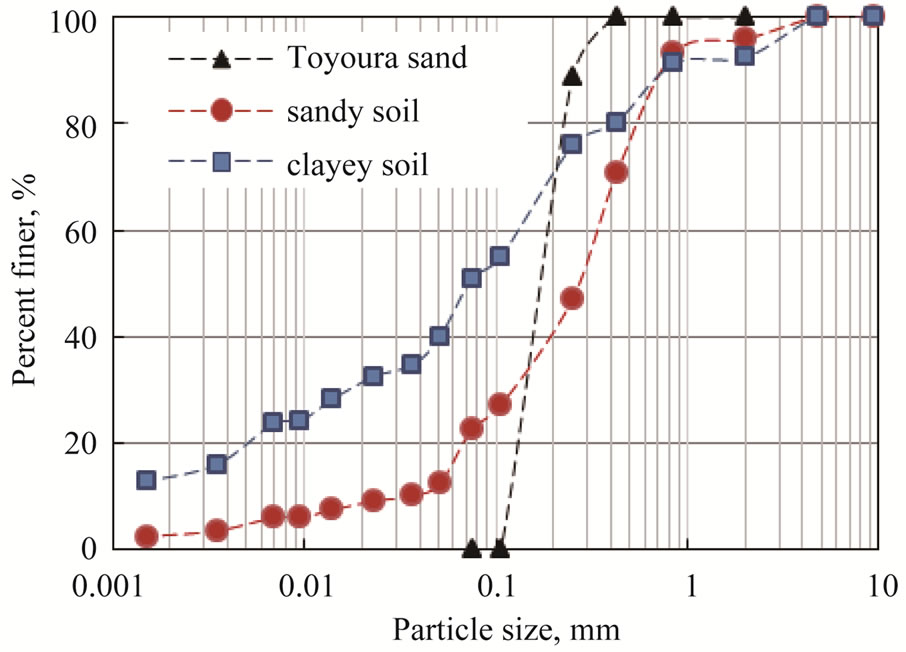
Figure 1. Gradation curve of experimental soils.
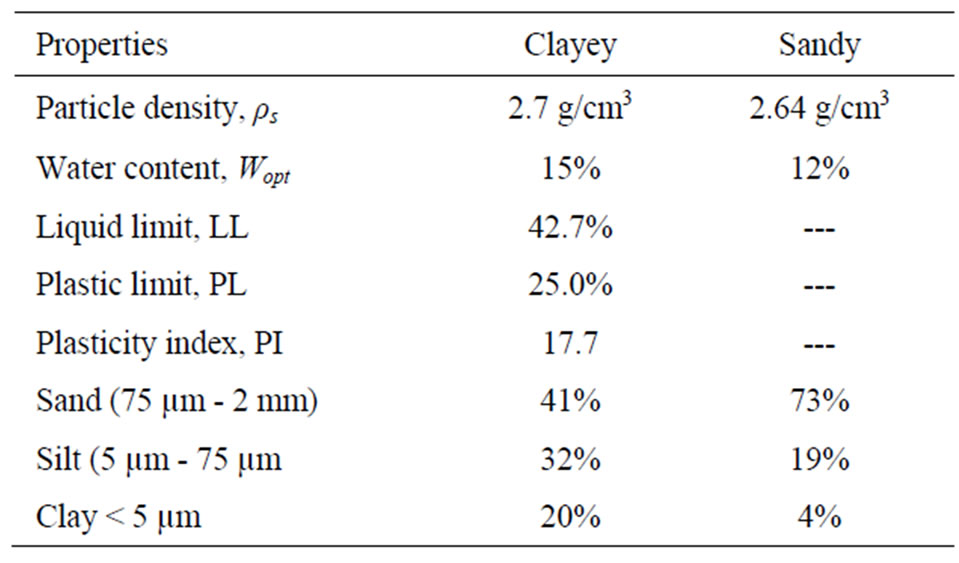
Table 1. Physical properties of the backfill soils.
non-conductive and non-magnetic resistance. The physical characteristics of these geosynthetics are listed in Table 2. For the purpose of discussion, the geotextile is noted as GT and the geogrids are noted as GG1, GG2 and GG3 as shown in Figure 2.
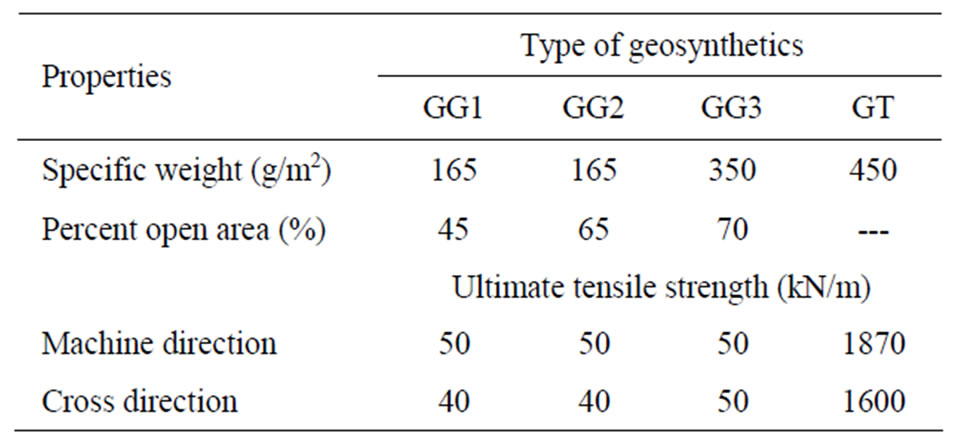
Table 2. Physical properties of geosynthetic.
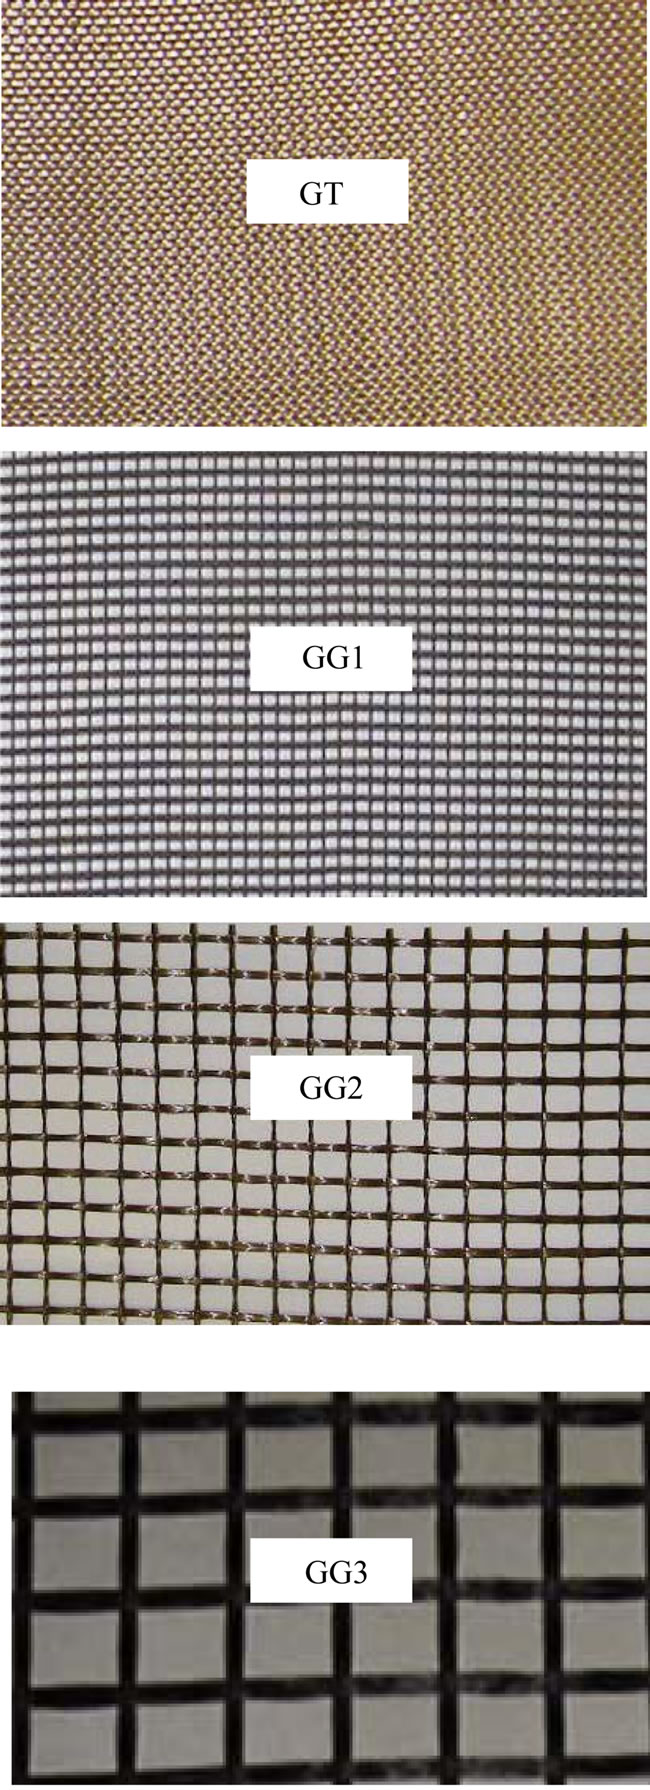
Figure 2. Types of geosynthetic used in this study.
3. Testing Procedure
A small scale direct shear testing device, as shown in Figure 3, which consists of a fixed lower box and a moving upper shear box, has been used in this study. Both the shear boxes have same inside dimension of 150 mm in length and 100 mm in width. The vertical load is applied to the backfill material through a loading plate below the lower shear box. A reaction plate is placed on the backfill in upper shear box. Details of this device are also available elsewhere [9]. The applied shear force, horizontal and vertical displacements were recorded using one load cell, and two displacement transducers (one for horizontal and other for vertical displacement measurement) connected to a computer through a data-acquisition system.
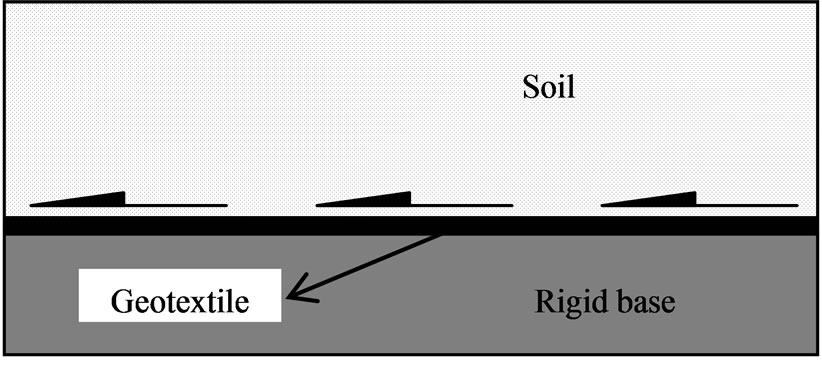
The geosynthetic specimens were positioned on a steel rigid base placed on the top of the lower box (Figure 4). Subsequently, the specimen was clamped on the front edge of the base plate using four aligned bolts and two steel clamping blocks. In case of pure sand, the upper shear box was filled by raining the sand from a height passing through two consecutive sieves. The dry unit weight of the sand mass in upper box was 1.63 g/cm3 (15.9 kN/m3) which corresponds to relative density (Dr) of 95%. The height of the sand layer in upper shear box was 70 mm. For sandy and clayey soils, water was added to the soil samples to its optimum level before filling up the shear box. The upper box was filled by the soil in three steps with same compaction energy for every step. Thus, the density of backfill soil was kept almost constant. The direct shear tests were conducted using four different normal stresses of 40, 80, 120 and 160 kPa. All the tests involved applying the normal stress and monitoring the vertical displacement. The shear load was only applied after the vertical displacement had reached equilibrium. The normal load was maintained constant during shearing process. The rate of shearing was maintained at 0.5 mm/min for all the tests. The maximum shear strength obtained during the shear process was recorded as the peak shear strength. The same procedure was repeated for all maintained constant during shearing process. The rate of shearing was maintained at 0.5 mm/min for all the tests.
The maximum shear strength obtained during the shear process was recorded as the peak shear strength. The same procedure was repeated for all types of geosynthetics. For three soils and four types of geosynthetics, a total of 48 Nos. of tests were conducted in this study.
4. Results and Discussion
4.1. Shear Stress-Displacement Relationship
A series of direct shear tests were performed to obtain the stress-deformation characteristics of the geosynthetic
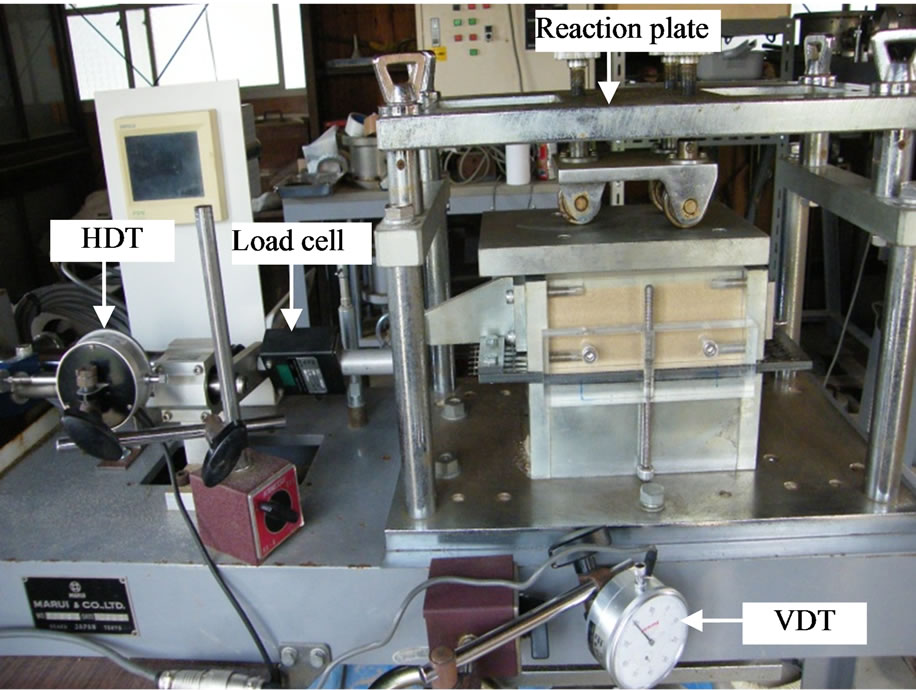
Figure 3. Interface testing device used in this study.
 (a)
(a)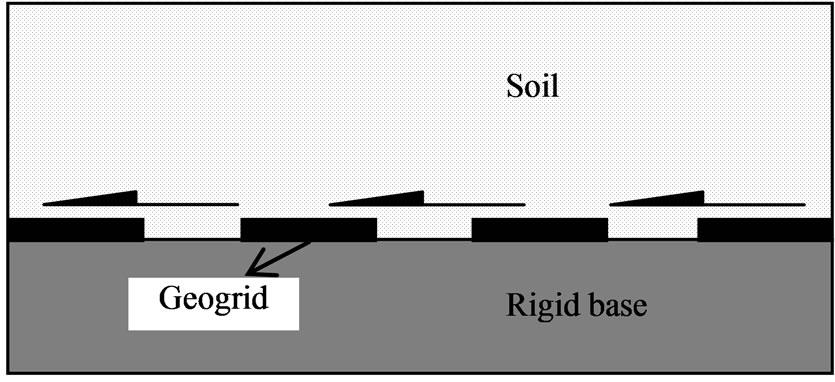 (b)
(b)
Figure 4. Interface shear tests arrangement for (a) geotextile and (b) geogrid specimens.
interfaces for different backfill soils. The test results reveal that the relationship between shear stress and relative displacement largely depends on the type of backfill rather than the type of geosynthetics. Figure 5 represents the stress-displacement relationship between different backfill soil and geosynthetic interfaces for the constant normal stresses of 40 and 160 kPa. Since, similar relationship is observed for the normal stresses of 80 and 120 kPa, related data are not presented here. It is seen that the stress-displacement relationship of geotextile (GT) interfaces is same for all the backfill soils (Toyoura sand, sandy soil and clayey soil). The relationship for GT interfaces can be defined as hyperbolic in nature where no displacement softening behaviour is observed. In case of pure sand, however, some insignificant softening behaviour is observed at normal stress of 40 kPa. In case of geogrid interfaces (GG1, GG2 and GG3), with sandy and clayey soils, the stress-displacement relationship is found
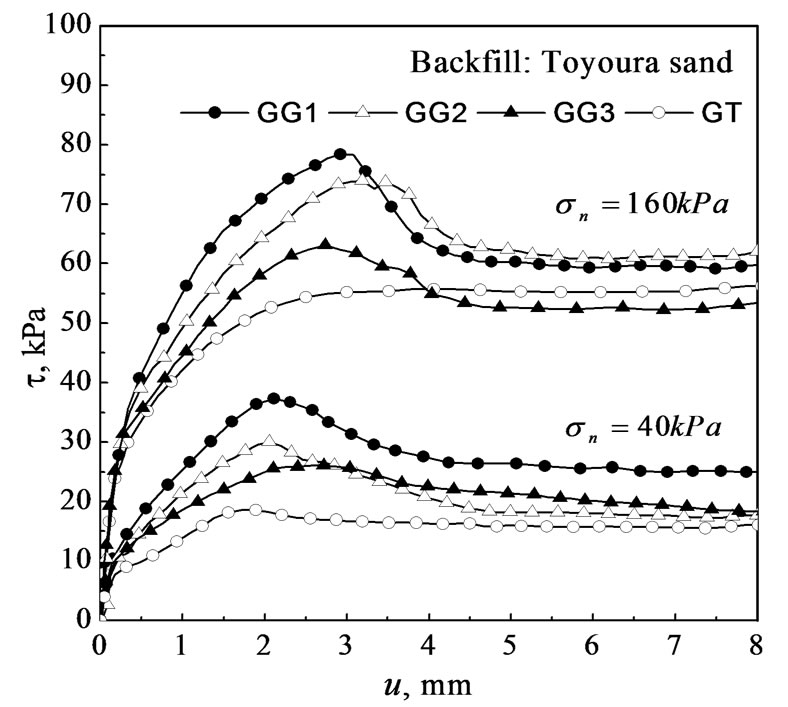
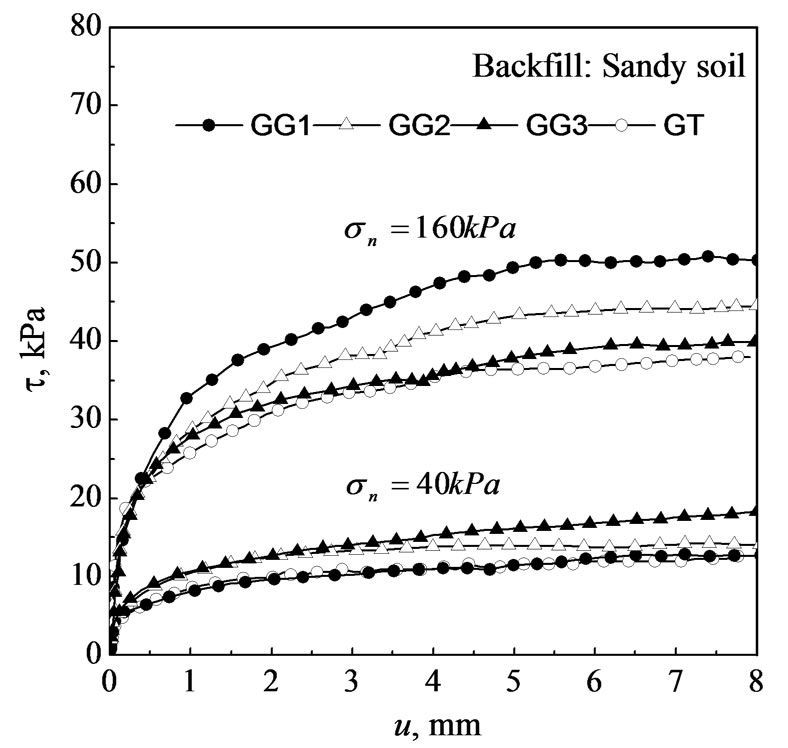
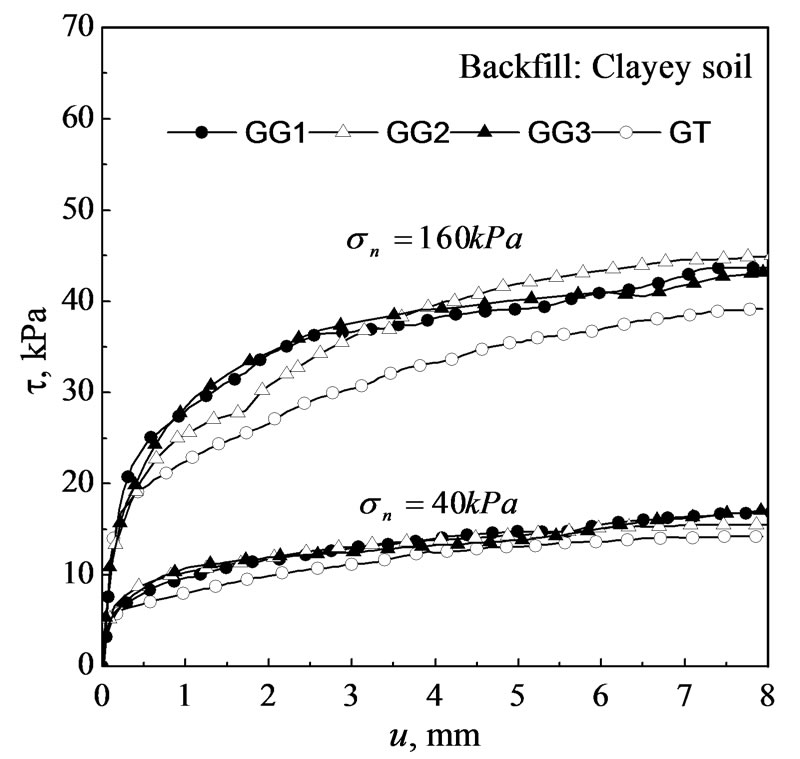
Figure 5. Shear stress-displacement relationships with different backfills for 40 kPa and 160 kPa normal stresses. τ, shear stress; u, relative displacement.
similar to its GT interfaces. But, with Toyoura sand, the geogrid interfaces produce a well-defined peak and residual shear stresses for all applied normal stresses. Before and after the peak shear stress, displacement hardening and softening behaviour is clearly observed. Maximum shear resistance mobilizes within 3 - 6 mm of shear displacement for geogrid interfaces with pure sand backfill. The shear strength is found increasing with the increase of normal stress which is a common phenomenon for all soil-geosynthetic interfaces tested in this study.
4.2. Dilatancy Behaviour
From test results, it is observed that the dilatancy behaviour of a particular interface is similar for any normal stress. Thus, for comparison, the vertical versus shear displacement curves obtained from the direct shear tests on the soil-geosynthetic interfaces at 160 kPa applied normal stress are shown in Figure 6. Both contractive and dilative nature is observed for the interfaces with the backfill material of pure sand. On the contrary, for the sandy and clayey backfills, only contractive nature is observed for all the interfaces (Figure 6). For pure sandgeosynthetic interfaces, the dilation with shearing indicates the presence of some degree of particle rolling and interlocking as dilation is required for the shearing and rearrangement of angular particles. For geogrid interfaces with pure sand, it is interesting to note that the value of maximum vertical displacement reduces with the increase of the percent open area of geogrid for a particular normal stress. And, the amount of dilation is seen higher at lower normal stresses and comparatively less at higher normal stresses. However, no such relationship is observed in case of sandy and clayey backfills which were mostly fluctuating in nature.
4.3. Interface Shear Strength
The shear strength of a soil-geosynthetic interface is an essential parameter of slope stability analysis where slip surface runs along the geosynthetic. The test results show that the interface shear strength is not linear against the normal stresses in most of the cases. The relationship between interface shear strength and normal stress at the interface is generally considered to be linear and defined by Equation (1):
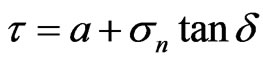 (1)
(1)
where,  is the soil-Geosynthetic interface shear strength;
  is the interface adhesion;
  is the stress normal to the interface; and
  is the interface friction angle.
In many cases, results from shear box tests showed that the relationship between  and
and  is not linear [10]. Usually, in those cases, approximate linear relationship of Equation (1) is often considered. This linear relationship may lead to significant errors where factor of safety of a slope is concerned. For utilizing interface shear strength data and to prevent the errors, Giroud et al. [10] proposed a hyperbolic equation to represent a non-
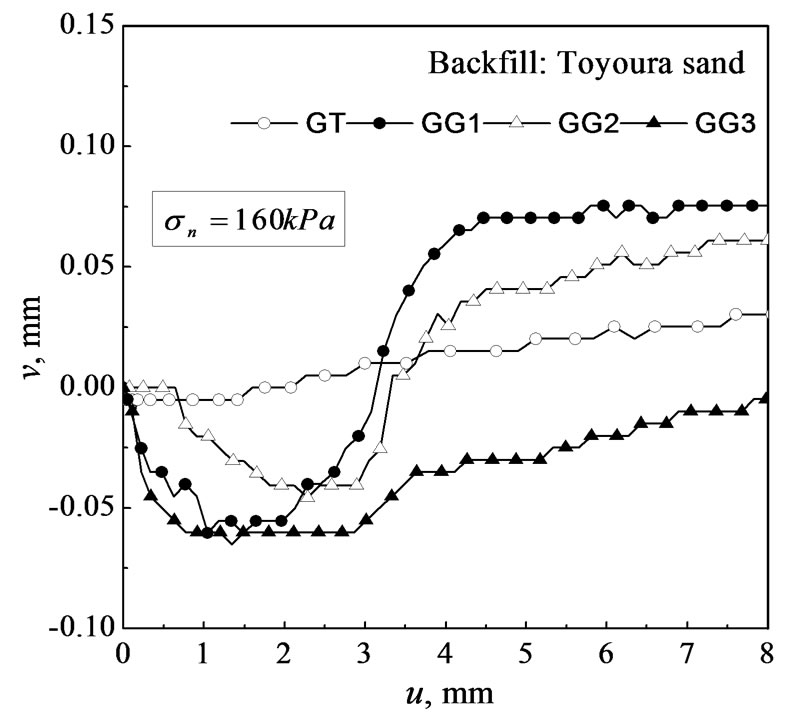
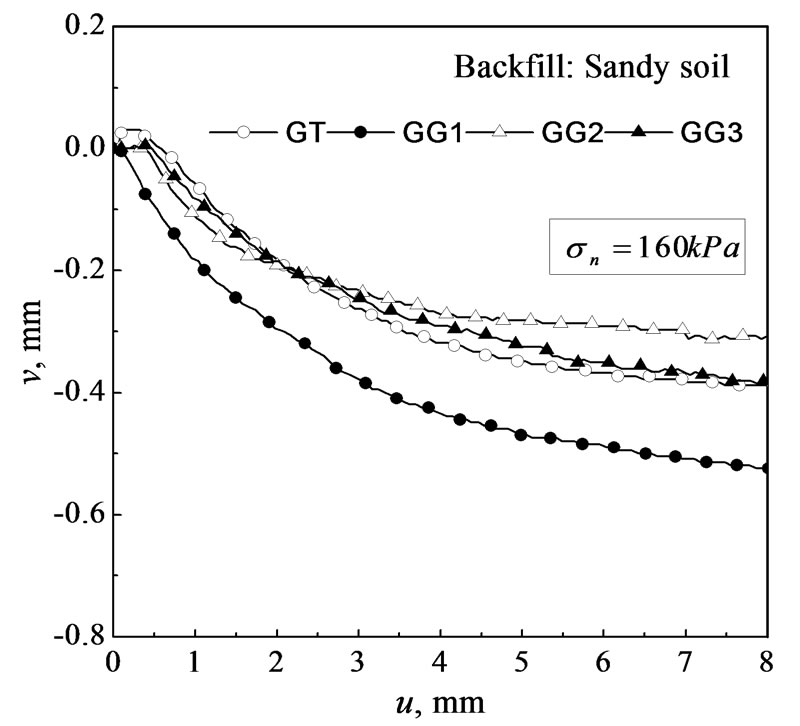
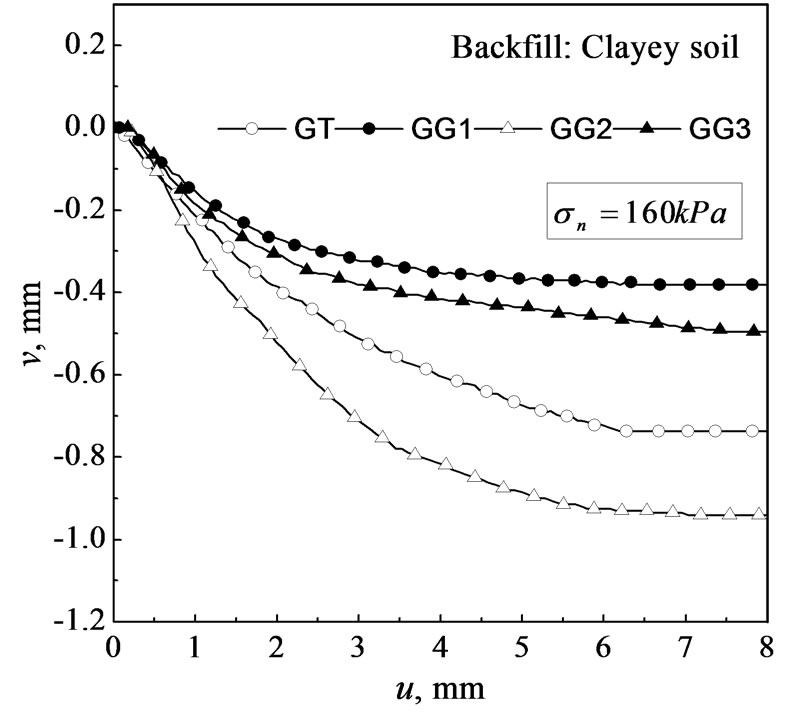
Figure 6. Vertical vs shear displacement relationships of the geosynthetic interfaces with different backfill materials. v, vertical displacement; u, shear displacement.
linear relationship consistent with interface shear strength values obtained in laboratory shear box tests. The equation contains five parameters to be determined, and the determination of the order of hyperbola is a bit complex. However, it is observed that the interface shear strength data may be linear or nonlinear against the normal stress depending on the characteristics of geosynthetic and backfill materials. Therefore, it has been found that a similar type of generalised nonlinear equation is appropriate to represent both the linear and nonlinear peak shear strength data for the soil-geosynthetic interfaces studied in this research. The equation for interface shear strength,  , can be expressed as follows:
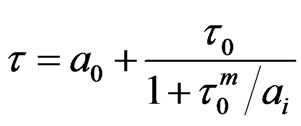 (2)
(2)
where, 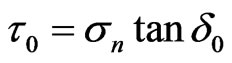 ,
,  = Normal stress,
  = Interface friction angle at very low normal stresses,
  = Pseudo adhesion at
  = 0 (i.e. intercept of the nonlinear curve with
  axis),
  = Pseudo adhesion for higher values of
 , m = Curve fitting parameter; the value ranges from 0 to 1.
If the experimental data is available for very low normal stresses,  can be obtained by extrapolating the curve of
  and
and . Otherwise, for practical purposes, the value can be taken as zero for the interface between geosynthetic and cohesionless soil.
  may not be zero for the interface with cohesive soil of high moisture content. In that case, the value of
  can be obtained by best fitting the nonlinear curve with the experimental data using a computer program. The interface friction angle,
  , is initially calculated using the data of very low normal stresses. By the way of curve fitting, the value of
  can be optimized if the data of low normal stress is not available. The value of
  and m is completely depends on the available data of higher normal stresses.
  can be obtained initially by fitting and extrapolating the straight line with the shear strength data points at higher normal stresses towards
  axis. The curve fitting parameter, m, is determined by the method of least square which is easy by using a computer program. Once m is obtained, the values of
 ,
,  , and
, and  can be optimized, if necessary, to get higher coefficient of regression (R2) value. In case of truly linear data, the value of
  and
and  should be same and the value of
  would be near zero or may be negative. In that case, Equation (1) is recommended which is simple and convenient for linear data.
The proposed equation is not an empirical equation and the parameter values are adjustable based on the extent of the available experimental data. Thus, it may not be realistic to use the equation for the purpose of prediction. Because it is found that the value of  and m is controlled by the experimental data of higher normal stresses.
The equation is found suitable for better representation of nonlinear experimental data and minimizing the errors where appropriate shear strength value is very important such as in slope stability analysis of reinforced earth structure.
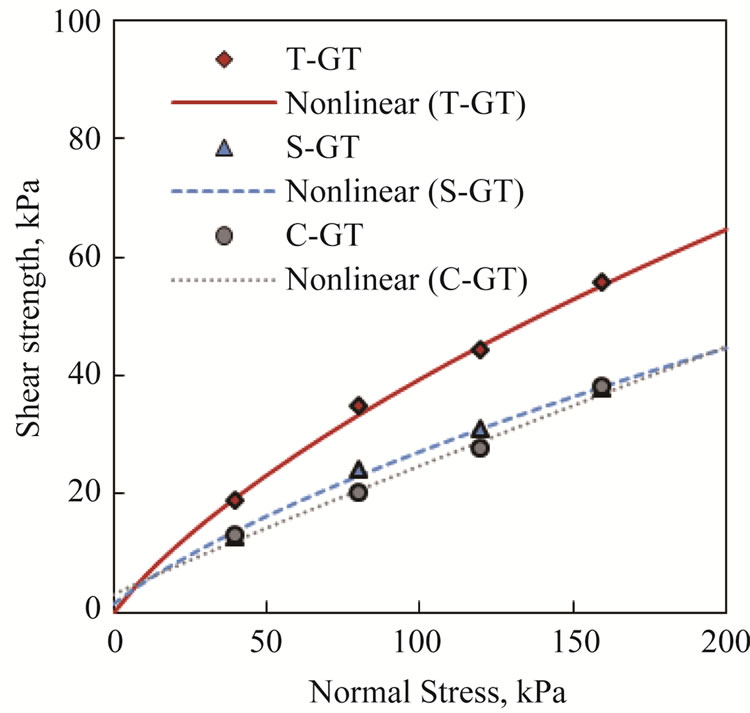
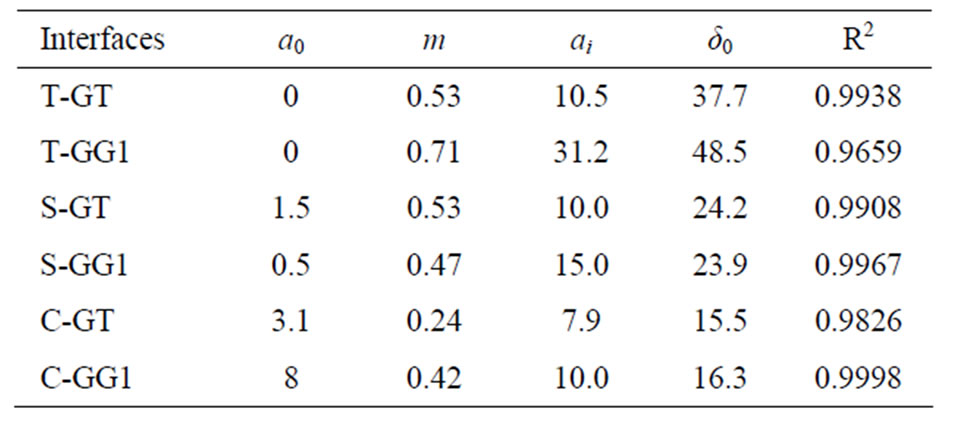
The shear strength envelops as shown in Figure 7 were generated using Equation (2) for the geotextile and one geogrid interfaces with Toyoura sand (T), sandy soil (S) and clayey soil (C). Here, for Toyoura sand, the value of interface adhesion,  , is taken as zero. The parameters value of the shear strength envelops used in Figure 7 are listed in Table 3. It is seen that the nonlinear shear strength envelops are in good representation with the experimental data points.
5. Conclusions
The interface direct shear tests were carried out to evaluate the interaction properties of a new type of geosynthetic material with three different backfill soils.
The constitutive behaviour of the geotextile and geogrid interfaces with sandy and clayey soil is found similar in nature which can be defined as hyperbolic relationship. In case of pure sand-geotextile interface, the beha-
 (a)
(a)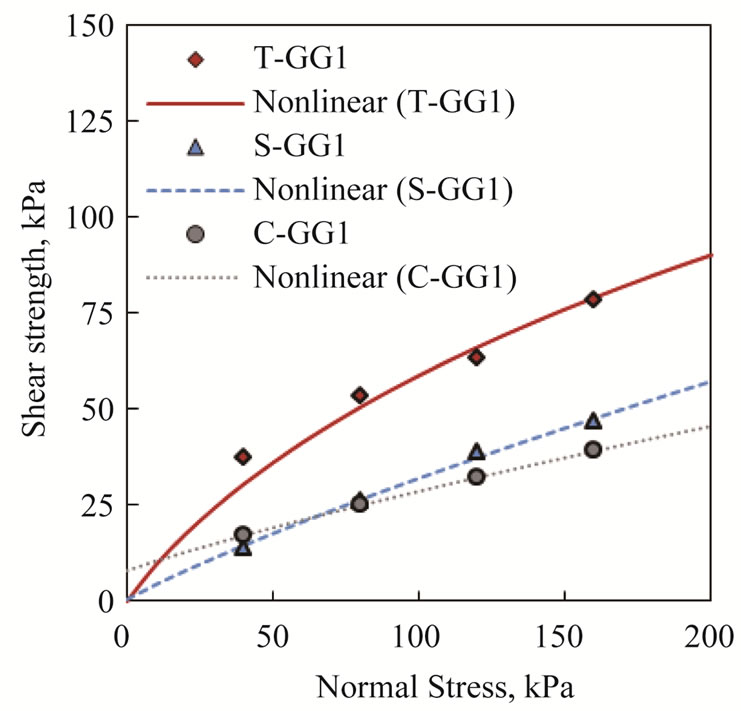 (b)
(b)
Figure 7. Nonlinear shear strength envelops for the (a) geotextile, and (b) geogrid interfaces with different backfill soils.
viour is also hyperbolic. However, for sand-geogrid interfaces, the constitutive behaviour is followed by displacement hardening and softening behaviour. The dilatancy behaviour of a particular soil-geosynthetic interface is found similar for all normal stresses. Both contractive and dilative nature is observed for the interfaces with pure sand. On the contrary, only negative dilatancy or contractive behaviour is observed for sandy and clayey backfills with all geosynthetics. Unlike pure sand, no relationship is observed between maximum vertical displacement and the percent open area of geogrids in case of sandy and clayey backfills.
Based on the test results, a simplified nonlinear equation has been proposed for the soil-geosynthetic interface shear strength envelops which was in good agreement with the experimental data.
REFERENCES
- R. A. Jewell, G. W. E. Milligan, R. W. Sarsby and D. Dubois, “Interaction between Soil and Geogrids,” Polymer Grid Reinforcement, Thomas Telfold Limited, London, 1984.
- T. S. Ingold, “Laboratory Pull-Out Testing of Grid Reinforcements in Sand,” Geotechnical Testing Journal, Vol. 6, No. 3, 1983, pp. 101-111. doi:10.1520/GTJ10838J
- E. M. Palmeria and G. W. E. Milligan, “Scale and Other Factors Affecting the Results of Pull-Out Tests of Grids Buried in Sand,” Géotechnique, Vol. 39 No. 3, 1989, pp. 511-524. doi:10.1680/geot.1989.39.3.511
- D. T. Bergado, J. C. Chai, H. O. Abiera, M. C. Alfaro, and A. S. Balasubramaniam, “Interaction between Cohesive-Frictional Soil and Various Grid Reinforcements,” Geotextiles and Geomembranes, Vol. 12, No. 4, 1993, pp. 327-349. doi:10.1016/0266-1144(93)90008-C
- D. T. Bergado, R. Shivashankar, M. C. Alfaro, J. C. Chai, and A. S. Balasubramaniam, “Interaction Behaviour of Steel Grid Reinforcements in a Clayey Sand,” Géotechnique, Vol. 43, No. 4, 1993, pp. 589-603. doi:10.1680/geot.1993.43.4.589
- A. Cancelli, P. Rimoldi and S. Togni, “Frictional Characteristics of Geogrids by Means of Direct Shear and Pullout Tests,” Proceedings of the International Symposium on Earth Reinforcement, Kyushu University, Fukuoka, 12-14 November 1992, pp. 51-56.
- D. Cazzuffi, L. Picarelli, A. Ricciuti and P. Rimoldi, “Laboratory Investigations on the Shear Strength of Geogrid Reinforced Soils,” ASTM Special Technical Publication, Vol. 1190, 1993, pp. 119-137.
- R. M. Bakeer, M. Sayed, P. Cates and R. Subramanian, “Pullout and Shear Test on Geogrid Reinforced Lightweight Aggregate,” Geotextiles and Geomembranes, Vol. 16, No. 2, 1998, pp. 119-133. doi:10.1016/S0266-1144(97)10025-5
- M. B. Hossain, M. Z. Hossain and T. Sakai, “Interface Behaviour of Basalt Geosynthetic with Sand Using Direct Shear Device,” Proceedings of the 1st International Conference on Geotechnique, Construction Materials and Environment, Mie, 21-23 November 2011, pp. 191-196.
- J. P. Giroud, J. Darrasse and R. C. Bachus, “Hyperbolic Expression for Soil-Geosynthetic or Geosynthetic-Geosynthetic Interface Shear Strength,” Geotextiles and Geomembranes, Vol. 12, No. 3, 1993, pp. 275 -286. doi:10.1016/0266-1144(93)90030-R
NOTES
*Corresponding author.