Food and Nutrition Sciences
Vol.5 No.1(2014), Article ID:41706,10 pages DOI:10.4236/fns.2014.51003
The Application of Nutrimetabolomics to Investigate the Bioaccessibility of Nutrients in Ham Using a Batch in Vitro Digestion Model
1Manchester Institute of Biotechnology and Institute of Inflammation and Repair, Manchester Academic Health Sciences Centre, The University of Manchester, Manchester, UK; 2Department of Agricultural and Food Science and Technology, University of Bologna, Bologna, Italy.
Email: xiaoyan.pan@manchester.ac.uk
Received November 3rd, 2013; revised December 3rd, 2013; accepted December 10th, 2013
ABSTRACT
Delivering high quality dietary protein at an affordable price is a major aim of the EU-funded CHANCE project. Foods have been formulated with this aim and as part of their nutritional assessment; the bioaccessbility of nutrients following simulated gastroduodenal digestion is being investigated. Nutrimetabolomics approaches can be used to comprehensively and quantitatively analyse nutrients and metabolites. They have been applied to monitor nutrient release from ham, formulated in the CHANCE project, during in vitro digestion. SDS-PAGE analysis shows that constituent ham proteins were broken down to lower molecular weight polypeptides (Mr ≤ 10 kDa) after 120 min simulated gastric digestion which was digested further by subsequent duodenal digestion. Digestion of porteins resulted in the appearance of coalesced lipid droplets associated with the loss of the muscle protein matrix of the ham. Important nutrients, such as choline, creatine, carnosine, sucrose, cholesterol, triacylglyceride and fatty acids (saturated and unsaturated) were identified using 1H NMR. Chance ham is a good source of dietary protein and the combined approach can provide representative data on the bioaccessibility of all detectable nutrients contained in CHANCE ham to human digestive system.
Keywords:In Vitro Digestion; Ham; Nutrimetabolomics; NMR; Bioaccessibility
1. Introduction
Improving the nutritional quality of processed foods is crucial if human kind is to address the pressing need to feed the worlds’ population in an era of climate change when there is increasing uncertainty regarding the food supply. Delivering high quality dietary protein at an affordable price is important, especially if vulnerable groups, such as young children and the elderly, who are at risk of poverty, are to have a nutritionally well-balanced diet. This is a major aim of the EU-funded CHANCE project [Low cost technologies and traditional ingredients for the production of affordable, nutritionally correct foodsimproving health in population groups at risk of poverty] which has developed several food formulations aimed at meeting the needs of such group. Maintaining the bioaccessibility of nutrients in fortified foods is a must for the food technologists, especially for those products being developed to meet the needs of a specific population. As part of the nutritional assessment of the CHANCE food formulations, the bioaccessibility of nutrients following simulated gastroduodenal digestion is being investigated, using a nutrimetabolomics approach. This has been applied to a pork-based ham-like meat product enriched with ingredients that could modify the structure of the matrix compared to conventional ham.
The digestive process transforms and degrades complex food structures, rendering macronutrients into an absorbable form. Several different types of in vitro digestion model have been developed to mimic this process, modelling the environments of the stomach and small intestine by sequential addition of digestive enzymes and salts [1]. These models are being widely used to study food behaviour in the gastrointestinal lumen or to assess how the availability of nutrients is affected by food structure and formulation [2] and encapsulation [3] or the addition of fibres [4]. Other applications of in vitro digestion models include oral drug delivery systems [5], breakdown of food allergens [6] and toxin presence [7]. In addition to batch digestion models, dynamic digestion models have been developed building on in vivo data from magnetic resonance imaging (MRI) studies to address physical processes such as mixing, dilution and dispersion of different food matrices on digestion [8,9]. The application of a dynamic in vitro digestion model to cereal foods with different compositions and structures showed that patterns and kinetics of starch digestion in vitro resembled changes in blood glucose in vivo after consumption of similar foods [10]. In addition the absorptive capacity of the intestinal mucosa has been modelled using the Caco-2 cell line, derived from a human colon adenocarcinoma cell line which can differentiate to provide a cellular model of the enterocyte [11].
A metabolomics approach is suitable to study the biotransformation of food in the gastrointestinal tract, where all the low molecular metabolites in a biological sample are described simultaneously [12]. Nuclear magnetic resonance spectroscopy (NMR) and mass spectrometry (MS) are two of the most commonly used techniques in metabolomics [13]. The application of such “OMICs” technology to human nutrition is known as nutrimetabolomics. It usually takes two different aim forms. One is investigating the effect of nutrients or specific dietary components on the human metabolome and metabolic regulation [14] using human fluid or tissue samples from nutritional studies and interventions. A second aspect is the study of the entire complement of nutrients in a food sample [15,16]. The capacity of metabolomics to simultaneously profile many low molecule weight organic compounds in a sample means it is well suited to following nutrients release during digestion when combined with in vitro digestion models. This allows a systematic approach to be taken to the study of the biotransformation of low molecular weight compounds during the digestive process [17]. It also has the potential show whether the breakdown of different nutrients, especially the macronutrients which form food microstructure, is mutually dependent [4,18]. The CHANCE ham was chosenas a model food due to the number and variety of macronutrients this food matrix contains, including proteins, lipids and carbohydrates. It is also a fabricated animal protein structure, developed to include iron and vitamin D rich ingredients, which has not been widely studied before.
2. Materials and Methods
2.1. Materials
Ham developed as part of the CHANCE project was provided by Dr. Anamarija Mandic (the Institute for Food Technology Novi Sad, Serbia). Porcine pepsin (4293 U/mg), porcine α-amylase (50 U/mg) and lipase from Aspergillusniger (≥120 U/mg) were purchased from Sigma-Aldrich (Dorset, UK); whereas porcine trypsin (780 U/mg) and human salivary amylase (126 U/mg) were sourced from Applichem GmbH (Denmark). Porcine lipase (25.2 U/mg) was obtained from MP Biomedicals andbovine α-chymotrypsin (11.9 U/mg) from Merck (Nottingham, UK). 12% NuPAGEBis-tris gels, See Blue TM pre stained marker and Simply Blue TM safe stain were obtained from in vitro gen (UK). Methanol, chloroform, deuterium water, deuterium chloroform and 3- Trimethylsilylpropionic acid (TSP) were purchased from Sigma Aldrich, UK. NMR tubes (178 Mm Mhz 600) were sourced from VWR International Ltd.
2.2. In Vitro Digestion
Digestions were performed in vitro using a batch digestion model comprising oral [model chew], gastric and duodenal stages. The digestive enzymes added were calculated based on the amount of substrates (protein or carbohydrate in the ham) and the activity unit of the enzyme and buffers using concentrations used in previous publications [19,20] (Table 1).
Model chew: Ham was cut and ground with a mortar and pestle with the presence of simulated salivary fluid (SSF, 0.15 M NaCl pH 7 containing 6 µg/ml lysozyme, 0.2 Uhuman salivaryamylase/mgham carbohydrate) at a 3:1 (w:v) ratio to simulate the chewing. After mixing further at 37˚C for 5 min with shaking at 170 rpm to simulate the action of saliva, the “chew” was sampled for further analysis and the remainder subjected to gastroduodenal digestion.
Gastric model: model chewed material was mixed with simulated gastric fluid (SGF, 0.9 mM NaH2PO4, 3 mM CaCl2, 0.1 M HCl, 0.15 M NaCl, 16 mM KCl, 183 Uporcine pepsin/mg ham protein, 1.4 Ulipase from Aspergillusniger/mg ham fat from, pH 2.5) and the pH adjusted to 2.5 using 1 M HCl. The mixture was then incubated at 37˚C with shaking at 170 rpm. The mixture was prepared in several universal tubes for different time points. Samples were collected at 0, 20, 40, 60 and 120 min (termed G0-G120). Pepsin was inactivated by raising the pH to >7.5 by addition of 0.5 M NaHCO3. The

Table 1 . The enzyme unit and amount used in this study.
*One BAEE unit will produce a ΔA253 of 0.001 per min at pH 7.6 at 25˚C using Nα-Benzoyl-L-arginine ethyl ester (BAEE) as substrate; ^Expressed as BTEE unit (N-Benzoyl-L-tyrosine ethyl ester).
control sample (GU) had no digestive enzymes added but did undergo pH transitions and incubations.
Duodenal model: Samples G0 and G60 from the batch gastric digestion were taken forward into the duodenal digestion. Gastric digesta were mixed with hepatic mix solution (HMS; 0.68 ml, 12.5 mM sodium taurocholate, 12.5 mM sodium glycodeoxycholate, 146 mM NaCl, 2.6 mM CaCl2, 4.8 mM KCl, 4 mM cholesterol, pH 6.5) for 10 min at 37˚C with shaking prior to addition of pancreatic mix solution (PMS, 0.6 mM CaCl2, 4.1 μM ZnSO4, 125 mM NaCl, 0.3 mM MgCl2, 34.5 U/mg proteintrypsin, 0.4 Ubovine α-chymotrypsin/mg ham protein, 1.7 Uporcine α-amylase/mg ham carbohydrate, 1 Uporcine lipase/mg ham fat). Samples were incubated with shaking, and sampled at 0, 20, 60 and 120 min (Sample G0D0 to G60D120). The action of trypsin and chymotrypsin was stopped by the addition of phenylmethylsulfonyl fluoride (PMSF).
All samples were stored in −20˚C immediately after collection.
2.3. Protein Extraction and Gel Electrophoresis
Frozen digesta were thawed on ice and centrifuged at 13,000 rpm for 5 min at 4˚C and the supernatant containing soluble protein and metabolites collected. The pellets containing insoluble protein were extracted with RIPA buffer (50 mM Tris-HCl pH 7.5 containing 150 mM NaCl, 0.1% (w/w) SDS, 0.5% (w/w) sodium deoxycholate, 1% (w/w) Triton X 100). The proteins in the soluble fraction and RIPA extracts were determined using a BCA assay performed in a 96 well microplate format and bovine serum albumin (BSA) was used as a standard. Supernatant and extracted pellet protein was heated for 10 mins at 90˚C with NuPAGE LDS buffer (In vitro gen, UK) containing 10 mM DTT. Protein samples (20 μg/ track for soluble protein and 10 μg/track for RIPA extracts) were loaded onto 4% - 12% NuPAGEBis-tris gels with a molecular marker (See Blue Plus2, Invitrogen). They were then subjected to electrophoresis for 35 min at 200 V using NuPAGE MES buffer (Invitrogen, UK). Gels were fixed for 2 h in fix solution (50% MeOH (v/v), 10% (v/v) trichloroacetic acid) and stained overnight with Simply Blue TM safe stain. Gels were destained with distilled water before imaging using a Typhoon Trio scanner (GE Healthcare, Buckinghamshire, UK).
2.4. Microscopy
Digesta were centrifuged at 13,000 rpm for 5 min at 4˚C and approximately 10 µg of the pellet fraction place don to a glass slide with a cover slip and imaged using an Olympus BX51 upright microscope with a 100x oil objective. Images were captured using a Coolsnap ES camera through MetaVue Software (Molecular Devices). Calibration was performed and the scale bar added using Image J (http://rsb.info.nih.gov/ij/).
2.5. 1H Nuclear Magnetic Resonance Spectroscopy
Digesta prepared for NMR analysis were centrifuged and the supernatant fractions collected. The supernatant was prepared by adding 540 µl deuterated water and 10 µl of 10 mM trimethylsilyl propionate (TSP) into 60 µl of supernatant. A dual phased methanol-chloroform extraction protocol was used to prepare the lipids for NMR analysis from unfractionated digesta [21]. Samples of digesta (50 mg, wet weight) were suspended in 400 µl methanol and sonicated before addition of two lots of 200 µl each of chloroform to form a dual-phase. The lower chloroform phase was collected and dried overnight in a fume hood. Lipid extracts were resuspended in 600 µl of deuterated chloroform containing 5 µl of 10 mM TSP. The spectra were acquired at 298 K using a BrukerAvance III 500 MHz spectrometer equipped with a QCI-F cryoprobe with z-gradients (BrukerBioSpin, Germany). A standard pulse sequence with water suppression by excitation sculpting (zgesgp from Bruker Topspin using the standard parameter set) was used to acquire 32 K data points, with a relaxation delay of 4s and an acquisition time of 2.5 s. Signal assignment was confirmed by literature [22-25] and web database [26]. All spectra were manually phased, referenced to TSP at 0ppm. Spectra of metabolites were normalised to the lactate signal at 1.3 ppm and the 4.5 - 0.4 ppm region was plotted to exclude the water peak at 4.7 ppm and the TSP peak at 0 ppm. Metabolites were quantified by integration of specific signals using the normalised spectra. Principle component analysis (PCA) was performed using software R.
3. Results
Protein digestion was monitored by SDS-PAGE (Figure 1). Here, changes to the protein profile can be observed. More bands, especially the higher molecular weight polypeptides of Mr > 50 kDa, were present in the gastric digesta compared to the duodenal digesta. Soluble protein bands of Mr 135 and 23 kDa decreased in intensity (red arrows) and protein bands of Mr 57 and 17 kDa increased in intensity (green arrows) over the time of gastric digestion. Fewer proteins of Mr > 50 kDa were observed in the insoluble protein fraction, especially in sample G120. However, polypeptides observed in the duodenal digesta all decreased in intensity (green arrow).
1H NMR spectra of ham after gastroduodenal digestion at zero minutes (G0D0) (Figure 2) shows a complex profile of resonances originating from metabolites, lipids and macromolecules (MM) largely relating to protein fragments. Spectral signals were assigned using published reference spectra (Table 2) for most abundant metabolites, such as acetate, lactate and creatine, likely originate from the pork muscle used in ham production. Two resonances at 3.8 and 3.6 ppm could be assigned to sucrose whilst the amino acidalanine and the dipeptidecarnosine (β-alanine and histidine) were identified at 1.48 and 2.68 ppm, respectively. A broad set of overlapping peaks around 0.9 ppm which was assigned to soluble macromolecules, such as the proteins observed by SDS-PAGE. In addition, peaks due to emulsion lipids were observed at 1.3 and 0.8 ppm together with a set of peaks assigned as total choline (T-choline), which collects the whole ensemble of signals from glycerophosphocholine, phosphocholine and choline at 3.27 - 3.23 ppm. Lipids and other hydrophobic compounds were selectively extracted using methanol/chloroform. The proton spectrum of the lipid extracts of ham after gastric digestion for zero minutes (G0) shows a detailed profile for lipids (Figure 2(b)). Signals from triacyglyceride, cholesterol, fatty acids from saturated, mono-unsaturated and poly-unsaturated lipids were found and assigned using published reference spectra (Table 3).
To observe alterations in the nutrients during digestion, these annotated spectra were then plotted over the digestion phases, to evaluate the effect of gastric and duodenal digestion on soluble metabolites (Figure 3). Lactate is
Table 2 . The assignment of 1H NMR spectrum of metabolites.
Table 3. The assignment of 1H NMR spectrum of lipids.
present in pork muscle and has been used to monitor the quality of pork [27]. Due to its stability under the action of digestive enzymes, lactate was chosen for normalisation in the quantitative analysis of nutrient levels. Signals from lipid and MM increased dramatically in the gastric digestion while the metabolites remained stable. During duodenal digestion, the lipid and MM signal increase from 0 to 60 min although no further increase was observed after 120 min digestion. PCA analysis (Figure 4) identified the biggest variance (principle component 1 and 2, PC 1 and 2) lies in the digestive process and the independent preparations. Each spot represents a score assigned to the spectrum acquired from one digesta sample; three independent repeats (1st, 2nd and 3rd) were prepared for each sample. Relative quantification of specific signals from detected metabolites in digestion was plotted in Figure 5. The signals from MM increased throughout the digestion time course, especially during the duodenal phase.
Structural changes in ham resulting from in vitro gastric gastric digestion are shown in the microscopic images in Figure 6. There are more lipid droplets visible after gastric digestion which is consistent with the NMR
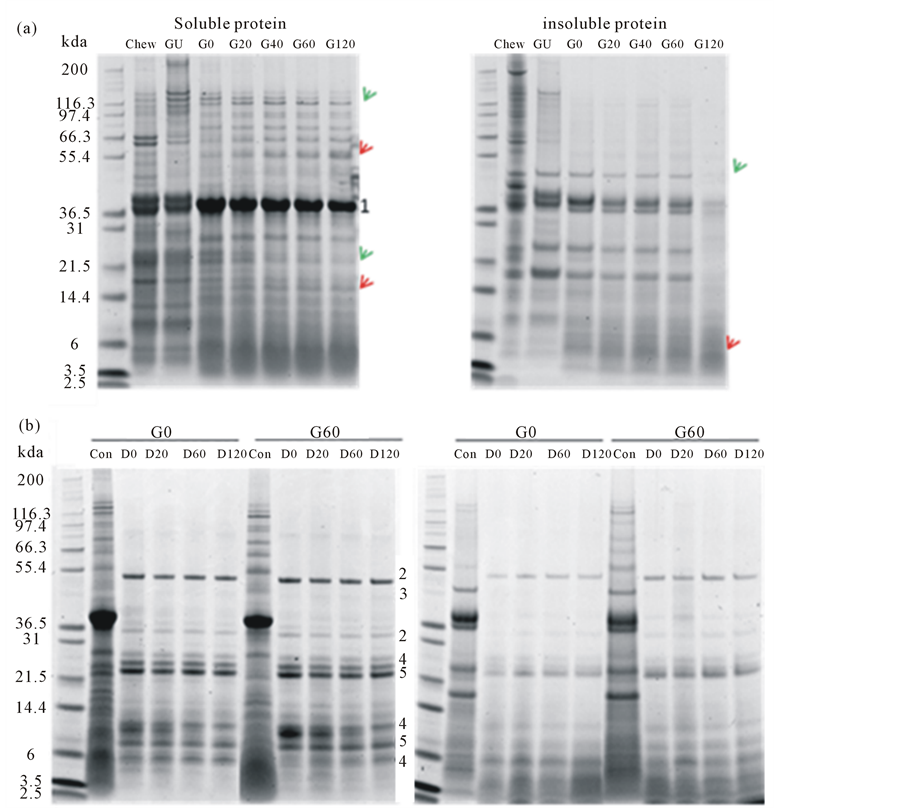
Figure 1. Soluble and insoluble proteins of ham following in vitro gastric (a) and subsequent in vitro duodenal (b) digestion. Proteins were analysed by SDS-PAGE and stained for protein with SimplyBlueTM. The positions where digestive enzymes run on the gels are indicated by numbers assigned as follows: 1. pepsin, 2. amylase, 3. lipase, 4. chymotrypsin, 5. trypsin. Bands with increasing intensity were pointed by red arrows and bands with decreasing intensity were pointed by green arrows.
spectral data.
4. Discussion
Protein digestion starts in the stomach with pepsin and continues in the duodenum with trypsin and chymotrypsin [28]. Gastric acid plays a key role in the digestion of protein by activating pepsin and denaturing the protein which can then become readily accessible by digestive proteases [29]. The changes in patterns of polypeptides observed by SDS-PAGE (Figure 1) shows the release of polypeptides and their subsequent degradation, such as the Mr 135 kDa polypeptide which increased in intensity in sample GU and then decreased through the digestive process. The lack of higher Mr polypeptides in the insoluble fraction of protein from the ham and the accumulation of lower Mr polypeptides indicated that most of the ham protein was digested after 120 min simulated gastric digestion. The remaining lower Mr polypeptides (~10 kDa) were further digested in the simulated duodenal digestion such that little proteinaceous material remained.
A range of nutrients including carbohydrates, peptides and lipids were identified by 1H NMR (Figure 2). One of these, carnosine is a dipeptide of the amino acids alanine and histidine and it is highly concentrated in muscle. Carnosine has been proposed as an anti-aging nutrient for human [30] and biomarkers for meat intake [31]. Choline must be consumed in the diet to maintain health [32]. Creatine is a non-essential nutrient, but it can help to preserve the muscle strength [33]. The bio accessibility
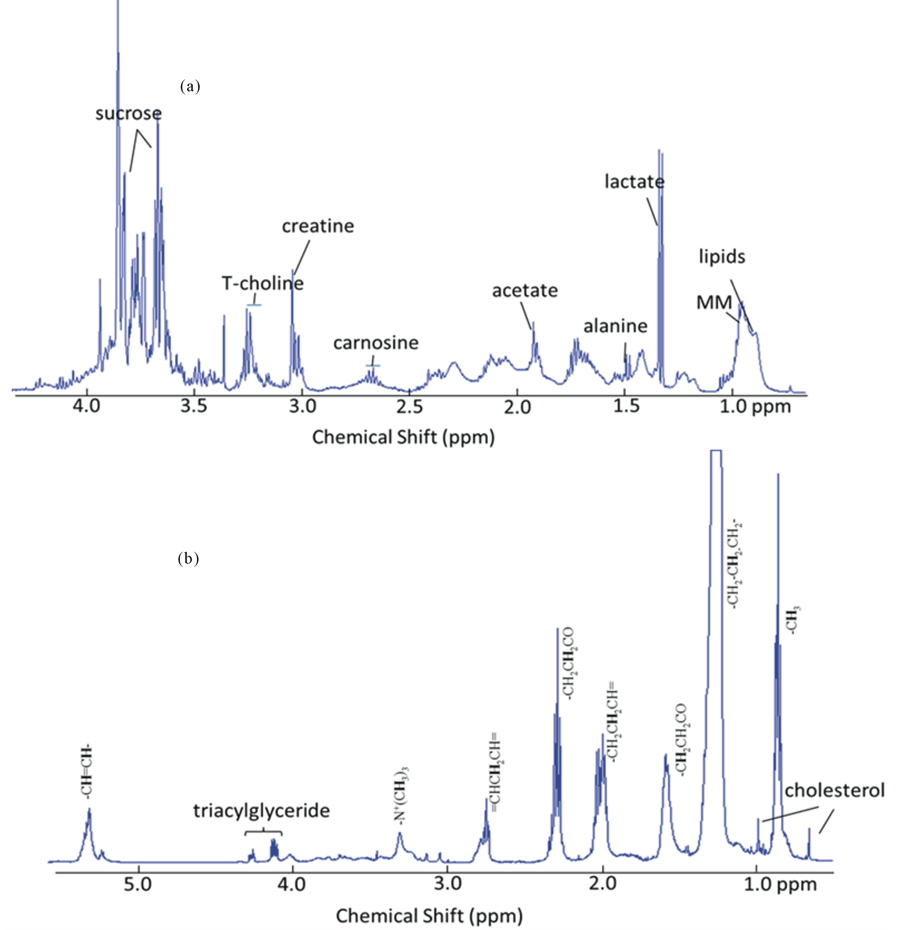
Figure 2. 1H NMR spectra of metabolites (a) and lipid extracts (b) of ham after in vitro gastric digestion (0 min; G0) digesta to show the NMR detectable nutritional components in ham at the start of digestion.
of these important nutrients in digesta can therefore be used to measure the quality of ham and the efficiency of digestion. Others have previously studies its release from cooked meats and shown an apparent increase in abundance following simulated digestion. As the di-peptide is synthesised intracellularly from β-alanine and histidine by canosine synthase, it seems unlikely this arises from the action of digestive proteases [34].
Detection of molecules by NMR depends largely on molecular mobility due to their transverse relaxation rate [35]. The molecule has to be small and mobile enough to give an observable NMR signal and lower molecular weight molecules generally giving sharper signals. The increase in intensity of lipid and MM signals in the digesta (Figure 3) indicate that the abundance of NMRdetectable lipids and protein-derived material increases during digestion. PCA analysis shows that the spectra can be grouped via digestion process and the different preparation type. PC scores plots (Figure 4) indicate that PC1 (84.47% total variance explained) is focusing on the reproducibility of digestion between samples, whilst PC2 (5.68% total variance explained) is able to capture the overall changes in the food molecular profile upon digestion. The inspection of these plots highlights the fact that the first sample underwent a slight different digestion process compared to the other two samples.
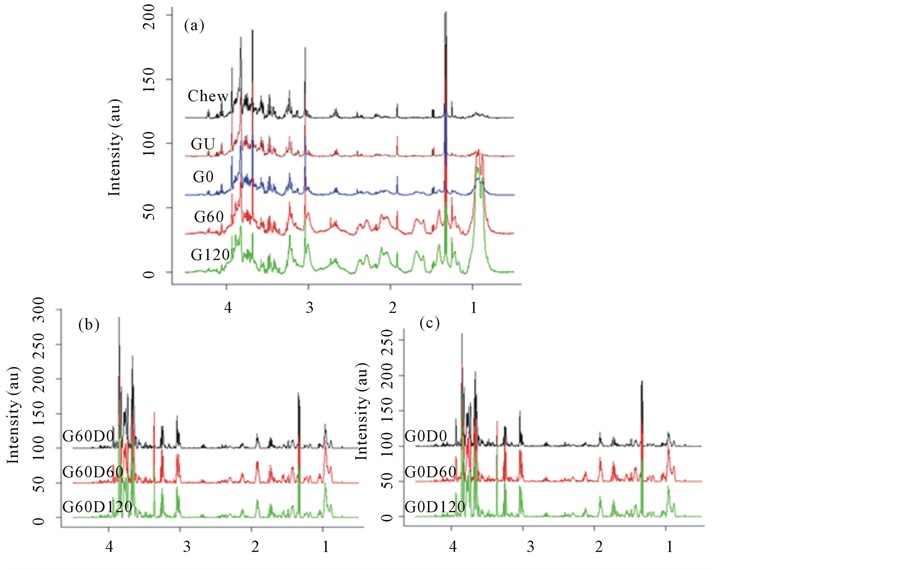
Figure 3. 1H NMR spectra of metabolites from ham following (a) model chew and in vitro gastric digestion, and subsequent in vitro, duodenal digestion of gastric time points at 0 min (b; G0) and 60 min (c; G60). Data show the breakdown of the ham over the digestion time course.
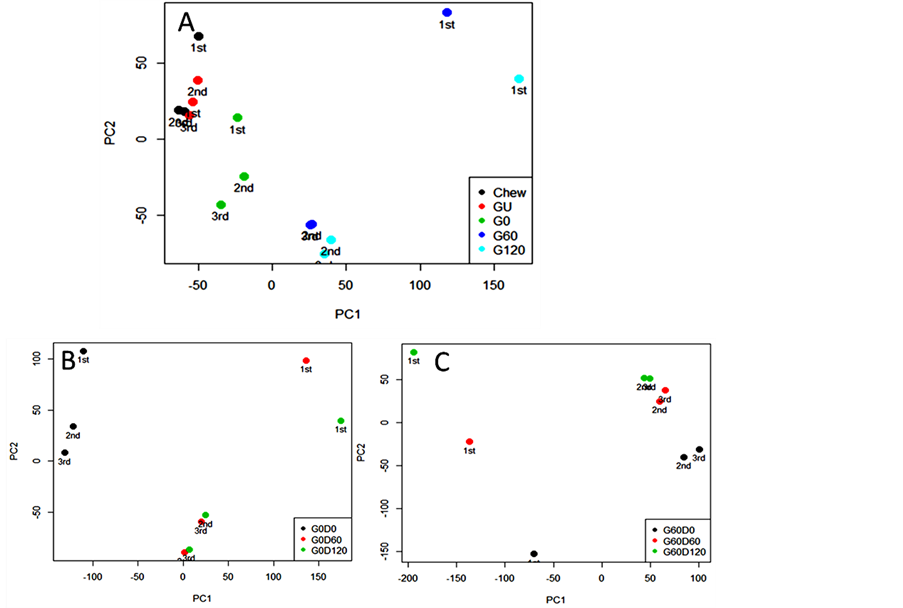
Figure 4. PCA score plots of 1H NMR metabolite profiles of ham following (A) model chew and in vitro gastric and subsequent in vitro duodenal digestion of gastric time points at 0 min (B; G0) and 60 min (C; G60).
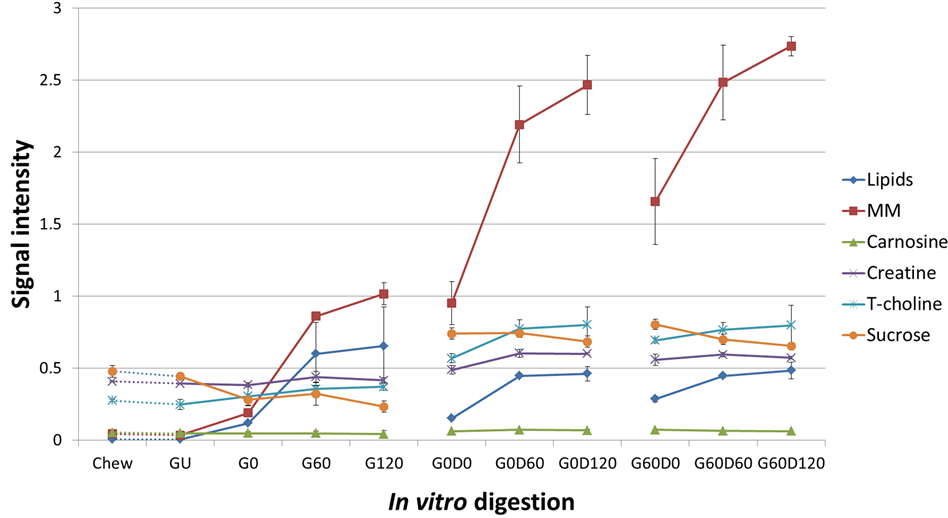
Figure 5. NMR signal intensity showing the relative quantification of specific nutrients during the digestive process. (A) Model chew and in vitro gastric digestion; subsequent in vitro duodenal digestion of gastric time points at 0 min (B; G0) and 60 min (C; G60).
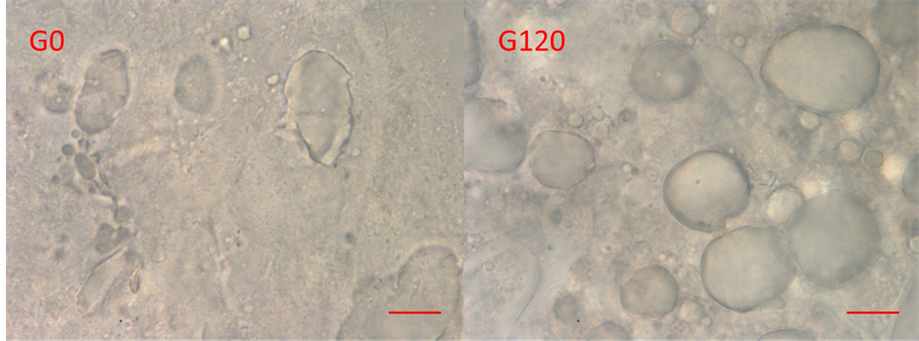
Figure 6. Images of the insoluble material from the ham samples after 0 (G0) and 120 min (G120) in vitro gastric digestion show structural changes taking place in the ham. The scale bar represents 10 μm. The magnification time is 100×.
Quantification analysis with signal integration makes it possible to compare digestion rates for different nutrients in different stages of digestion (Figure 5). Release of soluble polypeptides (MM) which are released from the ham is closely related to the protein digestion. It progressively increases during the gastric and subsequent duodenal phases of digestion and is consistent with changes in protein digestion observed by SDS-PAGE. The release pattern of total choline is similar to that of the lipids yet less dramatic, indicating that lipids might be the main source of detected choline. The level of sucrose remained stable with a slight decrease which indicates that the carbohydrates are easily accessible at the beginning of the digestion.
5. Conclusion
CHANCE ham is a good source of dietary protein with a good digestibility. The combined approach of in vitro digestion and nutrimetabolomics study is a valid model to assess the molecular profile and bio-accessibility of all detectable nutrients in a human digestive system after the consumption of specific food. This model can be further utilized in food intervention studies to optimize diets that would be beneficial to human health.
Acknowledgements
We are grateful for funding support from CHANCE project (FP7 GA N. 266331). The NMR experiments used the NMR facility at Manchester Institute of Biotechnology. We would like to thank Dr Steven Marsden for his assistance with the microscopy.
REFERENCES
- S. J. Hur, et al., “In Vitro Human Digestion Models for Food Applications,” Food Chemistry, Vol. 125, No. 1, 2011, pp. 1-12. http://dx.doi.org/10.1016/j.foodchem.2010.08.036
- K. A. Kopf-Bolanz, et al., “Validation of an in Vitro Digestive System for Studying Macronutrient Decomposition in Humans,” Journal of Nutrition, Vol. 142, No. 2, 2012, pp. 245-250. http://dx.doi.org/10.3945/jn.111.148635
- S. J. Hur, et al., “The Effects of Biopolymer Encapsulation on Total Lipids and Cholesterol in Egg Yolk during in Vitro Human Digestion,” International Journal of Molecular Sciences, Vol. 14, No. 8, 2013, pp. 16333-16347. http://dx.doi.org/10.3390/ijms140816333
- S. J. Hur, et al., “Effects of Various Fiber Additions on Lipid Digestion during in Vitro Digestion of Beef Patties,” Journal of Food Science, Vol. 74, No. 9, 2009, pp. C653-C657. http://dx.doi.org/10.1111/j.1750-3841.2009.01344.x
- D. G. Fatouros and A. Mullertz, “In Vitro Lipid Digestion Models in Design of Drug Delivery Systems for Enhancing Oral Bioavailability,” Expert Opinion on Drug Metabolism & Toxicology, Vol. 4, No. 1, 2008, pp. 65-76. http://dx.doi.org/10.1517/17425255.4.1.65
- M. Wickham, R. Faulks and C. Mills, “In Vitro Digestion Methods for Assessing the Effect of Food Structure on Allergen Breakdown,” Molecular Nutrition & Food Research, Vol. 53, No. 8, 2009, pp. 952-958. http://dx.doi.org/10.1002/mnfr.200800193
- C. H. M. Versantvoort, et al., “Applicability of an in Vitro Digestion Model in Assessing the Bioaccessibility of Mycotoxins from Food,” Food and Chemical Toxicology, Vol. 43, No. 1, 2005, pp. 31-40. http://dx.doi.org/10.1016/j.fct.2004.08.007
- L. Marciani, et al., “Antral Motility Measurements by Mag- netic Resonance Imaging,” Neurogastroenterology and Motility, Vol. 13, No. 5, 2001, pp. 511-518. http://dx.doi.org/10.1046/j.1365-2982.2001.00285.x
- L. Marciani, et al., “Monitoring of Gallbladder and Gastric Coordination by EPI,” Journal of Magnetic Resonance Imaging, Vol. 21, No. 1, 2005, pp. 82-85. http://dx.doi.org/10.1002/jmri.20223
- S. Ballance, et al., “Evaluation of Gastric Processing and Duodenal Digestion of Starch in Six Cereal Meals on the Associated Glycaemic Response Using an Adult Fasted Dynamic Gastric Model,” European Journal of Nutrition, Vol. 52, No. 2, 2013, pp. 799-812. http://dx.doi.org/10.1007/s00394-012-0386-5
- D. A. Volpe, “Drug-Permeability and Transporter Assays in Caco-2 and MDCK Cell Lines,” Future Medicinal Chemistry, Vol. 3, No. 16, 2011, pp. 2063-2077. http://dx.doi.org/10.4155/fmc.11.149
- K. Dettmer, P. A. Aronov and B. D. Hammock, “Mass Spectrometry-Based Metabolomics,” Mass Spectrometry Reviews, Vol. 26, No, 1, 2007, pp. 51-78. http://dx.doi.org/10.1002/mas.20108
- F. Dieterle, et al., “NMR and MS Methods for Metabonomics,” Methods in Molecular Biology, Vol. 691, 2011, pp. 385-415. http://dx.doi.org/10.1007/978-1-60761-849-2_24
- J. H. Winnike, et al., “Effects of a Prolonged Standardized Diet on Normalizing the Human Metabolome,” The American Journal of Clinical Nutrition, Vol. 90, No. 6, 2009, pp. 1496-1501. http://dx.doi.org/10.3945/ajcn.2009.28234
- G. Pratico, et al., “Exploring Human Breast Milk Composition by NMR-Based Metabolomics,” Natural Product Research, 2013. http://dx.doi.org/10.1080/14786419.2013.843180
- C. Fotakis, et al., “NMR Metabolite Profiling of Greek Grape Marc Spirits,” Food Chemistry, Vol. 138, No. 2-3, 2013, pp. 1837-1846. http://dx.doi.org/10.1016/j.foodchem.2012.11.128
- A. Bordoni, et al., “NMR Comparison of in Vitro Digestion of Parmigiano Reggiano Cheese Aged 15 and 30 Months,” Magnetic Resonance in Chemistry, Vol. 49, Suppl. 1, 2011, pp. S61-S70. http://dx.doi.org/10.1002/mrc.2847
- J. M. Hakumäki and R. A. Kauppinen, “1H NMR Visible Lipids in the Life and Death of Cells,” Trends in Biochemical Sciences, Vol. 25, No. 8, 2000, pp. 357-362. http://dx.doi.org/10.1016/S0968-0004(00)01614-5
- G. Mandalari, et al., “In Vitro Digestibility of Beta-Casein and Beta-Lactoglobulin under Simulated Human Gastric and Duodenal Conditions: A Multi-Laboratory Evaluation,” Regulatory Toxicology and Pharmacology, Vol. 55, No. 3, 2009, pp. 372-381. http://dx.doi.org/10.1016/j.yrtph.2009.08.010
- F. J. Moreno, et al., “Stability of the Major Allergen Brazil Nut 2S Albumin (Ber e 1) to Physiologically Relevant in Vitro Gastrointestinal Digestion,” FEBS Journal, Vol. 272, No. 2, 2005, pp. 341-352. http://dx.doi.org/10.1111/j.1742-4658.2004.04472.x
- H. Wu, et al., “High-Throughput Tissue Extraction Protocol for NMRand MS-Based Metabolomics,” Analytical Biochemistry, Vol. 372, No. 2, 2008, pp. 204-212. http://dx.doi.org/10.1016/j.ab.2007.10.002
- I. K. Straadt, M. D. Aaslyng and H. C. Bertram, “Assessment of Meat Quality by NMR—An Investigation of Pork Products Originating from Different Breeds,” Magnetic Resonance in Chemistry, Vol. 49, Suppl. 1, 2011, pp. S71-S78. http://dx.doi.org/10.1002/mrc.2805
- V. Tugnoli, et al., “1H-NMR and 13C-NMR Lipid Profiles of Human Renal Tissues,” Biopolymers, Vol. 72, No. 2, 2003, pp. 86-95. http://dx.doi.org/10.1002/bip.10299
- V. Govindaraju, K. Young and A. A. Maudsley, “Proton NMR Chemical Shifts and Coupling Constants for Brain Metabolites,” NMR in Biomedicine, Vol. 13, No. 3, 2000. pp. 129-153. http://dx.doi.org/10.1002/1099-1492(200005)13:3<129::AID-NBM619>3.0.CO;2-V
- M. Gottschalk, et al., “Metabolomic Studies of Human Lung Carcinoma Cell Lines Using in Vitro 1H NMR of Whole Cells and Cellular Extracts,” NMR in Biomedicine, Vol. 21, No. 8, 2008, pp. 809-819. http://dx.doi.org/10.1002/nbm.1258
- D. S. Wishart, et al., “HMDB 3.0—The Human Metabolome Database in 2013,” Nucleic Acids Research, Vol. 41, 2013, pp. D801-D807. http://dx.doi.org/10.1093/nar/gks1065
- J. H. Choe, et al., “The Relation between Glycogen, Lactate Content and Muscle Fiber Type Composition, and Their Influence on Postmortem Glycolytic Rate and Pork Quality,” Meat Science, Vol. 80, No. 2, 2008, pp. 355- 362. http://dx.doi.org/10.1016/j.meatsci.2007.12.019
- D. B. Silk, G. K. Grimble and R. G. Rees, “Protein Digestion and Amino Acid and Peptide Absorption,” Proceedings of the Nutrition Society, Vol. 44, No. 1, 1985, pp. 63-72. http://dx.doi.org/10.1079/PNS19850011
- S. Chu and M. L. Schubert, “Gastric Secretion,” Current Opinion in Gastroenterology, Vol. 29, No. 6, 2013, pp. 636-641. http://dx.doi.org/10.1097/MOG.0b013e328365efc7
- A. M. Wang, Ma, C., Z. H. Xie and F. Shen, “Use of Carnosine as a Natural Anti-Senescence Drug for Human Beings,” Biochemistry (Mosc), Vol. 65, No. 7, 2000, pp. 869-871.
- C. Bauchart, et al., “Carnosine Concentration of Ingested Meat Affects Carnosine Net Release into the Portal Vein of Minipigs,” The Journal of Nutrition, Vol. 137, No. 3, 2007, pp. 589-593.
- J. K. Blusztajn, “Choline, a Vital Amine,” Science, Vol. 281, No. 5378, 1998, pp. 794-795. http://dx.doi.org/10.1126/science.281.5378.794
- B. Banerjee, et al., “Effect of Creatine Monohydrate in Improving Cellular Energetics and Muscle Strength in Ambulatory Duchenne Muscular Dystrophy Patients: A Randomized, Placebo-Controlled 31P MRS Study,” Magnetic Resonance Imaging, Vol. 28, No. 5, 2010, pp. 698- 707. http://dx.doi.org/10.1016/j.mri.2010.03.008
- R. W. Purchas, J. R. Busboom and B. H. P. Wilkinson, “Changes in the Forms of Iron and in Concentrations of Taurine, Carnosine, Coenzyme Q10, and Creatine in Beef Longissimus Muscle with Cooking and Simulated Stomach and Duodenal Digestion,” Meat Science, Vol. 74, No. 3, 2006, pp. 443-449. http://dx.doi.org/10.1016/j.meatsci.2006.03.015
- J. M. Hakumaki and R. A. Kauppinen, “1H NMR Visible Lipids in the Life and Death of Cells,” Trends in Biochemical Sciences, Vol. 25, No. 8, 2000, pp. 357-362. http://dx.doi.org/10.1016/S0968-0004(00)01614-5
- X. Pan, et al., “The Size of Cytoplasmic Lipid Droplets Varies between Tumour Cell Lines of the Nervous System: a 1H NMR Spectroscopy Study,” Magnetic Resonance Materials in Physics, Biology and Medicine, Vol. 25, No. 6, 2012, pp. 479-485. http://dx.doi.org/10.1007/s10334-012-0315-x