Food and Nutrition Sciences
Vol.4 No.5(2013), Article ID:31010,7 pages DOI:10.4236/fns.2013.45064
Using Response Surface Methodology and High-Intensity Sweeteners’ Positive Synergy to Optimize Peach Nectar Acceptability
![]()
1Department of Biochemical Engineering, School of Chemistry, Federal University of Rio de Janeiro, Rio de Janeiro, Brazil; 2Department of Food and Nutrition, University of Campinas, Campinas, Brazil.
Email: *lauro@eq.ufrj.br
Copyright © 2013 Lauro Melo et al. This is an open access article distributed under the Creative Commons Attribution License, which permits unrestricted use, distribution, and reproduction in any medium, provided the original work is properly cited.
Received February 21st, 2013; revised March 21st, 2013; accepted March 28th, 2013
Keywords: Sweetener Blends; Aspartame; Acesulfame-K; CCRD; RSM; Sensory Evaluation
ABSTRACT
Combining the high-intensity sweeteners’ positive synergy with response surface methodology (RSM), it is possible to optimize food and beverage products liking, masking undesired sensory attributes and reducing costs and consumers’ additives intake (up to 50%). A RSM based on a five-level, two variable central composite rotatable designs (CCRD) was applied, varying aspartame and acesulfame-K concentrations in order to optimize consumers’ sensory liking (n = 118) for peach nectar in terms of appearance, aroma, flavor, and overall liking. Statistically valid models were found for flavor and overall liking attributes and highest liking values were found for samples combining the two sweeteners (therefore overcoming acesulfame-K’s sensory limitations) in lower concentrations, confirming the synergetic effect and allowing cost reduction and less additives intake, without losing sensory quality.
1. Introduction
Nowadays, consumers expect to obtain pleasure from food and require that this food has good sensory qualities; therefore, food and drink manufacturers are continuously working to improve the sensory quality of foods to respond to consumers’ expectations [1]. On the other hand, consumers wish products with low percentage of fats, sugar and calories, in order to increase or maintain their health and well being. Beverage manufacturers have been using sweetener blends instead of single sweeteners in reduced-calorie beverages for some time now, with many successful products well established in the marketplace [2].
The beverage industry frequently uses sweetener blends to overcome the sensory limitations of individual sweeteners [3]. Several additives with the same function, as high-intensity sweeteners, can show synergistic effects, which provide an improved end result and also permit the reduction of the amounts needed for each individual component. That is particularly important when it comes to safe additive levels intake [4]. The synergism of blends among different sweeteners makes possible the reduction of their individual quantities, turning their use safer and more desirable than the isolated ones. These mixtures, in different proportions, can also allow the improvement of functional and sensorial characteristics desired for a product [5].
Combinations of sweeteners have multiple benefits because they provide synergistic taste enhancement (positive synergy) often associated with a perceived improvement of the taste profile. The use of sweeteners blends makes possible to increase the stability of sweetness and sweetening power, to improve the sweetness quality, to reduce costs and also to increase the lowcalorie product choices for the consumer [6,7].
For instance, acesulfame-K in peach nectar was reported with high grades in the sensory attributes bitterness and residual bitterness-unpleasant attributes that may negatively influence its consumers’ acceptance [8]. A significant reduction of the non-sweet tastes and aftertastes usually associated with acesulfame-K and cyclamate was observed when they were used in blends [1]. Noble et al. [9] reported no non-sweet side tastes for the aspartame-acesulfame-K blend in aqueous solution, and a reduction of the lingering sweetness of aspartame was also observed in the fruit-flavored aqueous solutions. The sensory profiles of aspartame, aspartame/acesulfame-K blend and sucralose were the most similar to 10% highfructose corn syrup [3].
Response surface methodology (RSM) is an important tool in process and product improvement [10] (Altan et al., 2008). RSM consists of a group of mathematical and statistical procedures that can be used to study relationships between one or more responses (dependent variables) and a number of factors (independent variables) [11]. In the last decade, RSM has been successfully used to adjust formulations [12-22] and process conditions [10,23-31], reducing the number of trials and providing multiple regression approach to achieve optimization [18]. In addition, for each product, the sweeteners’ potencies and synergies are unique, because they depend on the dispersion matrix in which sweeteners are found. Thus one must evaluate the replacement of sucrose by sweeteners in each food separately [32]. However, to the best of our knowledge, there are no studies using response surface methodology to explore the positive synergistic power of high-intensity sweeteners, optimizing the liking of a food or beverage product in relation to its sweetener blend proportions.
Therefore, the objective of the current exploratory study was to optimize peach nectar liking with regards to proportions of aspartame/acesulfame-K used in blends, using response surface methodology (RSM) and aiming to obtain the product with the most possible sensory appealing. As a consequence, it would be possible to reduce costs and additives intake with less high-intensity sweetener ingredients.
2. Material and Methods
2.1. Materials
Peach nectar samples were prepared with unsweetened concentrated juice (Del Valle, Americana-SP, Brazil). The samples were sweetened with sucrose and high-intensity sweeteners aspartame (Nutrasweet, São Paulo-SP, Brazil) and acesulfame-K (Steviafarma, Maringá-PR, Brazil), and their blends.
2.2. Sample Preparation
Samples were prepared in laboratory following the procedure used by the manufacturer:
1) Hydration of the concentrated base, according to the manufacturer’s recommendations: each 181.46 g of concentrated base should be hydrated up to 1000 g, total solution.
2) Homogenizing at 2500 psi the mixture.
3) Following peach nectar producer’ instructions, pasteurization in a microwave oven to 98.0˚C, hot-filling in bottles, cooling in water (20˚C) to room temperature. A maximum of 1 L was pasteurized at a time, for 6 minutes, in order to avoid the loss of aroma volatiles as much as possible. More information on sample preparation can be provided contacting authors and under peach nectar manufacturer approval.
2.3. Response Surface Methodology
Response surface methodology (RSM) was based on a five-level (−α, −1, 0, 1, and α), two variable central composite rotatable design (CCRD). The independent variables were aspartame (X1) and acesulfame-K (X2) concentrations and the dependent variable was consumer liking (relating to appearance, aroma, flavor, and overall liking). Actual values of variation levels and experimental design for the experiment are shown in Table 1 [8,33]. Expecting possibly synergistic effect, the central point for each high-intensity sweetener has been chosen using a value (0.04%) smaller than aspartame (0.054%) or acesulfame-K (0.053%) when sweetening peach nectar separately, both sweetness equivalent to 10% sucrose (the ideal sweetness) [33].
The results were analyzed by a multiple linear regression method which describes the effects of variables in firstand second-order polynomial models. Experimental data were fitted to the selected models and regression coefficients obtained.
2.4. Consumer Testing
Participants (“ready-to-drink” fruit nectars consumers—

Table 1. Central composite rotatable design with coded levels and actual variable levels.
at least once a week, recruited amongst faculty staff and students) evaluated peach nectar samples to determine liking of appearance, aroma, flavor, and overall liking. A total of 118 consumers, 52 male and 66 female (44% male and 56% female) with age varying from 18 to 54 years old, have participated in this study. Samples, presented under refrigeration (6˚C), covered the aspartame/ acesulfame-K blends from the central composite rotatable design (CCRD) (see previous section) and samples sweetened only with aspartame (0.054%), acesulfame-K (0.053%), or sucrose (10%) (sucrose at ideal sweetness and aspartame and acesulfame-K at equi-sweet concentrations in peach nectar, see more details in Cardoso & Bolini [33].
Consumer affective testing was carried out using a 9-cm unstructured line scale with anchors “dislike extremely” and “like extremely”. According to Greene et al. [34], there is evidence of no decrease in sensitivity and reliability with regards to consumer perception using line scales instead of 9-point hedonic scale. Samples (20 mL) coded with three-digit numbers were presented monadically in a balanced block design [35] to 118 consumers on disposable plastic glasses. Sensory tests were carried out in individual air-conditioned booths. Taste-free water was provided for palate cleansing. In addition, there was a 2-minute break after each sample and a 10-minute break after the seventh sample to minimize sensory fatigue. Consumers’ decisions were based solely on the sensory characteristics of the samples, since product information and formulation were not provided.
2.5. Statistical Analyses
The liking results were analyzed by ANOVA, using two factors (consumer-random, and sample-fixed), and Tukey’s HSD average test. ANOVA, Tukey’s HSD average test and response surface regressions of liking data (including ANOVA of the model) were performed using the software STATISTICA 7.0 (StatSoft, Inc.). Internal preference mapping [36] based on overall liking data was also performed.
3. Results and Discussion
Table 2 shows the results for flavor and overall liking for the central composite rotatable design (samples 1 to 11) and for the other three peach nectar samples sweetened with only one sweetener (samples 12 to 14). Results for appearance and aroma will not be presented since it was not possible to fit statistically valid models for these sensory liking attributes. Importantly, Table 2 shows that consumers did not discriminate on appearance and very low discrimination on aroma, which was confirmed by

Table 2. Central composite rotatable design (samples 1 to 11), including three more samples sweetened with only one sweetener (samples 12 to 14).
their not statistically valid models. In addition, a high Pearson correlation (0.88) was found for consumer’s individual dataset between flavor and overall appearance.
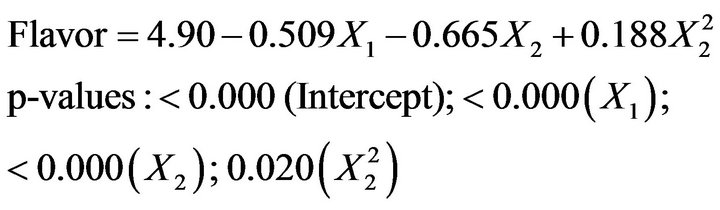
Dependent variables flavor and overall liking were analyzed by multivariate regressions and significance of the models was tested [37] by Analysis of Variance (ANOVA), providing F-test values (72.3 for flavor and 101.2 for overall liking) higher than the critical value of 4.53 (d.f. = 4; p < 0.001; R2 of 0.98 for flavor and 0.99 for overall liking). Thus, it was possible to present statistically valid models (Equations (1) and (2)) for these sensory liking attributes (only statistically significant—p < 0.05-model terms are shown):
 (1)
(1)
 (2)
(2)
(where X1 is percentage of aspartame and X2 is percentage of acesulfame-K).
A better understanding of the influence of the sensory attributes on the peach nectar samples sweetened with high-intensity sweetener blends would be achieved applying a descriptive technique. A previous investigation has studied the sensory descriptive profile of peach nectar sweetened with high-intensity sweeteners applied separately and might bring initial highlights [8]. For instance, Equations (1) and (2) showed that the aspartame concentration decreased flavor and overall liking less than the acesulfame-K concentration did in the linear model terms, which is consistent with descriptive studies that reported bitterness (an undesired characteristic in peach nectar) when adding acesulfame-K to peach nectar [8]. However, acesulfame-K concentration increased flavor and overall liking in the quadratic model terms.
In order to define sweeteners’ influence on peach nectars’ liking, response surfaces and contour diagrams were also generated for flavor and overall liking (Figures 1 and 2), showing higher liking values on the lowest sweeteners concentrations regions.
Samples 1, 5, and 7 (Table 2), containing lower sweetener blend concentrations, presented liking at least equivalent to liking of peach nectar samples with only aspartame (sample 13) or acesulfame-K (sample 14) at concentrations equivalent to sucrose at ideal sweetness (10%) [33]. It is important to highlight that sample 1 (with 0.0232% of sweeteners, combining 0.0116% of aspartame and 0.0116% of acesulfame-K) presented overall liking statistically higher (p < 0.05) than the samples sweetened only with aspartame or acesulfame-K in higher concentrations, equivalent to the ideal sweetness (0.054% and 0.053%, respectively), which confirms the positive synergy between the high-intensity sweeteners and brings sweetener addition and intake reductions higher than 50%. Even considering that aspartame presents less sensory disadvantages than acesulfame-K [38], using a blend of both is strongly economically interesting —without losing sensory quality as proved in our study—to reduce the total amount of added sweeteners.
Figure 3 shows internal preference mapping with the 118 consumers. Preference mapping is in accordance with Tukey’s results, showing that most consumers preferred peach nectar samples 1, 5, 7, and 12 (see Table 2) and that sample 14 (with only acesulfame-K at 0.053%) was the least preferred, demonstrating once again acesulfame-K’s sensory limitations. As an exploratory technique, the internal preference mapping confirmed patterns found with ANOVA and Tukey’s HSD average test.

Figure 1. Response surface and contour diagram for flavor acceptability of peach nectar.

Figure 2. Response surface and contour diagram for overall liking acceptability of peach nectar.
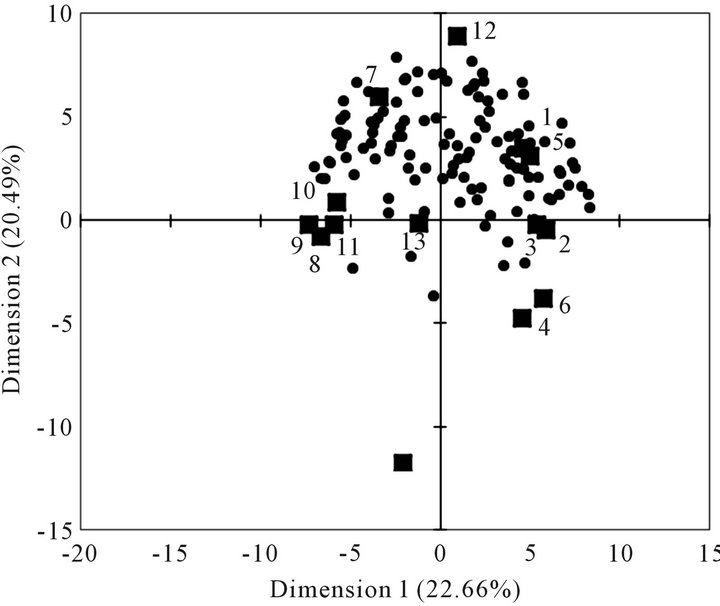
Figure 3. Internal preference mapping indicating the position of the consumers (n = 118) and the peach nectar samples (see Table 2).
Clusters were found but any statistical difference was found between them, using all collected variables (data not shown).
All differences showed in mean separation tests and suggested by the internal preference mapping might be explained by descriptive attributes. From other studies with peach nectar using aspartame and acesulfame-K separately, sensory attributes bitterness and residual bitterness were found, especially with acesulfame-K and other off-flavors (e.g. metallic) might also be involved. Further sensory descriptive analyses on samples with sweetener blends are needed to bring new highlights on consumers’ preferences. It is important to highlight as a possible limitation of this study that these 118 consumers could not represent the Brazilian population sociodemographics, therefore the results about the influence of the sweeteners on consumer liking cannot be generalized.
4. Conclusion
Results showed the importance of the synergistic effect of aspartame/acesulfame-K blend on cost reduction and healthy (up to 50% less additives intake—with 0.0232% of sweeteners, combining 0.0116% of aspartame and 0.0116% of acesulfame-K compared to 0.054% or 0.053 when used separately). Even though acesulfame-K presents sensory limitations, its use combined with aspartame can lead to the positive synergy, reducing costs, additives intake and increasing liking. In this sense, response surface methodology (RSM) showed to be a powerful technique, reducing the number of trials. That is extremely important especially considering that our results are applicable for the studied high-intensity sweeteners—aspartame and acesulfame-K—in peach nectar, given that the sweetness power depends on the substance and on the matrix where the substance is inserted. Same approach can be used during product development and improvement to optimize liking of food and beverages that contain sweeteners, taking advantage of their positive synergy and reducing costs and consumers’ additives intake.
5. Acknowledgements
Financial support for this study was provided in part by the Conselho Nacional de Desenvolvimento Científico e Tecnológico—CNPq—Brazil and FAPESP. This research could not have been completed without the generous cooperation of our panellists.
REFERENCES
- M. O. Portmann and D. Kilcast, “Descriptive Profiles of Synergistic Mixtures of Bulk and Intense Sweeteners,” Food Quality and Preference, Vol. 9, No. 4, 1998, pp. 221-229. doi:10.1016/S0950-3293(97)00071-2
- S. Meyer and W. E. Riha, “Optimizing Sweetener Blends for Low-Calorie Beverages,” Food Technology, Vol. 56 No. 7, 2002, pp. 42-45.
- L. Q. Zhao and B. J. Tepper, “Perception and Acceptance of Selected High-Intensity Sweeteners and Blends in Model Soft Drinks by Propylthiouracil (PROP) Non-Tasters and Super-Tasters,” Food Quality and Preference, Vol. 18, No. 3, 2007, pp. 531-540. doi:10.1016/j.foodqual.2006.07.004
- D. Arcella, C. Le Donne and C. Leclercq, “Dietary Exposure to Chemicals within the Process of Risk Assessment: Possible Applications to Substances that May Cause Allergic Reactions,” Proceedings of the Nutrition Society, Vol. 64, No. 4, 2005, pp. 418-425. doi:10.1079/PNS2005451
- T. Szmrecsányi and V. M. P. Alvarez, “The Search for a Perfect Substitute: Technological and Economic Trajectories of Synthetic Sweeteners, from Saccharin to Aspartame (c.1880-1980),” International Economic History Congress 1-23, (Session C-36.), Madrid, 1998.
- V. George, S. Arora, B. K. Wadhwa, A. K. Singh and G. S. Sharma, “Optimisation of Sweetener Blends for the Preparation of Lassi,” International Journal of Dairy Technology, Vol. 63, No. 2, 2010, pp. 256-261. doi:10.1111/j.1471-0307.2010.00574.x
- R. C. Reis, V. P. R. Minim, H. M. A. Bolini, B. R. P. Dias, L. A. Minim and E. B. Ceresino, “Swetness Equivalence of Different Sweeteners in Strawberry-Flavored Yogurt,” Journal of Food Quality, Vol. 34, No. 3, 2011, pp. 163-170. doi:10.1111/j.1745-4557.2011.00378.x
- J. M. P. Cardoso and H. M. A. Bolini, “Descriptive Profile of Peach Nectar Sweetened with Sucrose and Different Sweeteners,” Journal of Sensory Studies, Vol. 23, No. 6, 2008, pp. 804-916. doi:10.1111/j.1745-459X.2008.00187.x
- A. C. Noble, N. L. Matysiak and S. Bonnans, “Factors Affecting the Time Intensity Parameters of Sweetness,” Food Technology, Vol. 45, No. 11, 1991, pp. 121-126.
- A. Altan, K. L. McCarthy and M. Maskan, “Extrusion Cooking of Barley Flour and Process Parameter Optimization by Using Response Surface Methodology,” Journal of the Science of Food and Agriculture, Vol. 88, No. 9, 2008, pp. 1648-1659. doi:10.1002/jsfa.3262
- F. M. Diniz and A. M. Martin, “Use of Response Surface Methodology to Describe the Combined Effects of pH, Temperature and E/S Ratio on the Hydrolysis of Dogfish (Squalus acanthias) Muscle,” International Journal of Food Science and Technology, Vol. 31, No. 5, 1996, pp. 419-426. doi:10.1046/j.1365-2621.1996.00351.x
- A. Abdullah and T. C. Cheng, “Optimization of Reduced Calorie Tropical Mixed Fruits Jam,” Food Quality and Preference, Vol. 12, No. 1, 2001, pp. 63-68. doi:10.1016/S0950-3293(00)00030-6
- H. K. Sharma, K. Prasad, S. Jindal, P. Sood and H. Pandey, “Optimization of Ingredients for the Manufacture of Soft-Serve Ice-Cream (Softy) by Response Surface Methodology (RSM),” International Journal of Dairy Technology, Vol. 56, No. 1, 2003, pp. 22-25. doi:10.1046/j.1471-0307.2003.00069.x
- I. A. Castro, J. Tirapegui, R. S. S. F. Silva and A. J. S. Cutrim, “Sensory Evaluation of a Milk Formulation Supplemented with n3 Polyunsaturated Fatty Acids and Soluble Fibres,” Food Chemistry, Vol. 85, No. 4, 2004, pp. 503-512. doi:10.1016/S0308-8146(02)00456-9
- S. C. Murphy, D. Gilroy, J. F. Kerry, D. J. Buckley and J. P. Kerry, “Evaluation of Surimi, Fat and Water Content in a Low/No Added Pork Sausage Formulation Using Response Surface Methodology,” Meat Science, Vol. 66, No. 3, 2004, pp. 689-701. doi:10.1016/j.meatsci.2003.07.001
- C. A. Chu and A. V. A. Resurreccion, “Sensory Profiling and Characterization of Chocolate Peanut Spread Using Response Surface Methodology,” Journal of Sensory Studies, Vol. 20, No. 3, 2005, pp. 243-274. doi:10.1111/j.1745-459X.2005.00023.x
- E. M. S. Juan, E. V. Edra, J. M. Sales, A. O. Lustre and A. V. A. Resurreccion, “Utilization of Peanut Fines in the Optimization of Peanut Polvoron Using Mixture Response Surface Methodology,” International Journal of Food Science & Technology, Vol. 41, No. 7, 2006, pp. 768-774. doi:10.1111/j.1365-2621.2005.01065.x
- H. E. Gan, R. Karin, S. K. S. Muhammad, J. A. Bakar, D. M. Hashim and R. A. Rahman, “Optimization of the Basic Formulation of a Traditional Baked Cassava Cake Using Response Surface Methodology,” Lwt-Food Science and Technology, Vol. 40, No. 4, 2007, pp. 611-618. doi:10.1016/j.lwt.2006.05.005
- R. P. Deshpande, M. S. Chinnan and K. H. McWatters, “Optimization of a Chocolate-Flavored, Peanut-Soy Beverage Using Response Surface Methodology (RSM) as Applied to Consumer Acceptability Data,” Lwt-Food Science and Technology, Vol. 41, No. 8, 2008, pp. 1485- 1492. doi:10.1016/j.lwt.2007.08.013
- J. Y. Kim, H. S. Seo, M. J. Seo, J. W. Suh, I. K. Hwang and G. E. Ji, “Development of S-Adenosyl-L-Methionine (SAM)-Reinforced Probiotic Yogurt Using Bifidobacterium Bifidum BGN4,” Food Science and Biotechnology, Vol. 17, No. 5, 2008, pp. 1025-1031.
- K. Nair and D. K. Thompkinson, “Optimization of Ingredients for the Formulation of a Direct Acidified Whey Based Lassi-Like Beverage,” International Journal of Dairy Technology, Vol. 61, No. 2, 2008, pp. 199-205. doi:10.1111/j.1471-0307.2008.00387.x
- D. Granato, I. A. De Castro, L. S. N. Ellendersen and M. L. Masson, “Physical Stability Assessment and Sensory Optimization of a Dairy-Free Emulsion Using Response Surface Methodology,” Journal of Food Science, Vol. 75, No. 3, 2010, pp. S149-S155. doi:10.1111/j.1750-3841.2010.01514.x
- R. N. Chávez-Jáuregui, M. E. M. P. Silva and J. A. G. Areas, “Extrusion Cooking Process for Amaranth (Amaranthus caudatus L.),” Journal of Food Science, Vol. 65, No. 6, 2000, pp. 1009-1015. doi:10.1111/j.1365-2621.2000.tb09408.x
- L. C. Mendes, H. C. Menezes and M. A. A. P. Silva, “Optimization of the Roasting of Robusta Coffee (C. Canephora Conillon) Using Acceptability Tests and RSM,” Food Quality and Preference, Vol. 12, No. 2, 2001, pp. 153-162. doi:10.1016/S0950-3293(00)00042-2
- P. S. Madamba and R. I. Lopez, “Optimization of the Osmotic Dehydration of Mango (Mangifera indica L.) Slices,” Drying Technology, Vol. 20, No. 6, 2002, pp. 1227-1242. doi:10.1081/DRT-120004049
- C. Alarcón-Valdez, J. Millán-Carrilo, O. G. CárdenasValenzuela, R. Mora-Escobedo, L. A. Bello-Pérez and C. Reyes-Moreno, “Infant Food from Quality Protein Maize and Chickpea: Optimization for Preparing and Nutritional Properties,” International Journal of Food Sciences and Nutrition, Vol. 56, No. 4, 2005, pp. 273-285.
- W. L. Kerr, X. Wang and S. G. Choi, “Physical and Sensory Characteristics of Low-Fat Italian Sausage Prepared with Hydrated Oat,” Journal of Food Quality, Vol. 28, No. 1, 2005, pp. 62-77. doi:10.1111/j.1745-4557.2005.00010.x
- S. K. Loh, Y. B. C. Man, C. P. Tan, A. Ozman and N. S. A. Hamid, “Process Optimisation of Encapsulated Pandan (Pandanus amaryllifolius) Powder Using Spray-Drying Method,” Journal of the Science of Food and Agriculture, Vol. 85, No. 12, 2005, pp. 1999-2004. doi:10.1002/jsfa.2169
- C. Fernández, M. D. Alvarez and W. Canet, “The Effect of Low-Temperature Blanching on the Quality of Fresh and Frozen/Thawed Mashed Potatoes,” International Journal of Food Science and Technology, Vol. 41, No. 5, 2006, pp. 577-595.
- Y. S. Kumar, R. S. Prakasam and O. V. S. Reddy, “Optimisation of Fermentation Conditions for Mango (Mangifera indica L.) Wine Production by Employing Response Surface Methodology,” International Journal of Food Science & Technology, Vol. 44, No. 11, 2009, pp. 2320-2327.
- D. Rehrah, M. Ahmedna, I. Goktepe and J. Yu, “Extrusion Parameters and Consumer Acceptability of a Peanut-Based Meat Analogue,” International Journal of Food Science and Technology, Vol. 44, No. 10, 2009, pp. 2075-2084.
- R. S. Cadena and H. M. A. Bolini, “Ideal and Relative Sweetness of High Intensity Sweeteners in Mango Nectar,” International Journal of Food Science & Technology, Vol. 47, No. 5, 2012, pp. 991-996.
- J. M. P. Cardoso and H. M. A. Bolini, “Different Sweeteners in Peach Nectar: Ideal and Equivalent Sweetness,” Food Research International, Vol. 40, No. 10, 2007, pp. 1249-1253.
- J. L. Greene, K. J. Bratka, M. A. Drake and T. H. Sanders, “Effectiveness of Category and Line Scales to Characterize Consumer Perception of Fruity Fermented Flavor in Peanuts,” Journal of Sensory Studies, Vol. 21, No. 2, 2006, pp. 146-154.
- H. J. MacFie, N. Bratchell, K. Greenhoff and L. V. Vallis, “Designs to Balance the Effect of Order of Presentation and First-Order Carry-Over Effects in Hall Tests,” Journal of Sensory Studies, Vol. 4, No. 2, 1989, pp. 129-148.
- G. Hough, I. Wakeling, A. Mucci, E. Chambers IV, I. M. Gallardo and L. R. Alves, “Number of Consumers Necessary for Sensory Acceptability Tests,” Food Quality and Preference, Vol. 17, No. 6, 2006, pp. 522-526.
- J. F. D. M. Burkert, R. R. Maldonado, F. M. Filho and M. I. Rodrigues, “Comparison of Lipase Production by Geotrichum Candidum in Stirring and Airlift Fermenters,” Journal of Chemical Technology & Biotechnology, Vol. 80, No. 1, 2005, pp. 61-67.
- A. Sediva, Z. Panovska and J. Pokorny, “Sensory Profiles of Sweeteners in Aqueous Solutions,” Czech Journal of Food Sciences, Vol. 24, No. 6, 2006, pp. 283-287.
NOTES
*Corresponding author.