Food and Nutrition Sciences
Vol.4 No.6(2013), Article ID:32730,6 pages DOI:10.4236/fns.2013.46080
Effect of Drying Conditions on Rheological Properties of Hydrocolloids Gums from Triumfetta cordifolia and Bridelia thermifolia Barks
![]()
1Départment of Food Sciences & Nutrition, University of Ngaoundéré, Ngaoundéré, Cameroon; 2Laboratory of Rheology, University of Joseph Fourier, Grenoble University, Grenoble, France; 3Départment of Applied, University of Ngaoundéré, Ngaoundéré, Cameroon; 4Laboratory of Function and Structure of Polysaccharids, Center of Vegetables Macromolecules Research, Grenoble, France.
Email: *saidouclement@yahoo.fr
Copyright © 2013 Clément Saidou et al. This is an open access article distributed under the Creative Commons Attribution License, which permits unrestricted use, distribution, and reproduction in any medium, provided the original work is properly cited.
Received November 13th, 2011; revised January 23rd, 2013; accepted February 1st, 2013
Keywords: Barks; Drying Constant; Equilibrium Moisture Content; Gums; Viscosity
ABSTRACT
Triumfetta cordifolia and Bridelia thermifolia are two shrubs from tropical region of Africa. Their gums are traditionally extracted from fresh barks and used in traditional recipes (thickening and aromatization of sauces, improvement of the swelling of maize and bean cakes) and in the process of decantation of traditional beer. In order to valorize these barks in dried form, study of the effect of drying temperature on the rheological properties of their gums was carried out. In this respect, the fresh barks were dried at 40˚C, 50˚C, 60˚C, 70˚C and 80˚C and the viscosity of their extracts was measured. The drying kinetic of the barks showed two falling rate periods represented by two drying constants k1 and k2. The absolute viscosity of the extracts decreased beyond drying temperatures higher than 70˚C and 80˚C respectively for T cordifolia and B. Thermifolia. The decreasing viscosity is attributed mainly to a reorganization of polysaccharide chains. The temperatures range lower than 70˚C could be retained to dry the barks and to extract gums without deteriorating their properties.
1. Introduction
Triumfetta cordifolia and Bridelia thermifolia are two shrubs from tropical regions of Africa. Their barks are locally used for different purposes: thickening of sauces, improvement of the swelling of maize and bean cakes, flocculation and decantation agent in traditional beer preparation. Previous studies have evidenced that these functional properties are due to high molecular weight polysaccharides contained in the barks. These polysaccharides are rich in galactose residue (31% - 62%), suggesting a galactan backbone for the polysaccharides structure. The others sugar residue of the polysaccharides are arabinose (22% - 30%) in the two gums and glucose (22% - 36%) in B. thermifolia [1].
The barks are sold on local markets either fresh or dried. Though the dried presentation seems more to be the result of long stay of barks in free atmosphere, when exposed for marketing, than a real will to dry them, this presentation allows distribution of barks for extended periods, and even in non producing areas. In this respect, a question raises whether drying of barks influences their functional properties and consequently those of their gums.
The present paper aims at answering the above question through the characterization of drying behavior of Triumfetta cordifolia and Bridelia thermifolia, coupled to extraction and evaluation of rheological properties of the bark gums during the air drying process. The hypothesis supporting the above objective is based on a probable effect of air drying temperature on gum rheology.
2. Material and Methods
2.1. Source and Preparation of Barks
The plants (Triumfetta cordifolia and Bridelia thermifolia) were harvested from local farms in the northern region of Cameroon. Their barks were removed using stainless steel knife, water cleaned, wiped using a cotton tissue, then cut in rectangular pieces (5 cm × 1 cm for T. cordifolia; 5 cm × 0.5 cm for B. thermifolia barks).
2.2. Drying of Barks
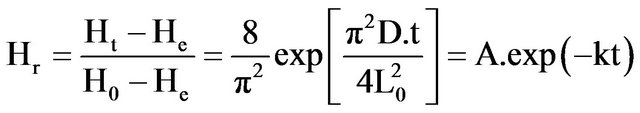
The barks were displayed in monolayer on a pre-weighed tray and dried at 40˚C, 50˚C, 60˚C, 70˚C and 80˚C, in a ventilated dryer (INCUCELL, France) with an air flow rate of 0.5 ms−1. The tray containing the samples was periodically weighed all along the drying process until mass stabilization indicating the end of drying. For each run, drying experiment was conducted in triplicate, and from the three values of tray weight, average of sample moisture was determined as a function of time. The values obtained were then used to build the drying curves and to calculate the drying parameters. These parameters, consisting in the equilibrium moisture (He) and the drying constant (k), were determined from the simplified equation (1) of Henderson and Perry [2] and Perry et al. [3] expressing the removable moisture ratio (Hr) of samples during drying. The equation assumes the Fickian diffusion model and the analytical solution proposed by Crank [4], taking into consideration that the evaporation surface is infinitely larger than the thickness of barks and that water repartition is uniform in the barks slices.
 (1)
(1)
where: Hr (gH2O∙g−1 DM) is the removable moisture ratio of samples during drying; Ht (gH2O∙g−1 DM) is the time dependent moisture content of the sample during drying; Ho (gH2O∙g−1 DM) is the initial moisture content of the sample; He (gH2O∙g−1 DM) is the equilibrium moisture content (at the end of the drying process); Lo (m)is the half thickness of bark slice; D (m2∙h−1)is the apparent moisture diffusivity; t (h) is the drying time; and k (h−1) is the drying constant, obtained from the plot of lnHrvs t. Assuming that at equilibrium, the drying rate is zero (2), i.e.
At 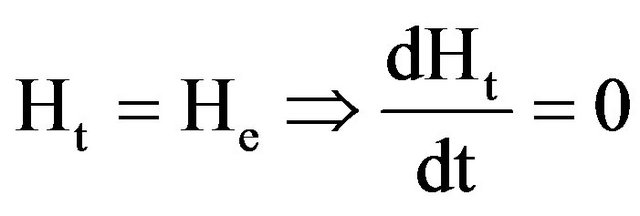 (2)
(2)
Therefore, from plots of near equilibrium final values of dH/dtvs. Ht, and through regression analyses, He values were determined as the point where the graph cuts the Ht axis. The values obtained were included in Equation (1) for the determination of drying constant (k).
2.3. Gum Extraction
Gums were extracted through mixing and agitation of fresh or dried bark slices in distilled water at 50˚C for one hour, using a bark/water ratio of 4 g/150 ml and 4 g/100 ml, respectively for dried and fresh bark slices. Extracts were recuperated and centrifuged (5000 rpm) for 15 min. to remove fine particles in suspension and the homogenous solution obtained was considered as raw gum solutions [5].
2.4. Analysis
2.4.1. Water Content
Water content of fresh and dried barks was determined through drying at 105˚C, using an infra red dryer (Precisa, Germany).
2.4.2. Chemical Analysis
Free sugar content of gum extracts was analyzed using the method of Fischer and Stain [6]. This analysis was directed by the hypothesis that drying conditions may cause hydrolysis of polysaccharides gums, with subsequent effects on their rheology.
2.4.3. Rheological Analysis
Rheological analysis were undergone on raw gum extracts, considered as concentrated solutions, and on diluted extracts obtained by mixing the raw extract with 5 parts of distilled water. Rheology of diluted solutions of gums was conducted at 25˚C using an Ostwald capillary viscosimeter according to the method of Vandana et al. [7], while rheology of concentrated solutions was undergone using a type of ARG2 rheometer (distributed by TA) working under imposed constraint, with cup and bob geometry with inner and outer radii of 22 mm and 24 mm respectively.
2.5. Statistical Analysis
Three replicates were carried out for each parameter and means were obtained from replicate. These mean were compared by analysis of variance (ANOVA) [8] and where significant differences existed, values were classified by Duncan Multiple Range Test [9].
3. Results and Discussion
3.1. Behavior of T. cordifolia and B. thermifolia Barks on Drying
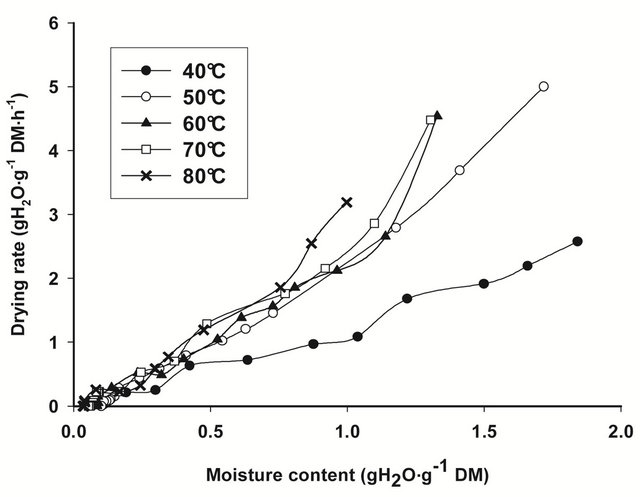
The drying rate curves of bark slices under all drying conditions, calculated from the drying data for each drying run, i.e. from the moisture content change that occurred in each time interval of weighing, are shown on Figure 1. In general, drying rates are highest at the beginning of drying, when moisture content of bark slices are thegreatest, then decline rapidly and linearly towards equilibrium conditions. The slope of the drying curve
 (a)
(a)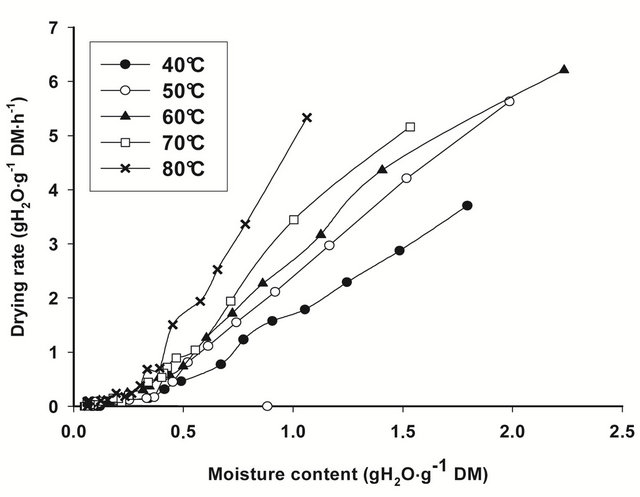 (b)
(b)
Figure 1. Drying rate curves for T. cordifolia (a) and B. thermifolia (b) barks at different drying temperatures.
increase with drying temperature, indicating that the rate of water removal from barks increase with temperature.
From the regression analysis of near equilibrium drying rates data, considering that when Ht = He, dHt/dt = 0, predicted values of equilibrium moisture contents (He) obtained for all drying conditions (Table 1) confirm the predominant effect of temperature: the equilibrium moisture attained at the end of drying is as low as the drying temperature is high. The drying temperature is thus the factor which significantly influences (P ≤ 0.05) the equilibrium moisture content.
By including He values in (1), and undergoing regression analysis of lnHrvst, considering transient moisture content values all along the falling rate period, the falling rate drying curves (Figure 2) and the corresponding drying constants k (Table 2), established for all drying conditions show that the air drying of T. cordifolia and B. thermifolia barks, in our working conditions, occurs in two falling rate, influenced by drying temperature. The
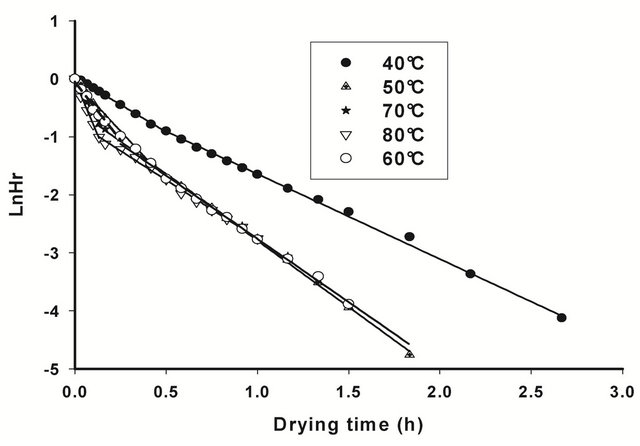 (a)
(a)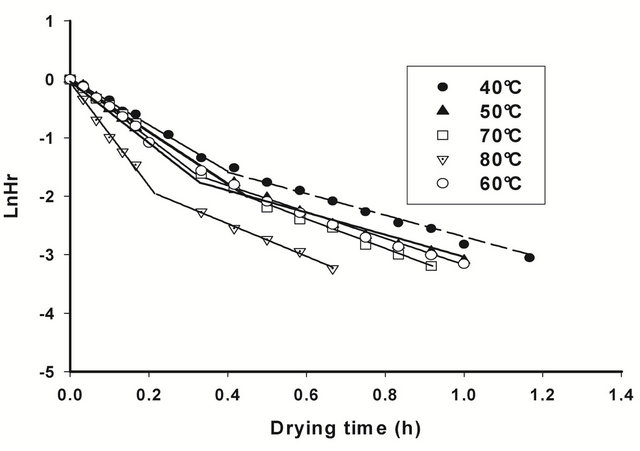 (b)
(b)
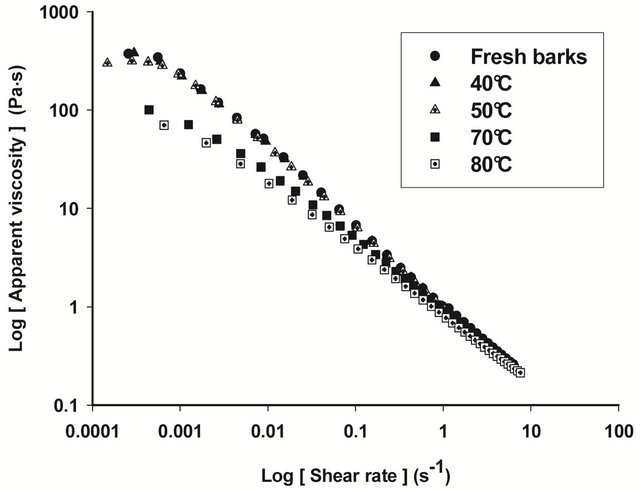
Figure 2. Viscosity curves of native extracts of T. cordifolia (a) and B. thermifolia (b) barks as a function of drying temperature of barks.
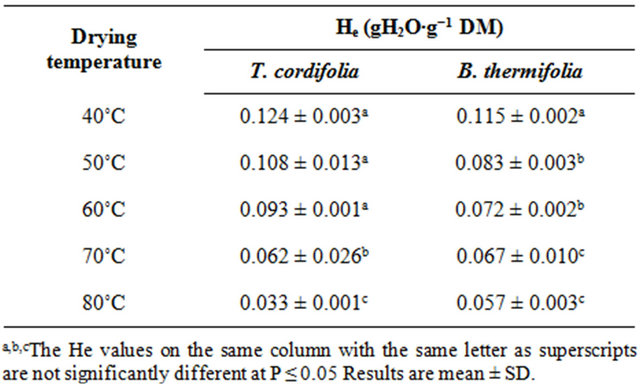
Table 1. Equilibrium moisture contents (He) of air dried barks of T. cordifolia and B. thermifolia, predicted from the transient drying data.
corresponding drying constants obtained conditions, occurs in two falling rate, influenced by drying temperature. The corresponding drying constants obtained from the slope of each falling rate period (Table 2) indicate that these constants increase with drying temperature, par-
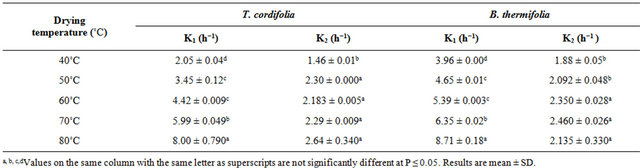
Table 2. Drying constants (k) during the air drying of T. cordifolia and B. thermifolia barks at different temperatures.
ticularly in the first falling period (k1), which means that water dehydration of barks is as high as the drying temperature is high, and that the phenomenon occurs more rapidly in the first falling rate period. By comparing the behavior of T. cordifolia and B. thermifolia barks, it is observed that, at lower drying temperatures (40˚C and 50˚C), k constants in the first falling rate period is higher for B. thermifolia bark than for T. cordifolia bark, while at higher drying temperatures (70˚C and 80˚C), these drying constants are comparable. On the contrary, in the second falling rate period, the drying constants of the two bark species are comparable for a given drying temperature.
In order to define whether the temperature dependence of k is related to a structural or molecular modification, the activation energy of the drying process during the first falling rate period for the two barks was calculated through the Arrhenius plot of the phenomenon, using (3):
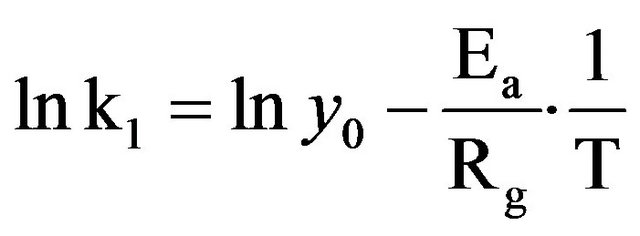 (3)
(3)
where y0 is a constant (h−1), Ea is activation energy or enthalpy (kJ∙mol−1), Rg is universal gas constant (8.314 kJ∙mol−1∙K−1) and T (˚K) is the drying temperature.
Although the Arrhenius plot (Figure 3) exhibits an apparent discontinuity around 70˚C, the significant determination coefficients (R2) of the points (R2 = 0.98 and 0.96, respectively for B. thermifolia and T. cordifolia) indicate that this graphical deviation is not significant.
In addition, the activation energy (Ae) calculated from the slope of the graph is 0.031 kJ∙mol−1 for B. thermifolia and 0.016 kJ∙mol−1 for T. cordifolia. These values are relatively low, compared generally to the minimum activation energy needed to induce molecular modification (10 kj∙mol−1). In this respect, it can be admitted that temperature does not produce structural modifications of molecules contained in barks, but it does not exclude that physical modifications could be observed on barks during the drying.
3.2. Influence of Drying Temperature on the Rheological Properties of Aqueous Gum Extracts from Barks
Figures 4 and 5 show respectively the viscosity graphs of diluted and concentrated aqueous extracts of barks at various drying temperatures. Extracts from fresh barks are considered as reference solutions, since these barks have not been submitted to any drying treatment before gum extraction. Viscosity of diluted extracts (Figure 4) from barks dried between 40˚C and 70˚C is not significantly different (P ≥ 0.05) from that of fresh bark extracts. Meanwhile, a significant decline (P < 0.05) of viscosity is observed beyond 70˚C, which indicates a modification of gum properties. The same phenomenon is observed in concentrated solution (Figure 5) where viscosity curves of gum extracts from barks dried below 50˚C overlap viscosity curve of fresh bark extracts, while beyond that temperature, the viscosity feature of dried bark extracts is low. The decline of gum viscosity at higher temperature seems to indicate, either molecular destabilization of polysaccharides, possibly by acetates hydrolysis if they would exist on these polysaccharides, or a consequence of the presence of impurities in extracts. In this second hypothesis, it could be considered that drying at high temperatures weakens bark tissues which are released in extracts during extraction constituting thus impurities responsible for the decline of viscosity.
In fact, the above results indicate that the environmental temperature at which T. cordifolia and B. thermifolia are distributed on local market does not affect the properties of their gums, since these temperature are low.
3.3. Changes in Free Sugar Content as Influenced by Drying Temperature
If the drop in viscosity above 70˚C is due to the hydrolysis of polysaccharides, this should result in an increase in free sugars in the extracts. The observation in Figure 6 does not show a significant difference (P > 0.05) between the free sugar content of extracts regardless of the drying
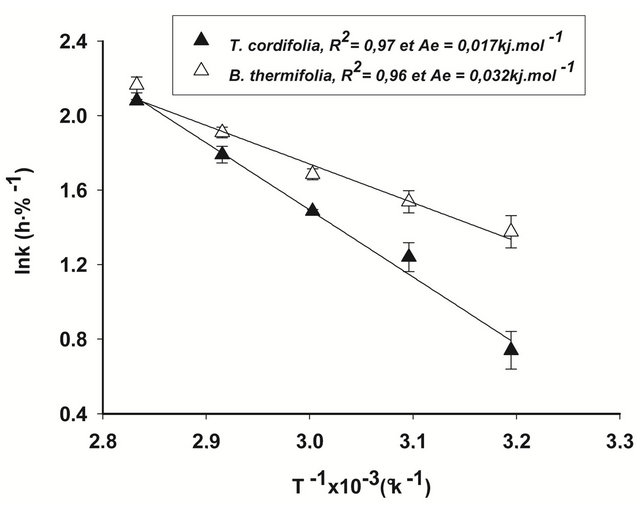
Figure 3. Arrhenius plot of drying constants (k1) for T. cordifolia and B. thermifolia barks.
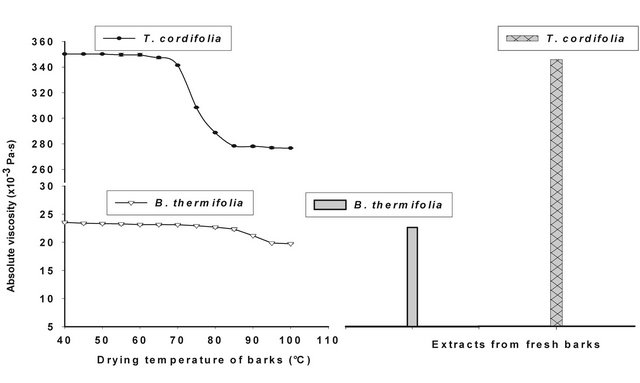
Figure 4. Viscosity of diluted extract of T. cordifolia and B. thermifolia as a function of drying temperature of barks.
temperature. We can therefore assume that the decrease in viscosity of the extracts is rather due more to a change in conformation of polysaccharides during the drying of the bark than to their hydrolysis. This behaviour of gums during drying confirms the results of the Arrhenius plot (Figure 3).
4. Conclusion
The above results suggest that free drying of T. Cordifolia and B. Thermifolia barks does not significantly affect the properties of their gums, except a possible change in conformation of polysaccharides if the drying is carried out beyond 70˚C. This implies that the functional use of the bark is still valid whether they are fresh or dried.
5. Acknowledgements
This work was realized with the support of ProgrammeJeuneséquipes (JEAI) funded by AIRD, France, Région Rhône-Alpes, France and Service de Cooperation et d’
 (a)
(a)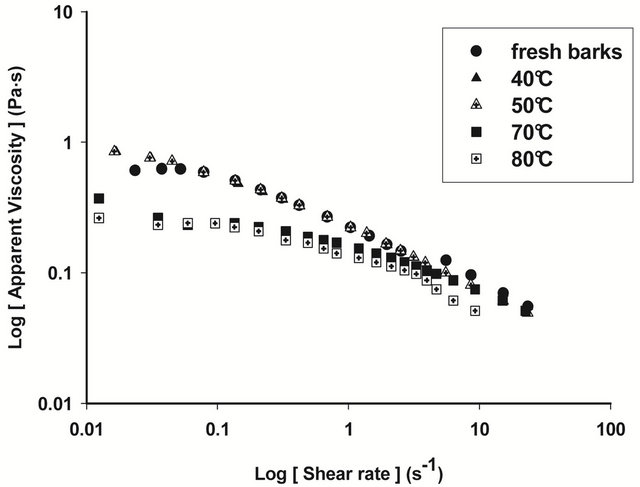 (b)
(b)
Figure 5. Viscosity curves of native extracts of T. cordifolia and B. thermifolia barks as a function of drying temperature of barks.
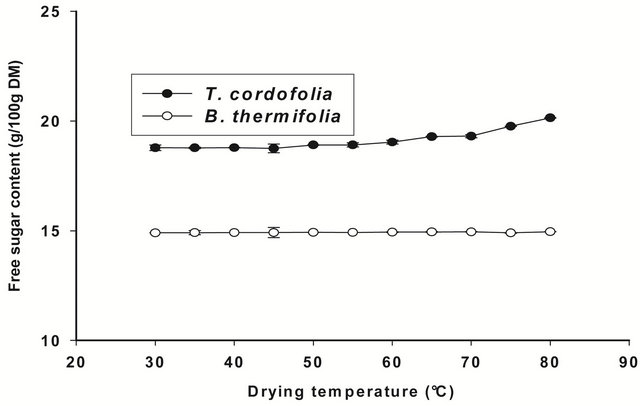
Figure 6. Free sugar content of gum extracts as a function of drying temperature of the barks.
Action Culturelle, embassy of France in Cameroon.
REFERENCES
- C. Saidou, J. B. Tchatchueng, R. Ndjouenkeu and C. D. Roux, “Extraction and Partial Characterization of Hydrocolloids Gums from SOme African Legumes,” International Journal of Food Engineering, Vol. 7, No. 3, 2011, p. 15.
- S. M. Henserson and R. L. Perry, “Agricultural Process Engineering,” AVI Publishing Co. Inc., Connecticut, 1976.
- R. H. Perry, D. W. Green and J. O. Maloney, “Perry’s Chemical Engineerings’ Handbook,” McGraw Hill, New York, 1984.
- J. Crank, “Mathematics of Diffusion,” Oxford University Press, London, 1975.
- R. Ndjouenkeu, F. M. Goycoolea, E. R. Morris and J. O. Akingbala, “Rheology of Okra (Hibiscus esculentus L.) and Dika Nut (Irvingiagabonensis) Polysaccharids,” Carbohydrate Polymer, Vol. 2, No. 29, 1996, pp. 263-269.
- E. H. Fisher and E. A. Stein, “DNS Colorimetric Determination of Available Carbohydrates in Foods,” Biochemical Preparations, Vol. 8, No. 5, 1961, pp. 30-37.
- S. Vandana, S. Vasundhara, P. Meenakshi, S. Rupali and S. Rashmi, “Ipomeaturpethum Seeds: A Potential Source of Commercial Gum,” Carbohydrate Polymers, Vol. 51, No. 3, 2003, pp. 357-359. doi:10.1016/S0144-8617(02)00186-8
- G. W. Snedecor and W. G. Cochran, “Statistical Methods,” 17th Edition, The Lowa State University Press, Ames, 1987, pp. 221-222.
- B. O. Duncan, “Multiple Range. F-Test,” Biometries, Vol. 11, No. 1, 1995, pp. 1-42.
NOTES
*Corresponding author.