Food and Nutrition Sciences
Vol. 2 No. 10 (2011) , Article ID: 16358 , 9 pages DOI:10.4236/fns.2011.210141
Alanine Transaminase Individual Variation Is a Better Marker than Socio-Cultural Factors for Body Mass Increase in Healthy Males
![]()
1Biological Anthropology and Comparative Anatomy Unit, School of Medical Sciences, University of Adelaide, Adelaide, Australia; 2Centre for Evolutionary Medicine, Institute of Anatomy, University of Zurich, Zurich, Switzerland; 3Institute for Empirical Research in Economics University of Zurich, Zurich, Switzerland; 4CESifo, Munich, Germany.
Email: maciej.henneberg@adelaide.edu.au
Received July 27th 2011; revised August 27th, 2011; accepted September 5th, 2011.
Keywords: Switzerland, Young Men, Conscripts, Obesity, Language
ABSTRACT
Overweight and obesity are considered a major burden on public health in developed countries. Underlying etiologies are enigmatic and metabolic causes have been suggested to various extents before. We analyze links of major blood parameters to individual body mass in a young male cohort, controlling for socio-cultural factors, in order to explore an underlying metabolic cause of obesity. Anthropometric (height, weight) physiologic (blood pressure) and metabolic data (total cholesterol, alanine transaminase, creatinine, postprandial glucose, blood cell counts, haemoglobin) of Swiss conscripts (N = 46,684; 18 - 20 yrs old; 2005-2007 census) were examined in the context of their socio-cultural groupings (occupation, mother tongue, religion) by ANOVA and stepwise multiple regression analysis. Swiss Armed Forces recruiting is mandatory, thus each year’s group studied reflects more than 80% of a year’s male Swiss citizen birth cohort. Individual body mass index ranged from 19 kg/m2 (5th percentile) to 29 kg/m2 (95th percentile) with a median of 22 kg/m2. BMI increases significantly, even within its normal range (18.5 - 25 kg/m2) with increases in alanine transaminase (r2 = 0.10), total cholesterol (r2 = 0.08) and erythrocyte counts (r2 = 0.02). All other parameters, including socio-cultural categories, explain individually 1% or less of total BMI variation. Glucose values do not correlate with BMI significantly, thus suggesting a specific metabolic co-etiology of individual mass increases. There may occur a biochemical anomaly in liver metabolism that underlies development of the metabolic syndrome later in life. Were it so, pharmacological intervention rather than just diet and exercise regime could be more effective treatment of obesity.
1. Introduction
Obesity is considered a major problem for public health in the 21st century. It is a major factor influencing economy not only because of correlated disease burden, but also through obesity limiting capacity of some individuals to work and by requiring changes in industrial construction standards, especially in the garment industry [1] and where ergonomic considerations are prominent.
Obesity is commonly considered to be a result of the lifestyle of overnutrition and underexercise. Based on this concept, measures aimed at limiting the increase in adiposity have failed to reverse the trend. Normal biological variation in nutritional physiology and thus in individual responses to food intake and energy expenditure is largely ignored. It can be argued that obesity has two sets of causes: 1) purely lifestyle-related and 2) biological variations. There is natural variation among individuals in metabolic processes such as caloric requirements, energy expenditure, nutrient absorption, processing of nutrients and appetite regulation in response to the variation in neurohormonal regulation of the central nervous system. Moreover, certain metabolic anomalies, such as diabetes type I, predispose to adiposity. The prevalence of individuals with metabolic problems may be increasing as the variation in human biological characteristics is increasing under conditions of relaxed selection. This process has been documented for anatomical variations and anomalies [2-6], while with respect to metabolic variation it remains hypothetical.
Strategies of providing public with general advice on how to control body weight treat all people the same way and due to varying levels of comprehension of messages and poor compliance with diets and exercise regimes, largely fail. It seems that targeting groups-at-risk, and giving them individual attention, may be more effective [7]. Thus, to introduce such individualized strategies, we must be able to understand what individually variable factors increase risk of obesity.
Obesity has multiple etiologies and thus any single factors can be expected to show only low correlations to adiposity in a cross-sectional study. Therefore such studies require very large samples in order to determine with confidence the significance and the magnitude of the influence of particular factors. In the present-day social environment, collection of very large samples of uniformly measured biological variables is difficult. With age, body weight naturally increases while various diseases may occur and their weight-changing effects accumulate throughout the life too. Thus, increasing sample size by including persons of various ages may confound results. This explains relative scarcity of unbiased large sample studies of biological characteristics associated with obesity.
One of possible approaches to the study of individual variation in the obesity risk is to investigate co-variation of adiposity with a number of biological characters while controlling for cultural and socioeconomic differences in a large sample of young people of the same age. Military conscription in Switzerland provides a unique opportunity for such a study. Each Swiss male upon reaching age of 19 years is required to present himself for conscription, some females can, and do, volunteer and undergo the same conscription procedures. During those procedures personal data are collected and medical examinations conducted. In the course of medical examination measurements of body weight and height are made, blood samples taken for routine analyses, and physical fitness is tested. All conscription procedures are fixed and thus provide a standard set of data. Shortcoming of limited data depth (e.g. lack of skinfold measurements) in this situation is compensated by very large sample, because all members of a particular male birth cohort must present themselves for conscription. They no longer constitute a sample from a particular cohort – they actually are an entire cohort, a statistical general population of their birth year. It is only those males who reside abroad at the time of conscription, are seriously physically disabled (e.g. not able to walk) or have some very valid special excuse that do not present themselves for conscription and related physical examination.
In this paper we explore relationships among obesity as measured by body weight and the body mass index (BMI), socioeconomic variables and a number of blood parameters which may be indicative of metabolic processes (Table 1).
2. Methods and Procedures
A total of 101,392 male conscripts of all Swiss cantons were examined during draft years 2005-2007, thus reflecting 83% of all Swiss male citizens in their age cohort (Federal Statistical Office, FSO, www.statweb. admin.ch, Table BEV016A). Only 19 and 20 years olds with complete information regarding all variables of interest in this study were included in our sample to exclude possible age-related data confounding. This reduced sample size to 46,684 individuals. Swiss Armed Forces require mandatory multi-day recruitment [8], with identical qualitative standards for technical equipment and organization as defined by Swiss Armed Forces Regulations (Nosologia militaria # 59.010; Medizinische Beurteilung der Dientstauglichkeit und Dienstfähigkeit der Stellungspflichtigen und Angehörigen der Armee MBDD # 59.002). Tests are taken under professional medical supervision at seven especially dedicated conscription centers located in all major Swiss geographical regions. Self-reported professions and vocations of conscripts were grouped into categories according to the Berufsnomenklatur 2000 classification of the FSO (Agriculture, Engineering & IT, Construction & Mining, Trade, Services, Management & Adminis-tration, Health & Education, Students, Apprentices, Industrial Production) to study potential “peer-group”-effects. Occupations were grouped according to economic sector and nature of task. The sectoral aggregation (agriculture, industrial production, engineering & IT, construction & mining, trade services, management and administration, health & education) is based on the Swiss Standard Classification of Occupations 2000 (SSCO 2000) published by the Swiss Federal Statistical Office (www.bfs.admin. ch). The classification of occupation by nature of task (legislators, senior officials and managers; professionals; technicians and associate professionals; clerks; service workers and shop and market sales workers; skilled agricultural and fishery workers; craft and related trades workers; plant and machine operators and assemblers; elementary occupations) follows the International Standard Classification of Occupations (ISCO-88) of the International Labour Organization (www.ilo.org).
Since the conscripts in the data set are 19 or 20 years old, we add two categories for students and apprentices. Distributions are shown in Figures 1(a)-(b).
Main language in the individual’s municipality and religion in their districts of residence were used to capture cultural influences. All sectors of economy, social status categories, main languages and religions of Switzerland
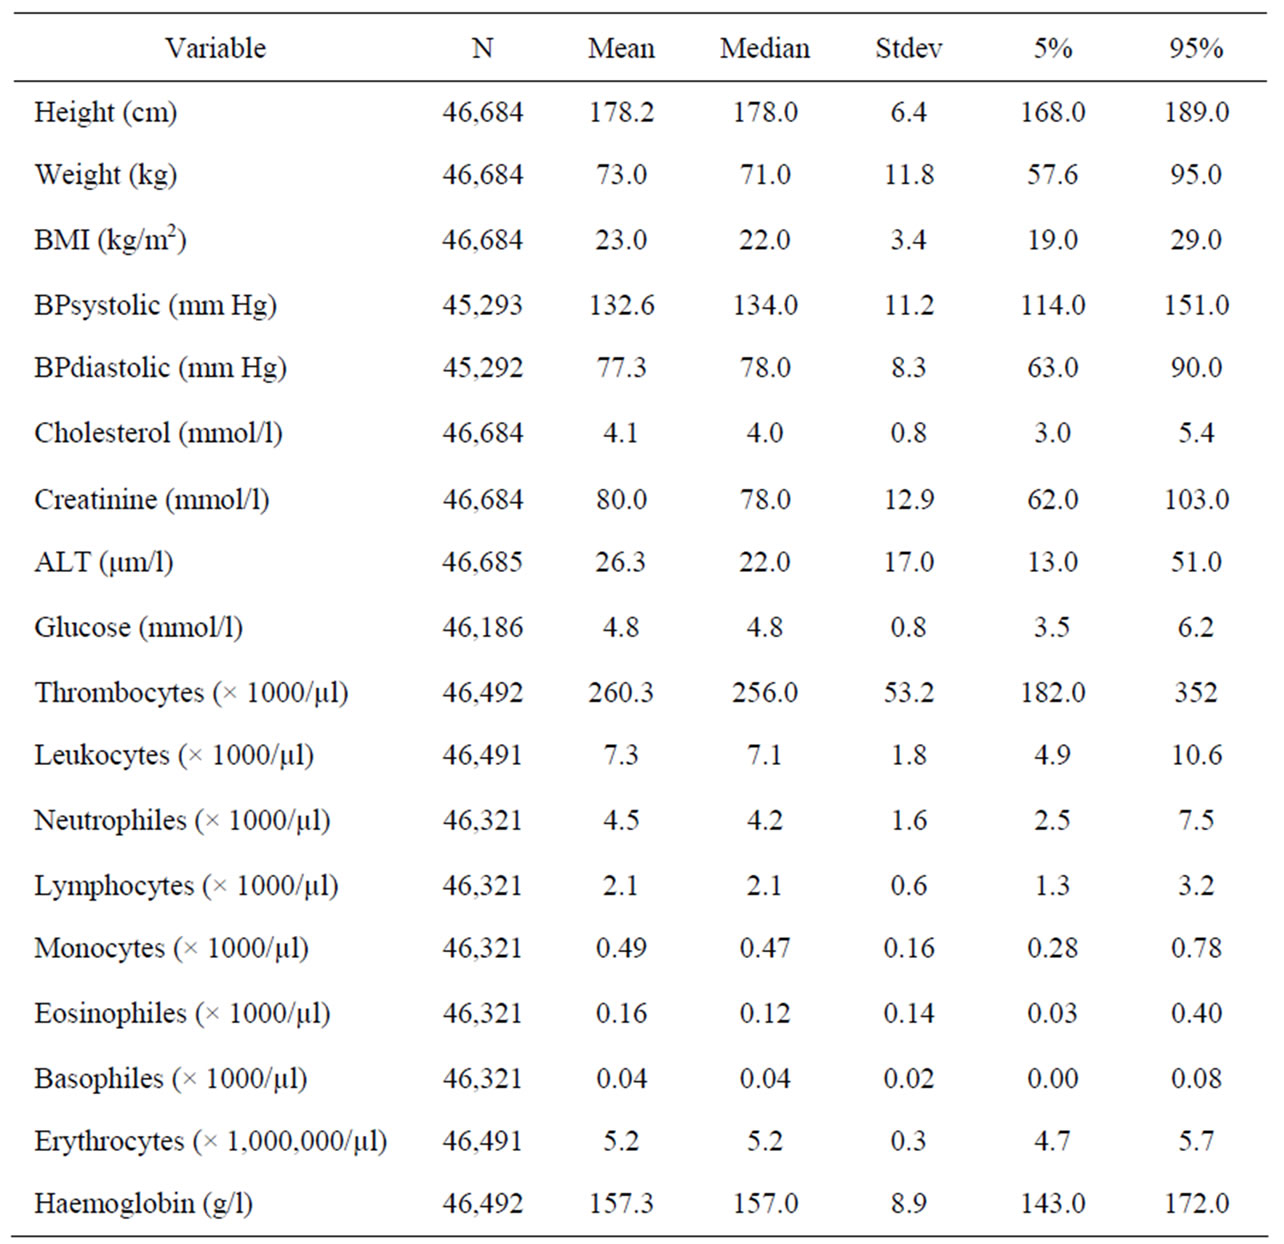
Table 1. Descriptive statistics of biological variables used.
are represented among our conscripts Figures 1(c)-(d)).
Laboratory assessment includes blood sample and urine analysis [9]. Individual total cholesterol, creatinine, alanine transaminase, postprandial serum glucose level, erythrocyte count, leukocyte count and hemoglobine were examined. All individual data were made fully anonymous before analysis; no additional ethical approval is required for fully anonymized Swiss governmental statistical data (Swiss data privacy act, SR 235.1; 19.6.1992).
Statistical analysis (using Excel® SPSS11 and Matlab®, version 7.6.0324 [R2008a]; The MathWorks GmbH, Aachen, Germany) was performed by means of multivariate analysis of variance and stepwise multiple regression analysis after logarithmic transformation of those continuous variables which had skewed distributions.
3. Results
Our sample shows parameters of distributions of studied variables characteristic for young healthy males (Table 1). Among 46,684 conscripts 1796 (3.8%) are underweight (BMI < 18.5 kg/m2), 33,422 (71.6%) are of normal body mass, 9264 (19.8%) are overweight (BMI > 25 but < 30 kg/m2) and 2202 (4.7%) are obese.
Analysis of variance in the entire material indicates that the variable having the greatest contribution to the total variance of body mass is the level of alanine transaminase (ALT also called GPT—glutamic pyruvic transaminase) followed by systolic blood pressure and cholesterol. Other variables, including sociocultural ones, contribute each just around 1% or less to the total variance (Table 2).
Stepwise multiple regression analysis confirmed those results showing that in the entire cohort nearly 20% of variance is jointly explained by the levels of ALT and cholesterol while systolic blood pressure adds some 3.5%. Systolic blood pressure correlates with BMI independent of the levels of ALT and cholesterol.
When socioeconomic variables and blood pressure are kept constant in partial correlation coefficients calculations (Table 3) ALT shows the highest correlation with BMI followed by cholesterol level and erythrocyte count. Surprisingly, cultural and socioeconomic factors contribute little to the variance in the BMI—just about 1% - 2%
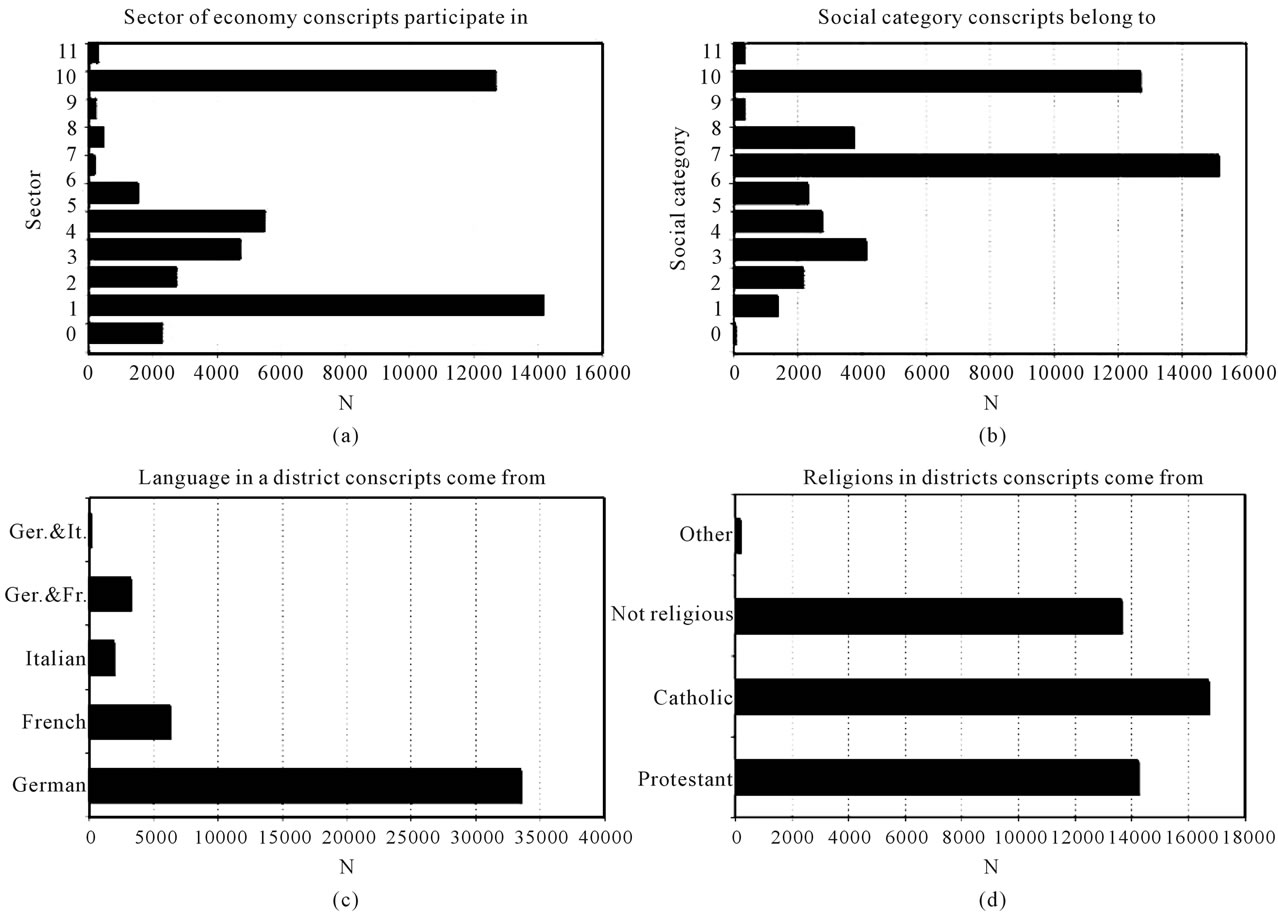
Figure 1. Distribution of categorical socio-cultural variables in the entire sample of conscripts. (a) Sector of economy conscripts participate in (classified after SSCO 2000): 1—agriculture, 2—industrial production, 3—engineering and IT, 4—construction and mining, 5—trade, 6—services, 7—management and administration, 8—health and education, 9—missing, 10—university/high school students, 11—apprentices; (b) socioeconomic categories conscripts belong to (classified after ISCO 88) 1—legislators, senior officials and managers, 2—professionals, 3—technicians and associate professionals, 4—clerks, 5—service workers and shop and market sales workers, 6—skilled agricultural and fishery workers, 7—craft and related trades workers, 8—plant and machine operators and assemblers, 9—elementary occupations, 10 and 11 like in (a); (c) languages in the conscripts’ district. Note: there are no districts with mixture of French and Italian; (d) religious affiliations in conscript’s districts. “Other” includes mostly Protestant-Catholic mixed religions.
though their contributions are formally significant (Tables 2 and 4). When their influence is practically completely removed by “experimental” selection of groups homogenous with respect to language and occupation – German speaking university students and German speaking low-skilled workers—the pattern of contribution of biological variables within such groups remains the same with the greatest contribution of ALT and much lesser contribution of cholesterol (Table 5).
The pattern of the contribution of the variables – greatest of those reflecting liver function, small of sociocultural factors, remains the same in groups of individuals with normal (18.5 - 24.9), overweight (25.0 - 29.9) and obese (>30) BMI values (all in kg/m2) (Figure 2). In underweight individuals (BMI < 18.5 kg/m2) no relationships were found at all. Also, very obese individuals (BMI > 35 kg/m2) seem to have no relationship between BMI and ALT (Figure 2, end of the regression line).
To confirm these findings further we have selected only those individuals who were healthy according to the following criteria: BMI 18.5 - 24.9 kg/m2, cholesterol below 5 mmol/l, glucose below 7.8 mmol/l, ALT below 23 μm/l and systolic blood pressure below 130 mmHg. In this artificially created “healthy” group ALT still had the greatest, significant relationship with BMI (Table 6). Finally, it is interesting to note that postprandial levels of glucose (Table 2) do not co-vary with BMI at all in any group.
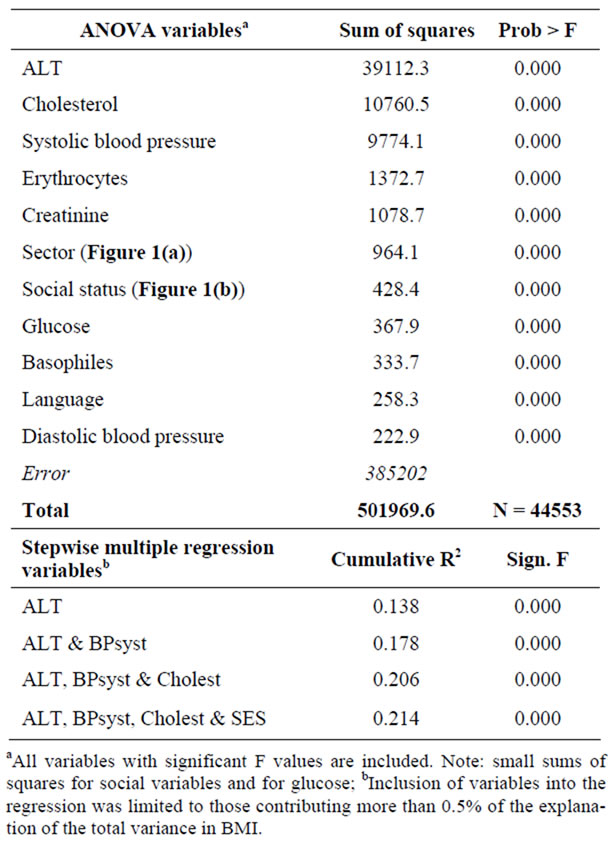
Table 2. Results of ANOVA and Stepwise Multiple Regression linking BMI to all variables studied. N = 44,553.
The greatest portion of the total variance in our analyses is the unexplained variance. Measurement error of BMI is rather small (about 5% [10]) but physiological parameters may have larger measurement error variances as indicated by about 30% - 40% errors assessed for blood pressure, cholesterol and glucose concentration by Whitlock et al. [10]. This seems unavoidable in a cross sectional-study where short-term individual variations cannot be controlled for. Were these errors controlled for, our findings would be stronger.
4. Discussion
Surprisingly, we have found very little influence of socioeconomic and cultural factors on the variance of BMI in the cohort of young Swiss males. Furthermore, biological variables related to characteristics of blood cells, kidney function, and postprandial glucose levels did not display any substantial contribution to the BMI variance. In the case of glucose levels, our results may not necessarily reflect natural metabolism of some individuals, especially those with diagnosed diabetes who are already on medication.
It was only liver function indicators that influenced strongly variation in BMI. Both ALT and cholesterol, the two variables showing the greatest contributions to the total BMI variance, are related to the liver function including links to metabolic pathways of gluconeogenesis and glycolysis and thus to the energy processing in the body. Blood pressure correlation with BMI seems to be a
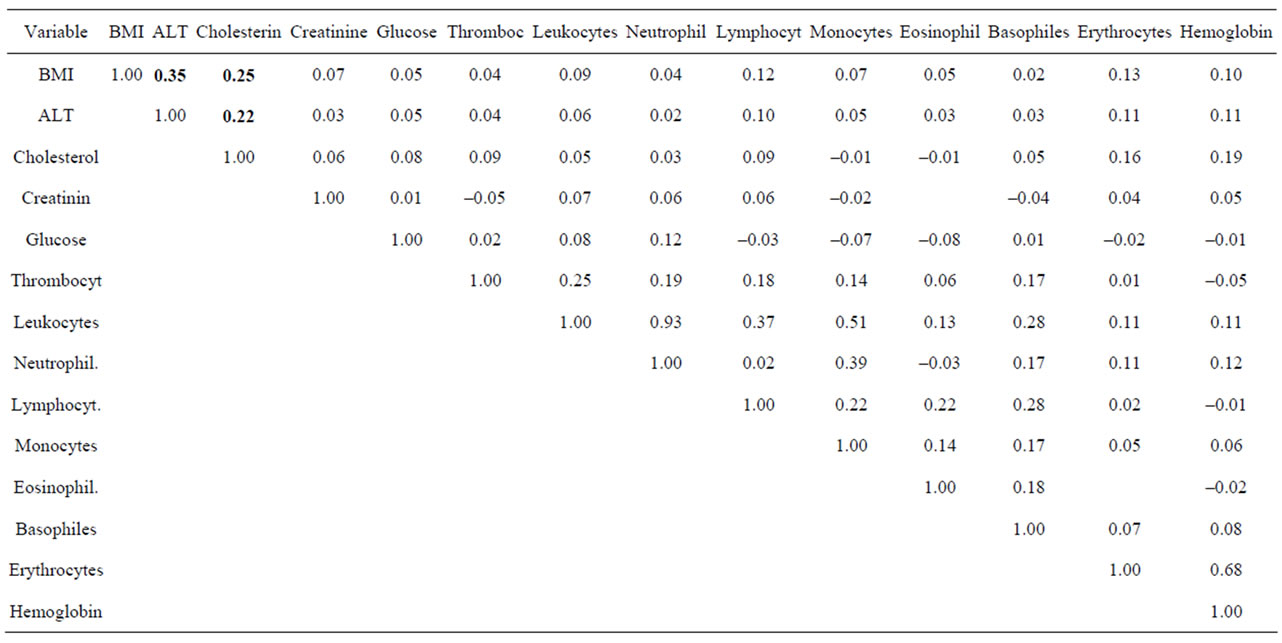
Table 3. Partial correlation coefficientsa among biological variables when socioeconomic variables and blood pressure are kept constant. N = 44,547.

Figure 2. Second order polynomial regressions of ALT GPT on BMI. From among all models fitted by SPSS the second order regression produced the best fit. (a) Underweight conscripts. Note that the slope of the squared component is negative while R squared is very low; (b) conscripts with normal body mass. Slope of squared component is positive and R squared very significant (p < 0.001); (c) overweight conscripts. Slope is positive, R squared highly significant (p < 0.001); (d) obese conscripts. Note negative slope of the squared component producing downward direction of the line among very obese conscripts (BMI > 35 kg/m2).
simple result of increased body mass.
Switzerland is a highly developed country with egalitarian political system. Thus, all Swiss citizens, irrespective of their mother tongue and socio-economic situation, grow and live in conditions very close to the optimum for biological development. With the lack of variation in living conditions, biological characteristics come to the fore as determinants of obesity.
Parameters of liver function such as ALT and cholersterol levels have long been known to correlate with the metabolic syndrome and thus with BMI [11-13]. It has not been clarified, however, whether this correlation is a result of adiposity causing increase in ALT levels, or vice versa. Although there is no doubt that in excessively obese patients serious liver malfunction occurs [14], producing elevated levels of ALT and cholesterol, there are many individuals of normal body mass [15], or only mildly overweight [16] who have elevated levels of ALT. Our study cohort, comprising only young males, who at the time of conscription were apparently healthy, shows persistent correlation of ALT levels with BMI irrespective of actual body mass even in the “normal” BMI range. This is even true amongst a sample selected on all available parameters as absolutely “healthy”. Our study design is cross-sectional and thus we cannot directly show a causal relationship between ALT and increased body
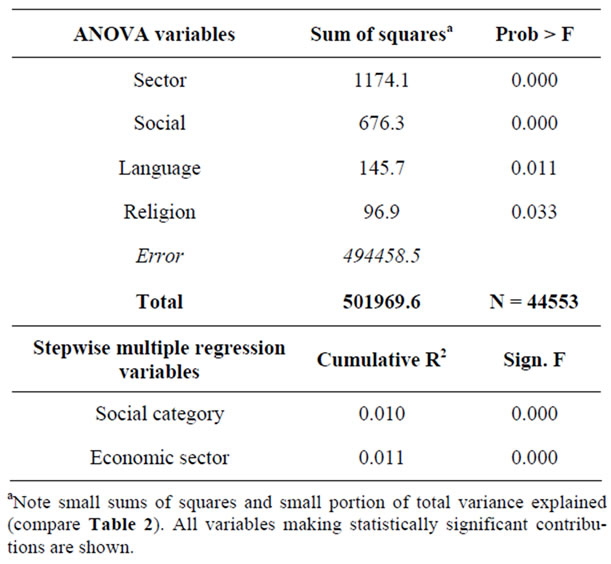
Table 4. Results of ANOVA and Stepwise Multiple Regression linking BMI to socioeconomic and cultural variables studied. N = 46,673.
mass, but the sample size and the fact that the relationship is ubiquitous irrespective of actual body mass range, argue for the causal relationship that deserves to be studied further.
We also selected individuals on the following criteria: systolic blood pressure below 120 mmHg, cholesterol level below 5.0 mmol/l, glucose concentration below 7.8 mmol/l, thrombocytes below 260,000/µl and leucocytes below 7100/µl. Such selection removes all risk factors of metabolic syndrome, as defined by the American Heart Association [17] and the Mayo Clinic [18], except BMI. In a group so selected, ALT levels still contribute significantly to body mass (Table 7).
A relationship between ALT and BMI was observed amongst professional athletes before [19]. In a Japanese sample, non-alcoholic, non-overweight participants of both sexes had a significant relationship of fatty liver resulting in high ALT levels and body fat [15]. These findings indicate that variation in liver function in normal individuals influences variation of body mass. In populations average liver function worsens with age [14] and
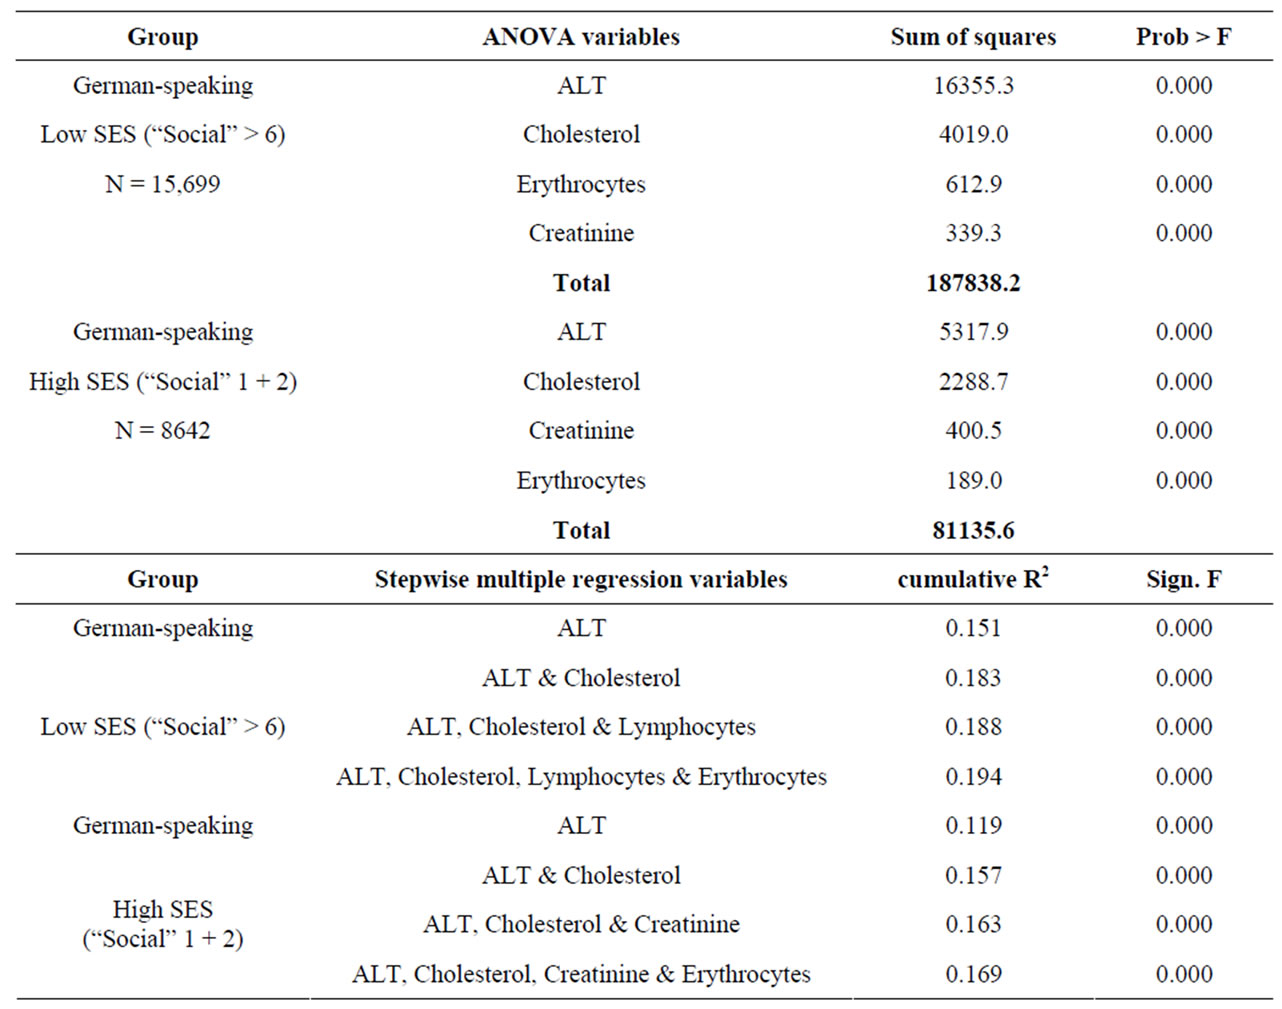
Table 5. Results of ANOVA and Stepwise Multiple Regression linking BMI to biological variables in German speaking conscripts divided into “Social” (socioeconomic status) groups. In ANOVA only the four variables with greatest sums of squares are included. Inclusion of variables into the regression was limited to those contributing more than 0.5% of the explanation of the total variance in BMI.
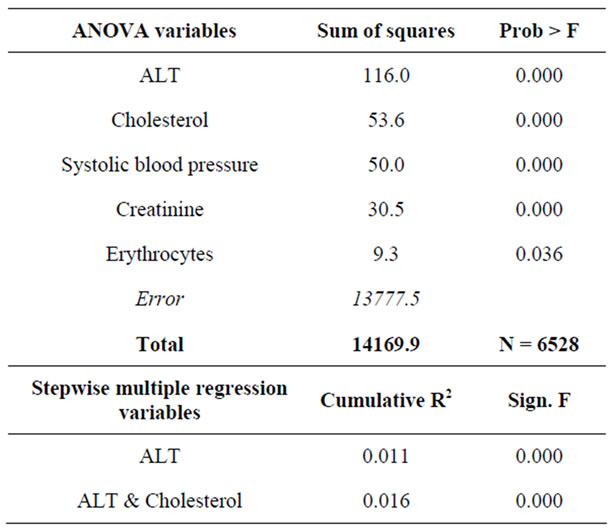
Table 6. Results of ANOVA and Stepwise Multiple Regression linking BMI to biological variables in a “Healthy” group (normal BMI, normal cholesterol, normal ALT, normal blood pressure). All variables with significant F included into ANOVA results. Inclusion of variables into the regression was limited to those contributing more than 0.5% of the explanation of the total variance in BMI. N = 6549.

Table 7. Results of ANOVA and Stepwise Multiple Regression linking BMI to biological variables in a group without any signs of “metabolic syndrome” except full BMI range. All significant contributions to total variance are included. Inclusion of variables into the regression was limited to those contributing more than 0.5% of the explanation of the total variance in BMI. N = 1337.
average BMI increases.
Identification of individual levels of relevant liver functions may be used to pinpoint those young patients that are at risk of developing obesity and, thus, design for them personal coping strategies to prevent development of metabolic syndrome. Present-day treatment of potential or actual metabolic-syndrome-related obesity, by strict dietary and exercise regimes, however to a certain degree effective, requires high levels of patient compliance which are difficult to observe persistently and thus often ineffective. Our results suggest that weight gain by some individuals may be a result of their biochemical anomalies, not of gluttonous life style. Were it so, it would be possible to develop pharmacological ways of correcting liver metabolism to avoid development of obesity by a substantial portion of a population.
The fact that the greatest portion of individual BMI variance remains unexplained in our study probably has two sources: 1) measurement error and 2) individual variation in factors that were not captured by variables used in this study. These errors result primarily from diurnal and other periodic fluctuations in body functioning rather than from laboratory techniques. Undoubtedly there is individual variation in biological and socio-psychological factors underlying variation in BMI that was not captured by analysis of parameters available for this study and which shall be explored further in the future. Also, a further study including larger number of variables characterizing metabolism in more detail in participants of both sexes would be useful.
5. Acknowledgements
The authors thank Mäxi-Foundation for financial support, Gioia Edelmann, Institute for Empirical Research in Economics, University of Zurich, for reliable research assistance and Major General G. P. Lupi and Captain F. Frey, Swiss Armed Forces, for data access und unrestricted logistical support. F. Rühli, U. Woitek and M. Henneberg had full access to all the data in the study and take responsibility for the integrity of the data and the accuracy of the data analysis. The Authors have no conflicts of interest, financial or otherwise, related to this study.
REFERENCES
- D. Veitch, L. Veitch and M. Henneberg, “Sizing for the Clothing Industry Using Principal Component Analysis—An Australian Example,” American Society for Testing and Materials International, Vol. 4, No. 3, 2007, ID: JAI100824.
- K. Bhatia, M. Ghabriel and M. Henneberg, “Anatomical Variations in the Branches of the Human Arch of the Aorta: A Possible Increase in Recent Times?” Folia Morphologica, Vol. 64, No. 3, 2005, pp. 217-223.
- M. Henneberg and B. J. George, “Possible Secular Trend in the Incidence of an Anatomical Variant: Median Artery of the Forearm,” American Journal of Physical Anthropology, Vol. 96, No. 4, 1995, pp. 329-334. doi:10.1002/ajpa.1330960402
- R. J. Henneberg and M. Henneberg, “Variation in the Closure of the Sacral Canal in the Skeletal Sample from Pompeii, Italy 79 AD,” Perspectives of Human Biology, Vol. 4, No. 1, 1999, pp. 177-188.
- F. J. Rühli and M. Henneberg, “Clinical Perspectives on Secular Trends of Intervertebral Foramen Diameters in an Industrialized European Society,” European Spine Journal, Vol. 13, 2004, pp. 733-739.
- F. J. Rühli, L. B. Solomon and M. Henneberg, “High Prevalence of Tarsal Coalitions and Tarsal Joint Variants in a Recent Cadaver Sample and Its Possible Significance,” Clinical Anatomy, Vol. 16, No. 5, 2003, pp. 411- 415. doi:10.1002/ca.10146
- M. Henneberg and S. J. Ulijaszek, “Body Frame Dimensions Can Predict Obesity: Body Mass Index, Body Frame and Fatness,” American Journal of Human Biology, Vol. 22, No. 1, 2010, pp. 83-91. doi:10.1002/ajhb.20957
- F. Frey, G. Huber and G. A. Lupi, “Rekrutierung XXI,” Schweizerische Arztezeitung, Vol. 84, 2003, pp. 341-345.
- B. E. Schleiffenbaum, D. J. Schaer, D. Burki, A.-F. Viollier, E. Viollier, E. R. Stettler and R. Wegmueller, “Unexpected High Prevalence of Metabolic Disorders and Chronic Disease among Young Male Draftees—The Swiss Army XXI Experience,” Swiss Medical Weekly, Vol. 136, 2006, pp. 175-184.
- G. Whitlock, T. Clark, S. van deer Hoorn, A. Rodgers, R. Jackson, R. Norton and S. MacMahon, “Random Errors in the Measurement of 10 Cardiovascular Risk Factors,” European Journal of Epidemiology, Vol. 17, No. 10, 2001, pp. 907-909. doi:10.1023/A:1016228410194
- A. Pitton, T. Poynard, F. Imbert-Bismut, L. Khalil, J. Delattre, E. Pelissier, N. Snsonetti and P. Opolon, “Factors Associated with Serum Alanine Transaminase Activity in Healthy Subjects: Consequences for the Definition of Normal Values, for Selection of Blood Donors and for Patients with Chronic Hepatitis C,” Hepatology, Vol. 27, No. 5, 1998, pp. 1213-1219. doi:10.1002/hep.510270505
- G. Bedogni, L. Miglioli, N. Battistini, F. Masutti, C. Tribelli and S. Bellentani, “Body Mass Index Is a Good Predictor of an Elevated Alanine Transaminase Level in the General Population: Hints from the Dionysos Study,” Digestive and Liver Disease, Vol. 35, No. 9, 2003, pp. 648-652. doi:10.1016/S1590-8658(03)00378-5
- T. S. Church, J. L. Kuk, R. Ross, E. L. Priest, E. Biltoff and S. N. Blair, “Association of Cardiorespiratory Fitness, Body Mass Index, and Waist Circumference to Non-Alcoholic Fatty Liver Disease,” Gastroenterology, Vol. 130, No. 7, 2006, pp. 2023-2030. doi:10.1053/j.gastro.2006.03.019
- T. C. Schreuder, B. J. Verwer, C. M. van Nieuwkerk and C. J. Mulder, “Nonalcoholic Fatty Liver Disease: An Overview of Current Insights in Pathogenesis, Diagnosis and Treatment,” World Journal of Gastroenterology, Vol. 14, No. 16, 2008, pp. 2474-2486. doi:10.3748/wjg.14.2474
- K. Omagari, et al., “Fatty Liver in Non-Alcoholic NonOverweight Japanese Adults: Incidence and Clinical Characteristics,” Journal of Gastoenterology and Hepatology, Vol. 17, No. 10, 2002, pp. 1098-1105. doi:10.1046/j.1440-1746.2002.02846.x
- I. Friis-Liby, F. Aldenborg, P. Jerlstad, K. Rundström and E. Björnsson, “High Prevalence of Metabolic Complications in Patients with Non-Alcoholic Fatty Liver Disease,” Scandinavian Journal of Gastroenterology, Vol. 39, No. 9, 2004, pp. 864-869. doi:10.1080/00365520410006431
- 2008. http://www.americanheart.org/presenter.jhtml?identifier=4756
- 2008. http://www.mayoclinic.com/health/metabolic%20syndrome/DS00522/DSECTION=symptoms
- G. Banfi and P. Morelli, “Relation between Body Mass Index and Serum Aminotransferases Concentrations in Professional Athletes,” Journal of Sports Medicine and Physical Fitness, Vol. 48, No. 2, 2008, pp. 197-200.