Food and Nutrition Sciences
Vol. 2 No. 9 (2011) , Article ID: 8372 , 7 pages DOI:10.4236/fns.2011.29126
Modeling Dietary Fiber Intakes in US Adults: Implications for Public Policy
![]()
1Department of Pediatrics, USDA/ARS Children’s Nutrition Research Center at Baylor College of Medicine, Houston, USA; 2Louisiana State University Ag Center, Baton Rouge, USA; 3Kellogg Company, Battle Creek, USA; 4Nutrition Impact, Battle Creek, USA.
Email: tnicklas@bcm.edu
Received May 6th, 2011; revised August 31st, 2011; accepted September 7th, 2011.
Keywords: Dietary Fiber, Adults, Statistical Modeling of Fiber, NHANES
ABSTRACT
Objective: The goal of this study was to simulate the application of the dietary recommendations to increase dietary fiber (DF)-containing foods. Methods: This study used 24-hour dietary recalls from NHANES 2003-2006 to model the impact of different approaches of increasing DF with current dietary patterns of US adults 19 + years: 1) increased all DF-containing foods by 10%, 25%, 50%, or 100%; 2) increased DF content of low DF grain products to a good (2.5 g/serving) or an excellent source level (5.0 g/serving); and 3) increased intake of whole grain foods to meet the recommendation of one-half of total grain. Results: Increasing DF-containing foods by 10%, 25%, 50%, or 100% increased DF intake to 16.9, 18.9, 22.1, and 29.5 g/d, respectively with a concomitant increase in energy of 104, 260, 521, 1042 kcal/d, respectively. Adding 2.5 or 5.0 g/serving DF to low DF grain foods to result in DF intakes of 24.7 and 39.1 g/day, respectively without increased energy. Increasing consumption of whole grain foods increased DF intake to 25.3 g/day but with an additional 1266 kcal/d. Conclusions: Adding additional DF to existing grain-based foods may be a reasonable approach to getting more DF, without increased energy, in the American diet.
1. Introduction
Dietary fiber (DF) provides important health benefits for adults [1-3], including reducing the risk of coronary heart disease (CHD) [4-10], type 2 diabetes [11,12], and metabolic syndrome [13], and maintaining a healthy body weight [14-16]. Professional and governmental organizations have issued guidelines or recommendations for intakes of DF based on the totality of the evidence, specifically fiber’s protective role against CHD. The 2010 Dietary Guidelines Advisory Committee (DGAC) [17] advised 14 grams (g) of DF per 1000 kilocalories (kcals), which is consistent with the Institute of Medicine’s (IOM) Adequate Intake (AI) value for DF [18]. MyPyramid was developed as a nutrition educational tool to implement the Dietary Guidelines for Americans (DGA) [19]. In the food patterns, recommended DF intakes range from 25 - 38 g/day for adults 19 years and older (depending on gender) [19]. Despite the many educational tools available to the consumer, Americans continue to have DF intakes well below the current recommendations. The usual daily intake of DF was only 14 g to 18 g for adults depending on gender [20] which is low enough to be of concern [17]. Over 90% of adults do not meet the AI for DF [20]. In an attempt to get more Americans to meet DF recommendations, increased intake of fruit, vegetables, including legumes, and whole grains have been encouraged [21,22].
According to the American Dietetic Association’s nationwide consumer opinion survey, Nutrition and You: Trends 2008 [23], 41% of Americans did not know or understand guidelines for diet and health and 52% reported that they needed more practical tips to help them eat right. Data from the 2008 International Food Information Council Foundation Food and Health Survey [24], showed that 86% of consumers had heard of MyPyramid but only 20% acted on the information provided. However, 72% reported that they were trying to eat more DF, but it was unclear what strategies they were using to get more DF into their diets.
The purpose of this study was to simulate the application of the dietary recommendations to increase fibercontaining foods on usual DF and energy intake of adults. Statistical modeling of current dietary intake data from the National Health and Nutrition Examination Survey (NHANES) 2003-2006 was used to assess the impact. In addition, modeling the impact of adding DF to existing foods was also investigated.
2. Subjects and Methods
The NHANES is a continuous surveillance program designed to collect nationally representative information on the health and nutrition status of the civilian, non-institutionalized US population. The NHANES data are collected using a complex, stratified, multi-stage probability cluster sampling design. Data are collected via an interview for demographic and basic health information, and a comprehensive health examination conducted in a mobile examination center (MEC). Detailed descriptions of the sample design, interview procedures and physical examinations conducted are available on line [25]. The data sets from 2003-2004 and 2005-2006 were concatenated to increase sample size [26] to ensure reliable estimates for population subgroups.
To obtain dietary data for the NHANES, trained interviewers conducted in person 24-hour dietary recalls using the USDA Automated Multi-pass method during the MEC examination [27,28]. Another dietary recall was administered via the telephone 3 - 10 days after the MEC examination. For these analyses, participants 19 years of age (y) and older with dietary records deemed reliable by USDA’s Food Surveys Research Group were included; pregnant and lactating females (n = 629) were excluded which left an evaluable sample of 8861 (4559 males and 4302 females).
Intake data were used to conduct dietary simulations modeling different approaches to increase DF intake in US adults. Three separate simulations were conducted: The first was to increase amount of DF containing foods (i.e. fruit, vegetables, legumes, and grain products) consumed by 10%, 25%, 50% and 100%—all foods that contained any amount of DF were increased. The second was to increase DF composition of existing low DF grain products at two levels: a) a “good source”, i.e. 2.5 g per reference amount customarily consumed (RACC) and b) an “excellent source” level, both defined by the US Food and Drug Administration (FDA) [29] i.e. 5 g/RACC [29] —all grain products with less than 2.5 g DF/RACC were modified to contain 2.5 or 5.0 g DF/RACC. The third was to increase consumption of whole grains to the point where one-half of grains consumed were whole grains. However, since preliminary analyses indicated whole grain intake was very low, the increase in whole grains was limited to a fivefold (500%) increase—whole grain foods were increased until half of total grains were whole grains or the increase in whole grain intake increased fivefold. For each simulation scenario, 24 hr recall intakes of energy and DF were recalculated based on respective changes in food intake/composition.
Usual energy and DF intake were determined at baseline and for each simulation using the National Cancer Institute (NCI) method [30]. The NCI supplied SAS programs Mixtran v1.1 and Distrib v1.1 were used to generate parameter effects after covariate adjustment and to estimate distribution of usual intake via Monte Carlo method, respectively [31]. Covariates were day of week of 24 hr recall [coded as weekend (Friday-Sunday) or weekday (Monday-Thursday)] and sequence of dietary recall (first or second). The balanced repeated replication method with a non-response adjustment was used for variance estimates, standard errors, and confidence intervals for usual intake means, percentiles, and probabilities of meeting a cutoff amount. Two cutoff values were examined: 1) percentage of the population with intakes greater than the AI for DF established by the IOM [18] and 2) percentage of the population with intakes greater than the Daily Value (DV) for DF established by the FDA of 25 g/d. All analyses were conducted using SAS (version 10, SAS Institute; Cary, NC) software and dietary sample weights were used to account for differential non-response, to adjust for over sampling of some groups, and to account for the complex sample design of NHANES [26].
3. Results
Usual baseline DF intake was 15.7 g/d (13.7 and 17.7 g/d in females and males, respectively). Only 3.9% of adults 19 + y had DF intakes greater than the AI; 7.5 % had DF intake greater than the DV (25/g/d). In males, 2.4% had DF intakes greater than the AI and 13.6% had DF intakes greater than the DV. In females, 5.6% of adults had DF intakes greater than the AI and 2.6% had DF intakes greater than the DV (Figure 1).
Increasing DF containing foods 10%, 25%, 50%, or 100% increased the average DF intake in adults to 16.9,
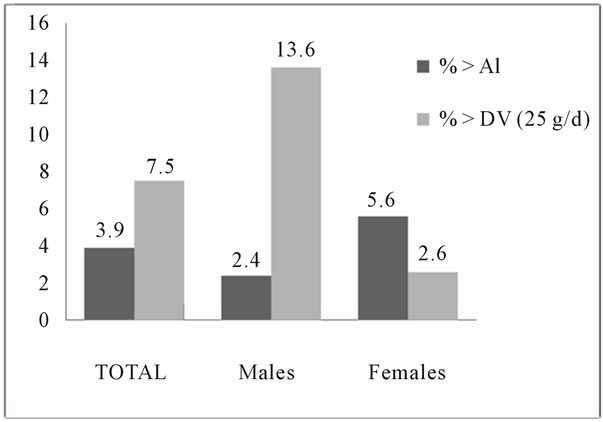
Figure 1. Probabilities above cutoff values of recommended dietary fiber intake in adults.
18.9, 22.1, and 28.5 g/d, respectively; however, energy increased 104, 260, 521, 1042 kcal/d, respectively (Table 1). In males, 100% increase in DF containing foods resulted in DF intake of 32.2 g/d; however, energy increased 1205 kcal/d. In females, 100% increase in DF containing foods resulted in DF intake of 25.0 g/d however energy increased 882 kcal/d.
Adding fiber to grain foods low in DF to result in either 2.5 or 5.0 g DF/serving resulted in DF intakes of 24.7 and 39.1 g/day, respectively without an increase in energy; comparable data in males were 28.6 and 45.6 g/d and in females were 21.0 and 32.9 g/d, respectively (Table 2).
Increasing consumption of currently available whole grain foods to meet the recommendation that one-half of total grain intake was while grains increased average DF intake in adults to 25.3 g/day but with an additional 1266 kcal/d. In males, increases in DF were to 28.5 g/d with an energy increase of 1395 kcal/d. In females, increases in DF were to 22.4 g/d with an energy increase of 1151
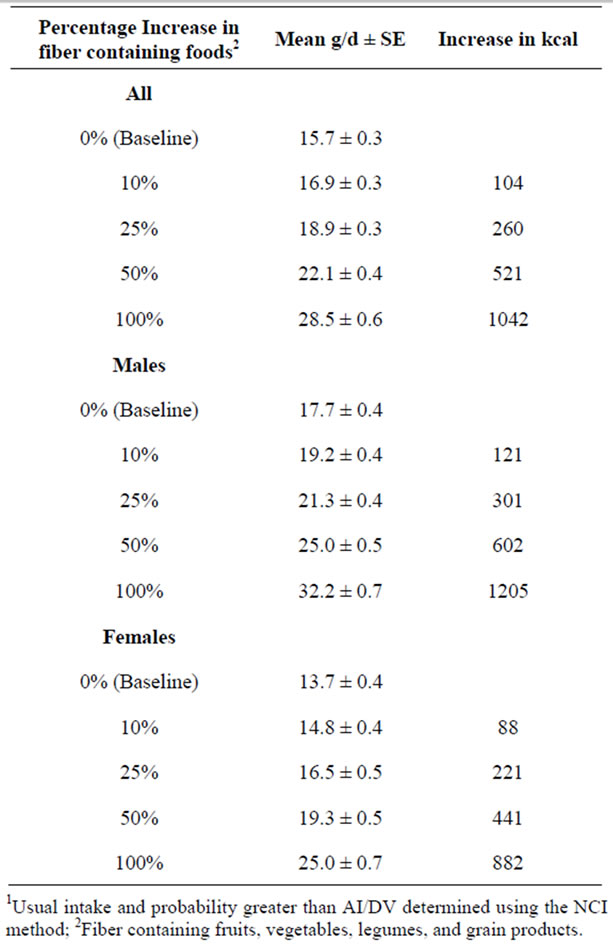
Table 1. Mean usual intake with simulation of increase in fiber containing foods—NHANES 2003-20061.
kcal/d (Table 3).
4. Discussion
The current recommendation for DF was based on an evidence-based approach which showed that DF decreased the risk of chronic diseases, especially CHD, and other health-related conditions [1,2]. Dietary fiber is present in many foods in the diet, including grain products, fruits, and vegetables, including legumes; however, even with the myriad of widely available foods that contain DF, over 90% of adults do not meet the AI for DF [20]. This suggests that consuming the recommended level of DF is challenging for most adults. The current study looked at three modeling scenarios for increasing DF in the diet. These included increasing the amount of DF containing foods currently being consumed; increasing the fiber content of low DF grain products; and increasing the amount of whole grain foods to the point at which one-half of the grain servings consumed were whole grains. In two of these scenarios, the amount of food was increased in the modeling—so it was an addition rather than a substitution approach. As would be expected, adding foods to current usual intakes resulted in higher energy intake. For example, increasing the amount of DF containing foods increased DF intake to 17 to 30 g/day, but with a cost of increasing energy by 104 to 1042 kcals/per day. Increasing the consumption of currently available whole grain foods increased DF intake to 25 g/per day, but with an additional 1266 kcal/per day.
The 2005 DGA made the following recommendations for DF-containing food groups to encourage [21]: consume a sufficient amount of fruits and vegetables while staying within energy needs, choose a variety of fruits and vegetables each day, and consume 3 or more ounceequivalents of whole-grain products per day-with the rest of the recommended grains coming from enriched or whole-grain products. Consumption of whole grains, in particular, has been noted as a means for increasing DF intake. This study addressed the ability of individuals to meet the DF recommendations by increasing DF-containing foods, particularly whole grains. As pointed out by Crawford “[T]he average person with a 2000 calorie intake needs 28 grams of fiber per day. It’s extremely difficult to get that much fiber in your diet without the consumption of whole grains, and the Dietary Guidelines recognize and promote the intake of whole grains as an important source of dietary fiber” [32].
The DF content of whole grains and whole grain foods varies considerably [33]. For example, 16 g of brown rice delivers an average of 0.5 g DF, whereas the same amount of whole wheat delivers an average of 2 g DF [34]. Surprisingly, in the US, foods reported as whole
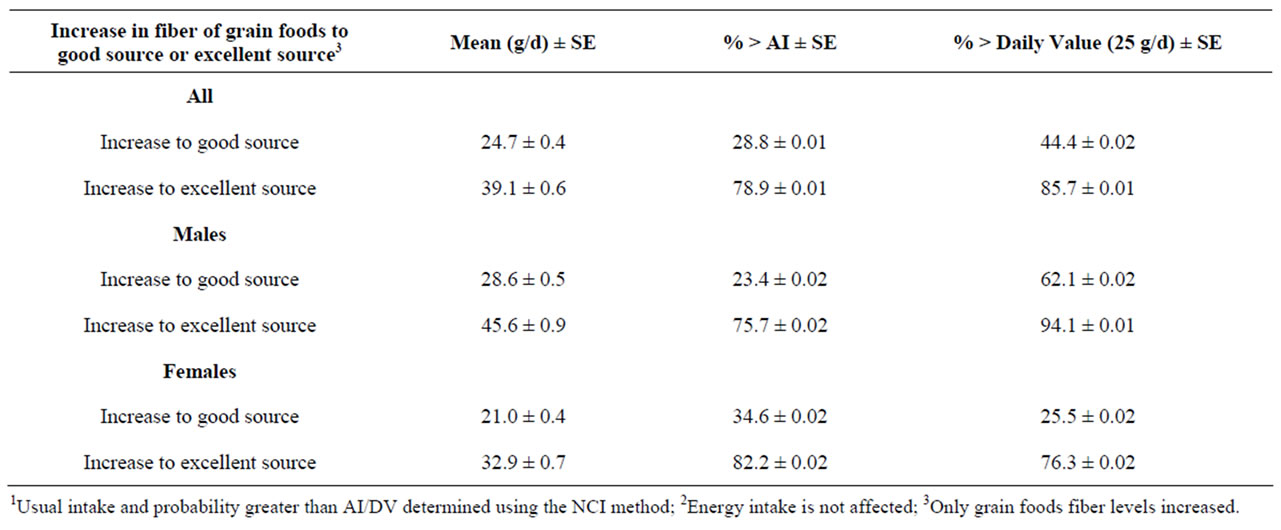
Table 2. Usual intake and probabilities above cutoff values of recommen-ded dietary fiber intake in adults (19 + yr) with simulation of increasing fiber in low fiber grain foods—NHANES 2003-20061,2.

Table 3. Mean usual intake and probabilities above cutoff values of recom-mended dietary fiber intake in adults (19 + yr) with simulation of increasing whole grain foods to recommended levels—NHANES 2003-20061.
grain can also vary in whole grain content. In many cases they contain 50% or less of whole grain (8 g whole grain or less) and deliver less than a good source of fiber. The FDA definition of whole grains does not consider DF content; this can be misleading to consumers who may believe that all whole grain foods are good to excellent sources of DF. Most grains consumed by Americans are refined grains [17,21]. Refined grains have much of the DF content removed during milling; however, DF can be added back to these products. Consumers should be advised to specifically look for fiber content in a product.
Most intervention studies designed to increase intakes of fruit and vegetables have done so in modest amounts but with little to no change in body weight [35]. A systematic review of the relationship of fruit and vegetable intake with adiposity reported that 50% of intervention studies did not control for energy intake in the analyses [35]. Since the focus of these intervention studies was to get individuals to eat more fruit and vegetables, this may have inadvertently led to increased energy intake which accounted for the finding that changes in weight were not seen in many of these studies. Intervention studies may need to use a substitution approach for changing eating behaviors when physiologic outcomes, such as adiposity, were examined. For the consumer, the recommendations for consumption of food groups or individual nutrients, like DF, may not be clear (23). Consumption of fruit and vegetables by Americans is low [36]. Americans would need to increase their fruit and vegetable intake by 300% - 500% (depending on age and gender) over their current consumption [21] to meet recommendations. The recommendation to choose a variety of fruit and vegetables may also lead to increased energy intake [37] but this was not assessed in the modeling scenarios.
The increase in energy from increasing fruit, vegetable, and grain intake seen in this study may be the result of the foods commonly selected by Americans. Many fruit, vegetables, and grains consumed are high in added fat and added sugars [38] due to preparation and processing, which could explain the increase in energy when these commonly consumed foods were increased incrementally in the diet. Thus, the current recommendation to increase consumption of fruit, vegetables, and grain products needs to emphasize staying within energy needs and that increasing the consumption of these foods, needs to be balanced with a decrease in added fats and added sugars, major contributors to energy intake [38].
It might be argued that the “addition approach” in the modeling scenarios is artificial and was not the intent of the 2005 DGA. Further complicating this scenario was that the recommendation for fruit and vegetables addressed energy intake, whereas the whole grain recommendation did not. The WHOLEheart study [39], a 16- week whole grain intervention study, suggested that participants appeared to add whole grain foods rather than substitute them, and which resulted in increased energy intake. Substitution of whole grains for refined grains can be cumbersome for many consumers and a common response may be to simply add whole grains to the existing diet. This supports that the modeling scenario reported herein is relevant to consumer behavior.
The third modeling scenario of increasing the DF content in low DF grain foods resulted in DF intakes of 25 and 39 g/day without an increase in energy. This is a reasonable approach to getting more DF into the American diet. The food industry has recently taken this approach [40]. For example, a major cereal company recently announced that by the end of 2010, 80% of their cereals will contain at least 3 g of DF/serving. Similar efforts need to be made with adding DF back to refined grains after processing.
These simulations clearly showed the extent of behavior change needed to meet DF recommenda-tions. An argument can be made that the consumer messaging and the education materials of MyPyramid should focus on the energy content of foods while choosing more DFcontaining foods. The 2005 DGAC report [21] stated that it is important to decrease the intake of less-nutrientdense foods to control energy intake. However, the substitution message gets lost in the translation to consumers. In MyPyramid, fruit, vegetables, and whole grains are encouraged and saturated fatty acids, trans-fatty acids, cholesterol, sodium and added sugars are discouraged [19]. It is unlikely that consumers make the connection that if they increase DF-containing foods in the diet they also need to decrease foods high in energy.
Increasing DF intake without a concomitant increase in energy can be accomplished through consumer messaging and supplementation of food products. Consumer messaging for dietary recommendations may need to provide additional guidance on what foods can be decreased in the diet when other foods are encouraged in an effort to manage energy balance. Those providing dietary guidance to consumers should continue to stress the importance of meeting the DF recommendation and guide consumers to foods with the highest DF levels. Industry needs to evaluate their portfolios to find ways of increasing the DF content of foods.
This study shows the value of adding sources of DF to existing grain-based foods. In addition, a focus on consuming more of the fiber-rich part of grains, e.g. the bran, which contains the majority of grain fiber without the starchy, high-energy endosperm, should also be considered. Current recommendations do not promote foods high in bran along with whole grains. Use of fiber additions and bran represents viable and attractive options because they leverage current eating habits, therefore are less disruptive and consequently can be easier to adopt by consumers. Recommendations should take into account these findings and consider both approaches. The challenge is for the food industry to develop technologies to apply suitable DF sources in ways that can be incorporated without negatively impacting the sensory characteristics of commonly available grain-based foods and maintain consumer acceptability.
This study was not without limitations. Analyses of NHANES data are limited by the cross-sectional design and the use of 24-hour dietary recall data. Therefore, data were subject to non-sampling errors, such as underor over-reporting of energy and examiner effects. The approach used in these modeling exercises was the addition of food sources of DF consumed by that person in the sample. This scenario illustrates that to meet DF levels consumers have to select different foods higher in DF. A similar study is needed to look at modeling scenarios using a substitution approach for meeting DF recommendations with foods high in DF which are not commonly consumed by Americans.
The current recommendations for some foods to encourage (i.e. fruit, vegetables, and whole-grain products) in the diets of Americans may result in a substantial increase in energy consumed depending on how the consumer interprets them. The implication is that consumers need to consume more of these foods. Dietary recommendations that call for an increase in consumption of foods need to be clear that this should be within energy needs. This recommendation must be further translated to include that the consumption of these foods, in their lowest fat form, needs to go together with decreasing other nutrient-poor foods, added fats and added sugars in the diet. The challenge is how to get these messages to the consumer in a way that is both useful and valuable to them.
5. Acknowledgements
This work is a publication of the United States Department of Agriculture (USDA/ARS). Children’s Nutrition Research Center, Department of Pediatrics, Baylor College of Medicine, and Houston, Texas. The contents of this publication do not necessarily reflect the views or policies of the USDA, nor does mention of trade names, commercial products, or organizations imply endorsement from the US government. This research project is supported by the USDA—Agricultural Research Service through specific cooperative agreement 58-6250-6-003 and the Kellogg’s Corporate Citizenship Fund. Partial support was received from the Hatch project LAB 93951. Special thanks to Lori Briones for help in preparing the manuscript and Bee Wong for obtaining research articles.
REFERENCES
- J. W. Anderson, et al., “Health Benefits of Dietary Fiber,” Nutrition Reviews, Vol. 67, No. 4, 2009, pp. 188-205. doi:10.1111/j.1753-4887.2009.00189.x
- J. A. Marlett, et al., “Position of the American Dietetic Association: Health Implications of Dietary Fiber,” Journal of the American Dietetic Association, Vol. 102, No. 7, 2002, pp. 993-1000. doi:10.1016/S0002-8223(02)90228-2
- D. Timm and J. Slavin, “Dietary Fiber and the Relationship to Chronic Diseases,” American Journal of Lifestyle Medicine, Vol. 2, No. 3, 2008, pp. 233-240. doi:10.1177/1559827608314149
- E. B. Rimm, et al., “Vegetable, Fruit, and Cereal Fiber Intake and Risk of Coronary Heart Disease among Men,” Journal of the American Medical Association, Vol. 275, No. 6, 1996, pp. 447-451. doi:10.1001/jama.275.6.447
- A. Wolk, et al., “Long-term Intake of Dietary Fiber and Decreased Risk of Coronary Heart Disease among Women,” Journal of the American Medical Association, Vol. 281, No. 21, 1999, pp. 1998-2004. doi:10.1001/jama.281.21.1998
- P. Pietinen, et al., “Intake of Dietary Fiber and Risk of Coronary Heart Disease in a Cohort of Finnish Men. The Alpha-Tocopherol, Beta-Carotene Cancer Prevention Study,” Circulation, Vol. 94, No. 11, 1996, pp. 2720-2727.
- L. A. Bazzano, “Effects of Soluble Dietary Fiber on LowDensity Lipoprotein Cholesterol and Coronary Heart Disease Risk,” Current Atherosclerosis Reports, Vol. 10, No. 6, 2008, pp. 473-477. doi:10.1007/s11883-008-0074-3
- J. R. Lupton and N. D. Turner, “Dietary Fiber and Coronary Disease: Does the Evidence Support an Association?” Current Atheroscler Report, Vol. 5, No. 6, 2003, pp. 500-505. doi:10.1007/s11883-003-0041-y
- M. A. Pereira, et al., “Dietary Fiber and Risk of Coronary Heart Disease: A Pooled Analysis of Cohort Studies,” Archives of Internal Medicine, Vol. 164, No. 4, 2004, pp. 370-376. doi:10.1001/archinte.164.4.370
- L. A. Bazzano, et al., “Dietary Fiber Intake and Reduced Risk of Coronary Heart Disease in US Men and Women: The National Health and Nutrition Examination Survey I Epidemiologic Follow-up Study,” Archives of Internal Medicine, Vol. 163, No. 16, 2003, pp. 1897-1904. doi:10.1001/archinte.163.16.1897
- K. Kaline, et al., “The Importance and Effect of Dietary Fiber in Diabetes Prevention with Particular Consideration of Whole Grain Products,” Hormone and Metabolic Research, Vol. 39, No. 9, 2007, pp. 687-693. doi:10.1055/s-2007-985811
- V. Vuksan, et al., “Fiber Facts: Benefits and Recommendations for Individuals with Type 2 Diabetes,” Current Diabetes Reports, Vol. 9, No. 5, 2009, pp. 405-411. doi:10.1007/s11892-009-0062-1
- M. Galisteo, et al., “Effects of Dietary Fibers on Disturbances Clustered in the Metabolic Syndrome,” Journal of Nutritional Biochemistry, Vol. 19, No. 2, 2008, pp. 71-84. doi:10.1016/j.jnutbio.2007.02.009
- M. A. Pereira and D. S. Ludwig, “Dietary Fiber and Body-Weight Regulation. Observations and Mechanisms,” Pediatric Clinics of North America, Vol. 48, No. 4, 2001, pp. 969-980. doi:10.1016/S0031-3955(05)70351-5
- N. C. Howarth, et al., “Dietary Fiber and Weight Regulation,” Nutrition Review, Vol. 59, No. 5, 2001, pp. 129- 139. doi:10.1111/j.1753-4887.2001.tb07001.x
- J. L. Slavin, “Dietary Fiber and Body Weight,” Nutrition, Vol. 21, No. 3, 2005, pp. 411-418. doi:10.1016/j.nut.2004.08.018
- A. D. John, et al., “Fluid Flow Evaluation of Fuji Triage and Gray and White ProRoot Mineral Trioxide Aggregate Intraorifice Barriers,” Journal of Endodontics, Vol. 34, No. 7, 2008, pp. 830-832. doi:10.1016/j.joen.2008.03.014
- National Academy of Sciences, “Institute of Medicine of the National Academies, Dietary Reference Intakes for Energy, Carbohydrate, Fiber, Fat, Fatty Acids, Cholesterol, Protein, and Amino Acids. Panel on Macronutriaents,” National Academy Press, Washington DC, 2002.
- United States Department of Agriculture, “MyPlate,” 2011. http://www.choosemyplate.gov
- A. Moshfegh, J. Goldman and L. Cleveland, “What We Eat in America, NHANES 2001-2002: Usual Nutrient Intakes from Food Compared to Dietary Reference Intakes,” US Department of Agriculture, Agricultural Research Service, Washington DC, 2005
- The Secretary of Health and Human Services and the Secretary of Agriculture, “Report of the Dietary Guidelines Advisory Committee on the Dietary Guidelines for Americans, 2005,” US Department of Agriculture, Washington DC, 2005.
- L. Van Horn, “Development of the 2010 US Dietary Guidelines Advisory Committee Report: Perspectives from a Registered Dietitian,” Journal of American Dietetic Association, Vol. 110, No. 11, pp. 1638-1645.
- IFIC, “2009 Food and Health Survey: Consumer Attitudes towards Food, Nutrition and Health,” 2009 Food & Health Results Web Cast Series, International Food Information Council, Washington DC, 2009.
- IFIC, “2008 Food and Health Survey: Consumer Attitudes towards Food, Nutrition and Health,” 2009 Food & Health Results Web Cast Series, International Food Information Council, Washington DC, 2009.
- National Center for Health Statistics, “National Health and Nutrition Examination Survey (NHANES) 1999-Current,” 2000.
- National Center for Health Statistics, “National Health and Nutrition Examination Survey (NHANES), 2006,” Analytic Reporting Guidelines, 2006
- National Center for Health Statistics, “NHANES MEC In-Person Dietary Interviewers Procedures Manual,” 2002
- J. M. Conway, et al., “Effectiveness of the US Department of Agriculture 5-Step Multiple-Pass Method in Assessing Food Intake in Obese and Nonobese Women,” American Journal of Clinical Nutrition, Vol. 77, No. 5, 2003, pp. 1171-1178.
- USFAD Administration, “Appendix B: Addition Requirements for Nutrient Content Claims,” Guidance for Industry: A Food Labeling Guide, 2008.
- National Cancer Institute, “Usual Dietary Intakes: The NCI Method, in Risk Factor Monitoring and Methods,” 2011. http://riskfactor.cancer.gov/diet/usualintakes/method.html
- National Cancer Institute, “SAS Macros for Estimating Ratios of Usual Intakes of Dietary Components, in Risk Factor Monitoring & Methods,” 2011. http://riskfactor.cancer.gov/diet/usualintakes/macros.html
- L. Crawford, “Speech before Whole Grains & Health: A Global Summit,” Food and Drug Administration Mineapolis, 2005.
- F. F. De Moura, et al., “Applying the FDA Definition of Whole Grains to the Evidence for Cardiovascular Disease Health Claims,” Journal of Nutrition, Vol. 139, No. 11, 2009, pp. 2220S-2226S. doi:10.3945/jn.109.112383
- US Department of Agriculture, “National Nutrient Database for Standard Reference, Release 21,” US Department of Agriculture, Washington DC, 2011.
- T. A. Ledoux, et al., “Relationship of Fruit and Vegetable Intake with Adiposity: A Systematic Review,” Obesity Review, Vol. 12, No. 5, 2010, pp. e143-e150. doi:10.1111/j.1467-789X.2010.00786.x
- S. S. Casagrande, et al., “Have Americans Increased Their Fruit and Vegetable Intake? The Trends between 1988 and 2002,” American Journal of Preventive Medicine, Vol. 32, No. 4, 2007, pp. 257-263. doi:10.1016/j.amepre.2006.12.002
- A. Kant, et al., “Dietary Diversity in the US Population, NHANES II, 1976-1980,” Journal of the American Dietetic Association, Vol. 91, No. 12, 1991, pp. 1526-1531.
- National Cancer Institute, “Dietary Sources of Energy, Solid Fats, & Added Sugars among Children & Adolescents in the United States, in Risk Factor Monitoring and Methods,” 2010. http://riskfactor.cancer.gov/diet/usualintakes/sofaas.html
- I. A. Brownlee, et al., “Markers of Cardiovascular Risk Are Not Changed by Increased Whole-Grain Intake: The WHOLEheart Study, a Randomised, Controlled Dietary Intervention,” British Journal of Nutrition, Vol. 104, No. 1, pp. 125-134. doi:10.1017/S0007114510000644
- B. Horovitz, “Kellogg Adds Fiber, Hoping to Bowl Cereal Consumers Over,” USA Today, 2009.