Open Journal of Energy Efficiency
Vol.2 No.2(2013), Article ID:33004,14 pages DOI:10.4236/ojee.2013.22011
The Effect of Transition Hysteresis Width in Thermochromic Glazing Systems
1Department of Chemistry, University College London, Christopher Ingold Laboratories, London, UK
2UCL Energy Institute, Central House, London, UK
3School of Property, Construction and Project Management, RMIT University, Melbourne, Australia
4School of Engineering and Materials Science, Queen Mary University of London, London, UK
Email: *r.binions@qmul.ac.uk
Copyright © 2013 Michael E. A. Warwick et al. This is an open access article distributed under the Creative Commons Attribution License, which permits unrestricted use, distribution, and reproduction in any medium, provided the original work is properly cited.
Received January 15, 2013; revised February 23, 2013; accepted March 20, 2013
Keywords: Energy Simulation; Energy Demand Reduction; Thermochromic Glazing
ABSTRACT
Thermochromic glazing theoretically has the potential to lead to a large reduction in energy demand in modern buildings by allowing the transmission of visible light for day lighting whilst reducing unwanted solar gain during the cooling season, but allowing useful solar gain in the heating season. In this study building simulation is used to examine the effect of the thermochromic transition hysteresis width on the energy demand characteristics of a model system in a variety of climates. The results are also compared against current industry standard glazing products. The results suggest that in a warm climate with a low transition temperature and hysteresis width energy demand can be reduced by up to 54% compared to standard double glazing.
1. Introduction
Thermochromic glazing systems have often been proposed as possible candidates for use as intelligent glazing systems for use in energy saving windows. There has been work done on potential thin film candidates, such as VO2, and how the composition and structure can be modified to fit the best properties for a thermochromic glazing. These properties are assumed to be transition temperature for the material needs to be near that of room temperature (20˚C - 25˚C). The transition should occur quickly meaning that the gradient of the hysteresis should be steep and that the hysteresis loop width should be as narrow as possible. While these parameters seem to reasonable assumptions there has been very little work done [1-3] to see what effects each of these variables has on the potential efficiency of the material as an energy saving product. It is also worthwhile investigating the magnitude of the effect each of these factors has on the efficiency and whether they vary in effect with environmental factors.
Thin films of vanadium (IV) oxide have been the subject of significant research efforts in recent years due to their proposed application as an “intelligent” energy efficient window coating [4,5]. These technologies are based on a temperature modulated structural phase change, which occurs in the pure material at 68˚C where the low temperature monoclinic phase (VO2 M) converts to the higher temperature rutile phase (VO2 R) [6]. Significant changes in electrical conductivity and infra-red optical properties occur in the material as a result of this structural change. The rutile material is metallic in nature and reflects a wide range of solar radiation, whereas the monoclinic phase is a semiconductor and transmissive across the same range of solar radiation. This dynamic switching behaviour is in contrast to existing commercial approaches which rely on glazing with static behaviour such as heat mirrors, absorbing glass or Low-E coatings [7]. For vanadium dioxide to be effective as an intelligent window coating it is highly desirable to lower the transition temperature from 68˚C to nearer room temperature in order to maximize the energy demand reduction properties [1]. Doping studies have shown that the transition temperature can be altered by the incorporation of metal ions into the vanadium dioxide lattice [8,9]. It has been demonstrated that the most effective metal ion dopant is tungsten, which is found to lower the transition temperature of the material by 25˚C for every atomic percent incorporated of the dopant [10]. The transition temperature has also been shown to be affected by film strain [11] and it has been demonstrated that strain can be introduced by careful choice of deposition conditions [12]. Tungsten doped vanadium dioxide films have been prepared by a variety of methods including physical vapour deposition [13], sol-gel [14], and chemical vapour deposition (CVD) methodologies [15-17]. CVD routes to the production of VO2 films are generally considered more attractive because of the ability to integrate CVD processes with high volume float glass manufacture and the physical properties of CVD produced films, which are generally adherent and durable [18].
The synthesis of thermochromic VO2 films is by now largely well known and understood. However there is a major gap in knowledge of the energy demand reduction properties that these films may confer to glazing systems. Such advantages in the use of these coatings have not been significantly investigated with only a few reports existing in the literature [1-3,18]. Indeed very little attention at all has been paid to the various parameters of the transition such as hysteresis width, hysteresis gradient and change in transmission/reflectance with respect to their energy saving performance.
Several studies have been performed on electrochromic [19-22] and thermotropic [23-25] systems suggesting that such systems can significantly reduce the overall energy demand and enhance overall building energy performance. The advantage of a thermochromic system based on VO2 compared to these systems is that there is no change in the visible portion of the spectrum, only in the infrared portion [7].
In this paper we use energy-modeling studies of some idealized spectra to examine the effect of thermochromic transition hysteresis width on the energy demand reduction properties of thermochromic glazing systems based on VO2 in several different climates. They are assessed with reference to some existing commercial products. This study, the first of this kind, is crucial to evaluate and quantify the performance of thermochromic glazing and the various transition parameters.
2. Experimental
Energy Plus software developed by the Lawrence Berkeley National Laboratory [26] and US Department of Energy was used to perform energy simulations and analysis. Energy Plus TM is an energy analysis and thermal load simulation program based on a user’s description of a building from the perspective of the building’s physical make-up, associated mechanical systems, etc. A series of simulations with different configurations and settings were run in order to evaluate the performance of the thermochromic coatings in different climates. The simulation set period is one year, with data points gathered every hour. A very simple model of a room in a building was constructed in Energy Plus TM. The room has external dimensions 6 m × 5 m × 3 m (length × width × height) and it is placed so that the axis of every wall is perpendicular to one of the orientation north, south, west and east. We consider the room to represent the facade of a generic building so that just one wall is exposed to the external environment (weather, sun, wind, etc.); the remaining three walls are not affected by external conditions. The building is located in the northern hemisphere and the external wall is supposed to be exposed to the southern side. The modeled zone is a mid floor office, of a multi-story block, buffered both above and below by conditioned spaces. The ground temperature would therefore have no effect on the performance of the studied zone. The choice of ground temperature was set not to reflect the real local ground temperature but rather the temperature of a further buffering zone, below the modeled spaces, and was taken to be 18˚C throughout the year.
One glazing possibility was considered comprising the whole of the southern face (100%)—a glazing wall, representing a modern commercial building. Further details governing the materials used for walls, etc., have been previously reported [1]. In both cases the window is double glazed with a 12 mm air cavity, the coating was always modeled on the inside face of the outer pane. The only difference between each simulation was the glazing or coating used The internal conditions were chosen to be air-conditioned between 19˚C and 26˚C to maintain a comfortable working/living environment. The required illuminance level in an office building is taken to be 500 lux, this corresponds to a lighting load of 400 W. The lights are fully dimmable: lowering their output when there is an adequate illuminance from the sun, in order to save energy. It is considered that they can be dimmed in the whole range from 0% to 100%. The dimming control is automatic and zoned. The casual heat gain (persons + equipment) is taken to be 500 W in total and the ventilation rate used is 0.025 m3/s. Building occupancy was set as occupied from 8:00 till 18:00, five days a week, as is normal for an office. The simulations were run for three different cities representing heating dominated (Helsinki), cooling dominated (Palermo) and mixed (London) environments.
The thermochromic properties of the glazing were modeled in version 5.0.0 of Energy Plus by entering the spectral data of the glazing in the hot and cold states. The thermochromic hysteresis effect was controlled by use of a set of schedules and the thermochromic model built into the energy plus software. The thermochromic model allows for individual spectral properties to be assigned a specific temperature range in which they will be utilized according to the glazing surface temperature. This means that as the surface temperature changes, the spectral data used to determine the amount of solar radiation entering the building will change, thus simulating the thermochromic effect. By varying the temperature range over which each spectrum is used allows for the creation of a suitable thermochromic hysteresis gradient model. The window surface temperature was correlated against the incident solar radiation.
To model the hysteresis width into the systems the model was run then analyzed to establish when the glazing system was “heating” or “cooling” according to the surface temperature of the window, using this data a series of individual daily schedules was produced and these could be used to control which glazing was to be used a which times.
Two thermochromic hysteresis gradient models; one “heating”, for when the system is in the heating portion of hysteresis loop, one “cooling”, for the cooling system of the hysteresis loop were set up in the thermochromic model. The schedule produced from the heating and cooling data could then be used to assign which set of spectra was to be used at which times there for creating a thermochromic system model.
The model is clearly limited because the building is not ideal for all climates. Insulation layers, as well as the materials chosen here, in warmer and cooler climates would be different from that used in the model depending not only on local climate conditions but also on the constructive techniques and materials available in loco. Likewise the assumption that a constant ground temperature of 18˚C throughout the year is significant. However, by using the results obtained from the plain glass simulations as a baseline we aim to isolate the change in energy performance caused by the use of different glazings.
2.1. Choice of Spectra Used
The results of the energy plus out puts for of the theoretical gradients are shown below. Blank glass and two already commercially available static coatings, absorbing glass (AG) and silver sputtered glass (SSG), spectra shown in Figure 1, were also modelled as to be used as references by which the effective energy savings could be compared.
It is defined that any plausible window glazing candidate would require a transmission of at least 60% in the visible region so as to still allow enough light in to effectively provide light source, and that to be effective energy efficient thermochromic glazing there would be a large change in transmission in the infra red region. Several transmission/reflectance UV-vis spectra (Figure 2) were generated with an overall change of 65% in the infrared region. These spectra could then be entered in to the thermochromic model of the Energy plus TM programme to simulate variations in the thermochromic properties of a glazing system.
Figure 2 shows the maximum and minimum spectra for the transmission/reflectance, i.e. the spectra for the hottest and coldest states of the materials. In order to recreate a transition between these two states a series of spectra were produced at increments of 2.5% transmission/reflectance. Each of the pairs of spectra could then be assigned to a temperature and a hysteresis gradient created. By changing the temperature gap (ΔT) between each spectra the temperature range during which the thermochromic transition occurred could be varied and therefore the hysteresis gradient changed. In total 27 spectra were made so if ΔT was set at 1˚C the thermochromic transition of 65% would occur of a 27˚C range around transition temperature (Tc). Transition temperatures were chosen to be 20˚C, 25˚C, 30˚C and 35˚C.
2.2. Hysteresis Width Variation
The other factor thought to effect the efficiency of thermochromic glazing is the width of the hysteresis loop. This affects the temperature at which the thermochromic transition occurs on heating and cooling the window. To model the effect that this has on the performance three hysteresis widths were investigated corresponding to widths of 5˚C, 10˚C and 15˚C these theoretical widths/ gradients are shown in Figure 3.
The hysteresis used all had a gradient of −2.5 DT%/˚C and transition temperatures of 20˚C, 25˚C, 30˚C and 35˚C as the change in transition temperature can effect the efficiency of the systems with respect to the other transition parameters.
3. Results
3.1. Climates Investigated
Three cities were chosen to represent climates that are: cooling dominated—Palermo, heating dominated-Helsinki and mixed—London, in order to determine the type of climate that thermochromic glazing is able to have the greatest influence in.
3.2. Palermo
Figure 4 shows the daytime highs and night-time lows for a one-year period in Palermo, Italy. The figure shows that for the majority of the year the temperature during the day is greater than the desired room temperature of 22˚C.
The average temperature throughout the year in Palermo is 29˚C. The environment is therefore a hot environment and energy demand is cooling dominated.
3.3. London
Figure 5 shows the temperature profiles for the period of
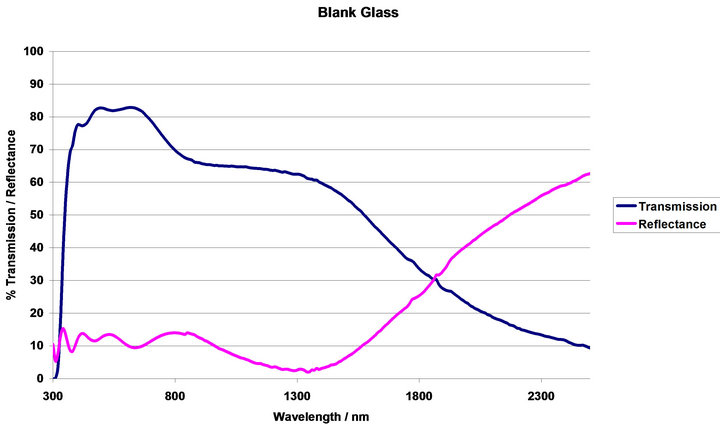
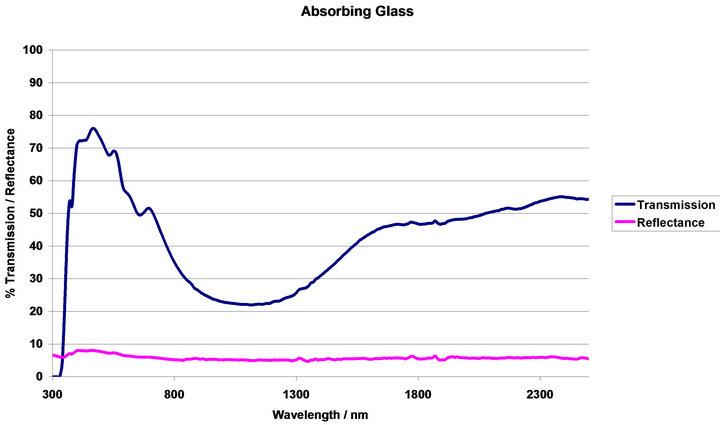
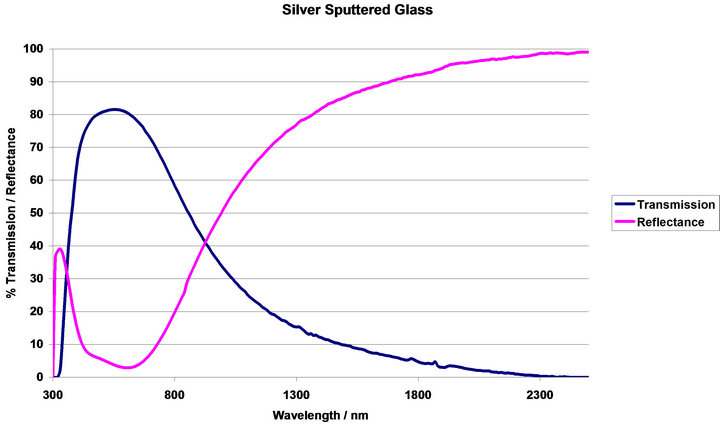
Figure 1. Transmission/reflectance spectral data for industrial standards and blank glass.
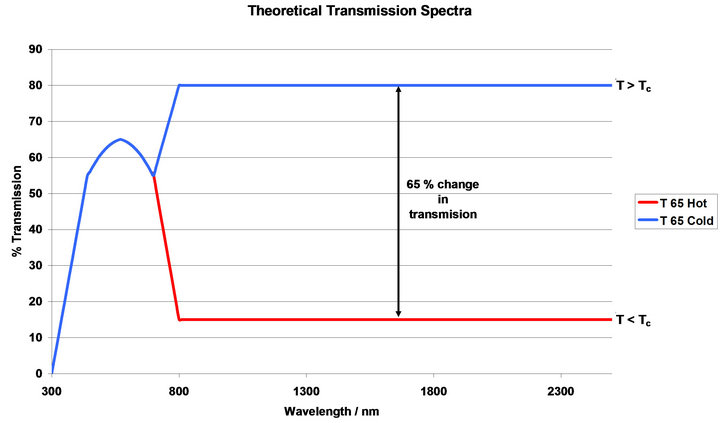
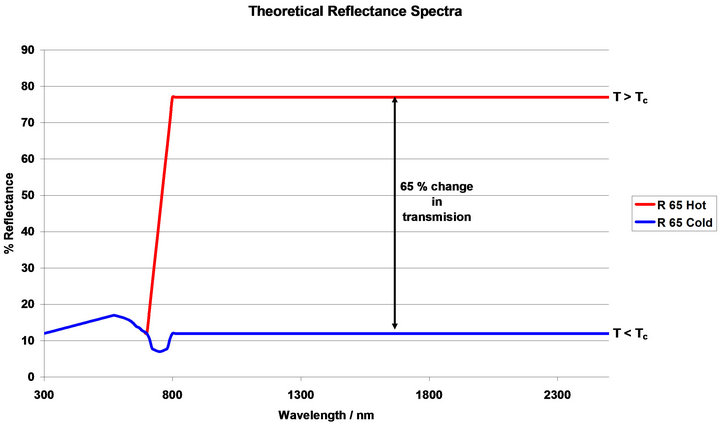
Figure 2. Theoretical transmission/reflectance data.
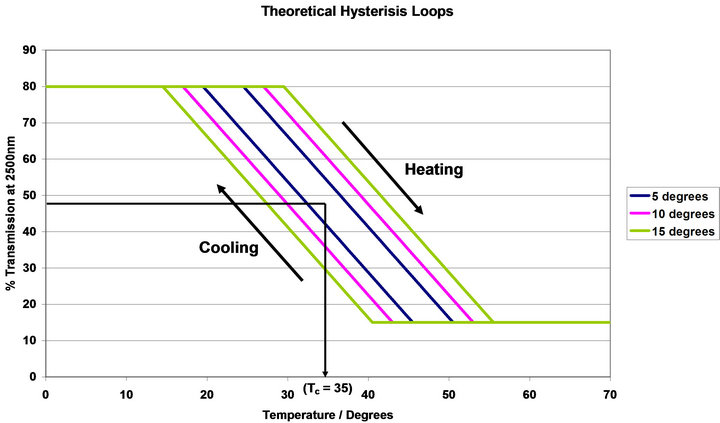
Figure 3. Diagram showing the theoretical hysteresis loops modelled for Tc = 35˚C.
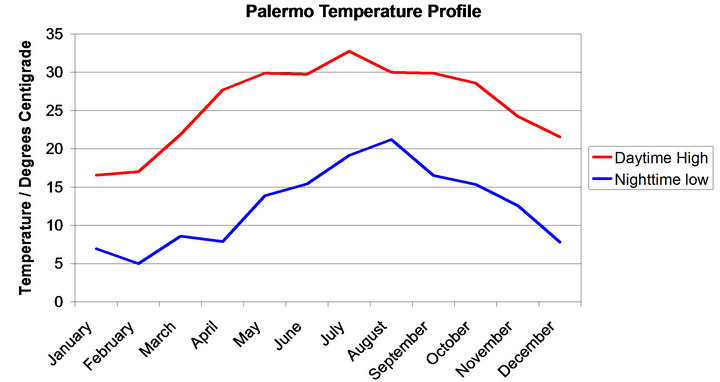
Figure 4. The daytime highs and night-time lows of the Palermo environment though out the year.
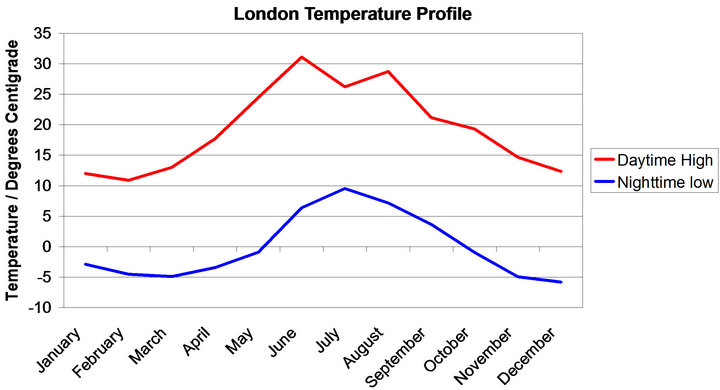
Figure 5. The daytime highs and night-time lows of the London environment throughout one year.
a year in London, UK.
We can see from Figure 5 that for around one quarter of the year, May-August, the environment will be cooling dominated. For the winter and autumn period, November to March the environment will heating dominated. For the remainder of the year there will be a mixture of heating and cooling required.
3.4. Helsinki
In Figure 6 the yearly temperature profiles for the daytime highs and the night-time lows for the Helsinki environment are shown.
It can be seen from Figure 6 that the climate requires heating for the majority of the year; making Helsinki a heating dominated climate. The amount of time spent above a comfortable room temperature (22˚C) is largely negligible, even in the summer months when the temperature may rise above this for one or two hours a day.
3.5. Intrinsic Energy Saving Properties of Glazing
The thermochromic systems modelled have an intrinsic energy reduction due to the absorbing properties of the systems, which will cause energy reduction even when the systems are in the cold state. To quantify the effect that this absorbing property would have the simulations were run using only the cold spectra. These results, shown in Figure 7, could then be used to see what portion of the energy reduction can be assigned to variable heat mirror properties and what is due to the absorbing properties.
4. Results
4.1. Palermo
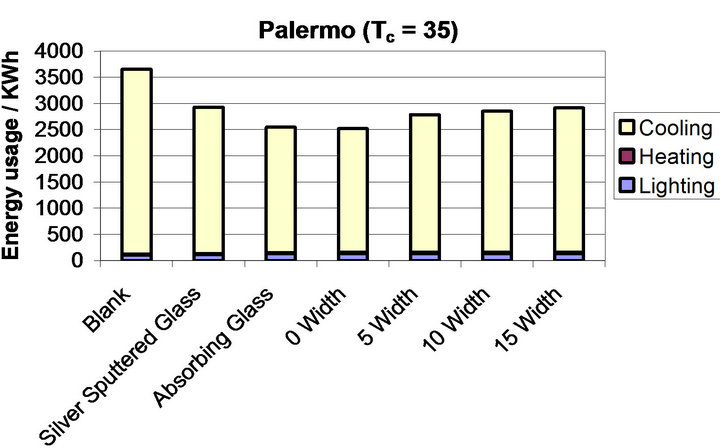
Figure 8 shows the energy usage required for different modelled systems for the environment in Palermo. Blank glass creates an energy demand of 3655 KWh and the two industry standards of SSG and AG require 2930 and 2547 KWh respectively. This means the AG leads to a 1109 kWh reduction in energy usage when compared to blank glass and SSG has a reduction of 726 kWh compared to blank glass.
Figure 8(a) shows the results for the thermochromic systems when the Tc value was set to 35˚C, in this set of systems the worst performing is the system where the hysteresis width is greatest (width = 15˚C) in this case
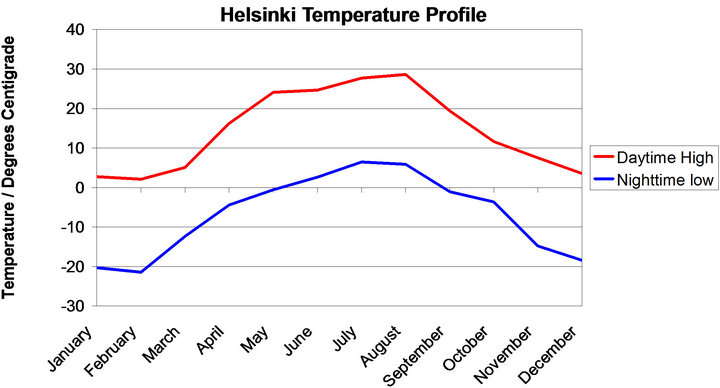
Figure 6. The daytime highs and night-time lows of the Helsinki environment throughout one year.
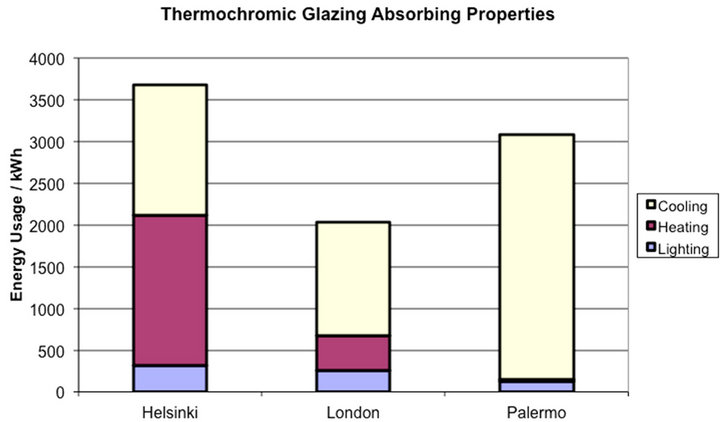
Figure 7. The total energy requirement in each environment due to absorbing properties of the thermochromic glazing.
 (a)
(a)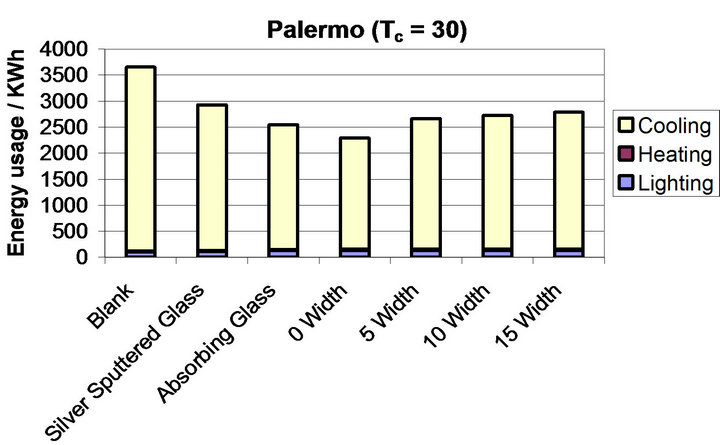 (b)
(b)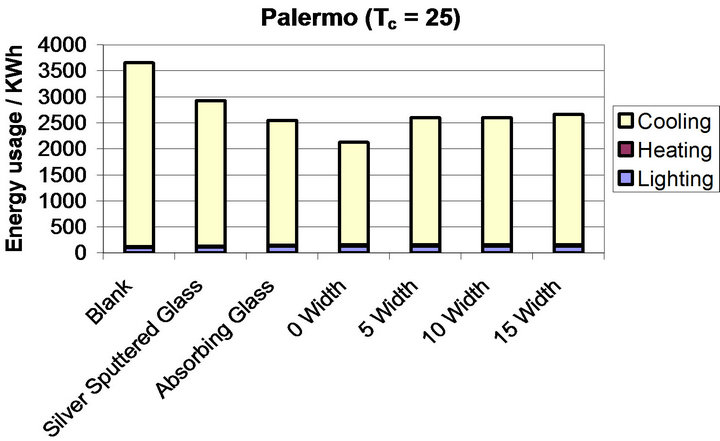 (c)
(c)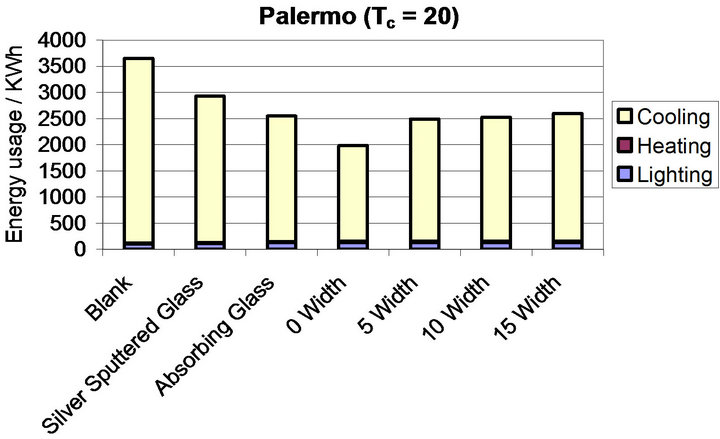 (d)
(d)
Figure 8. (a)-(d) show the breakdown of energy usage in a commercial building model based in Palermo for varying values of Tc ((a) = 35˚C, (b) = 30˚C, (c) = 25˚C, (d) = 20˚C) and varying hysteresis width (0˚C, 5˚C, 10˚C, 15˚C). Each Graph shows all modelled glazing systems. The colours correspond to the different energy requirements; yellow = cooling, maroon = heating and blue = lighting.
the energy demand is 2914 kWh a saving of 741 kWh compared to blank glass. As the width decreases the energy requirement also decreases when the width equals 10˚C the energy requirement is 2851 kWh, 5˚C the requirement is 2786 kWh and 0˚C where it drops to 2519 kWh. These energy requirements correspond to an improvement of 804, 870 and 1136 kWh respectively when compared to blank glass.
Figure 8(b) shows the thermochromic systems energy usage when the Tc value is decreased to 30˚C. When the hysteresis width is set to 0˚C (Figure 8(b), 0 width) the energy requirement is 2239 kWh corresponding to a reduction of 1362 kWh compared to blank glass. As the hysteresis width is increased the energy demand is increased. 5˚C width requires 2605 kWh, 10˚C width requires 2724 kWh and 15˚C width requires 2786 kWh. These values, when compared to blank glass correspond to energy demand reduction values of 991, 932, and 869 kWh.
When the value of Tc is equal to 25˚C (Figure 8(c)) the worst performing thermochromic system is the system with the largest hysteresis width (15˚C width,) for this system the energy demand is 2666 kWh a reduction of 991 kWh compared to blank glass. 10˚C width system requires 2600 kWh of power a reduction of 1056 kWh compared to blank glass, the 5˚C width system requires 2599 kWh a saving of 1057 kWh. The best performing system, 0 Width, requires 2124 kWh corresponding to a saving of 1531 kWh compared to blank glass.
Figure 8(d) shows the energy demands for the systems when Tc is set to 20˚C. For this set of simulations the least well performing system is the system with the greatest hysteresis width (15˚C width). The widest hysteresis width had an energy load of 2599 kWh this is a reduction of 1057 kWh compared to blank glass. As the hysteresis width is decreased the energy load decreases, a 10˚C width has an energy load of 2527 kWh a reduction of 1128 kWh compared to blank glass. 5˚C width has a 2492 kWh energy load, 1163 kWh less than blank glass. 0˚C width has the lowest energy demand of all the systems requiring 1983 kWh a reduction of 1672 kWh compared to blank glass.
The narrowing of the hysteresis width has greater affect at lower values of Tc, this can be seen by comparison of the energy load difference between the best and worst thermochromic for each value of Tc; Tc = 35˚C gap = 395 kWh, Tc = 30˚C gap = 493 kWh, Tc = 25˚C gap = 540 kWh, Tc = 20˚C gap = 615 kWh.
The results show that for the Palermo environment the thermochromic glazing with the lowest energy demand is one with a low value of Tc and as narrow a hysteresis width as possible (Figure 9). When comparing the thermochromics to the industry standards, AG and SSG, it can be seen that for all values of Tc the narrowest hysteresis width have a lower energy load. With low values of Tc it is still possible for the thermochromic glazing to out perform both industry standards. In all cases the thermochromic glazing out performs the SSG sample. It is clear from these results that the hysteresis width of the thermochromic transition has important consequences for the energy demand reduction properties of the glazing.
4.2. London
The energy load demand for the blank glass scenario is
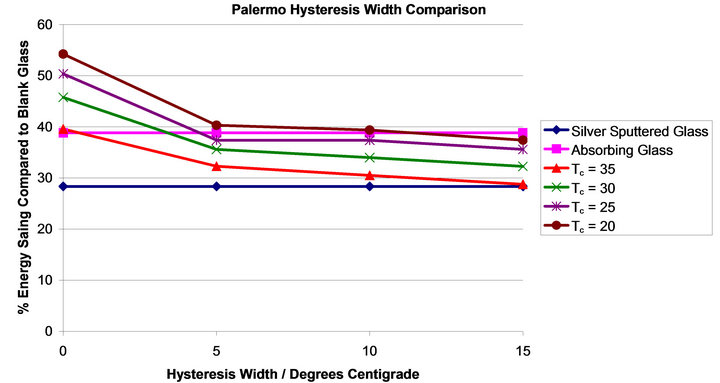
Figure 9. Shows the percentage energy saving of each system when compared to the blank glass system with variation of hysteresis width.
shown in Figure 10 for the London environment. The blank glass energy load corresponds to a value of 2373 kWh. Also shown in all of the graphs is the energy requirement for two industry standards AG (absorbing glass) and SSG (a heat mirror) these require energy loads of 1707 and 1845 kWh respectively. This means that AG corresponds to a saving of 666 kWh and SSG a saving of 527 kWh compared to blank glass. This indicates that the absorbing glass AG is slightly more effective for this environment than the SSG case.
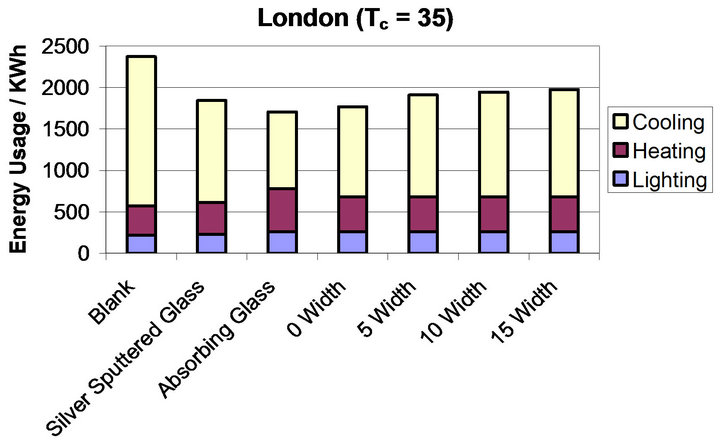
Figure 10(a) shows the systems modelled where the Tc is set to 35˚C for the thermochromic systems. For these systems the best performing is the one with the thinnest hysteresis width, width = 0˚C. As the hysteresis width is increased the energy demand is also in creased giving the following energy requirements; width = 0˚C energy load = 1769 kWh, width = 5˚C energy load = 1910 kWh, width = 10˚C energy load 1946 kWh and width = 15˚C energy load = 1978 kWh. These give energy demand reductions of 585, 429, 385 and 349 kWh compared to the blank glass system respectively.
For the systems where Tc = 30˚C, shown in Figure 10 b, the worst performing system is the one with the widest hysteresis width, width = 15˚C. The energy requirements decrease for each environment as the hysteresis width is narrowed with the 0˚C width requiring the lowest annual energy load. 15˚C width requires 1910 kWh, 10˚C width requires 1870 kWh, 5˚C width requires 1830 kWh, 0˚C width requires 1616 kWh when compared to a blank glass systems these systems gave reductions in energy usage of 462, 502, 542 and 757 kWh respectively.
Figure 10(c) shows the systems where the value of Tc is set to 25˚C, as with the previous systems the energy requirement increases with the increase in hysteresis width but the lower Tc results in lower overall energy requirements. 15˚C width has a 1830 kWh energy load, 10˚C width has a 1789 kWh energy load, 5˚C width has a 5˚C width energy load, 0˚C has a 1484 kWh energy load. These energy loads result in respective reductions of 542, 583, 612 and 888 kWh when compared to the system modelled for blank glass.
The final graph, Figure 10(d), shows the systems when the Tc value is reduced to 20˚C this yields thermochromic system with the lowest energy usage but still follow the trend as in the previous systems where the hysteresis width reduction corresponds to reduction in energy usage. 15˚C width requires 161 kWh, 10˚C width requires 1733 kWh, 5˚C requires 1723 kWh and 0˚C width requires an energy usage of 1388 kWh. These energy loads correspond to reductions in energy usage of 612, 639, 649 and 984 kWh respectively when compared to the blank glass system.
 (a)
(a) (b)
(b)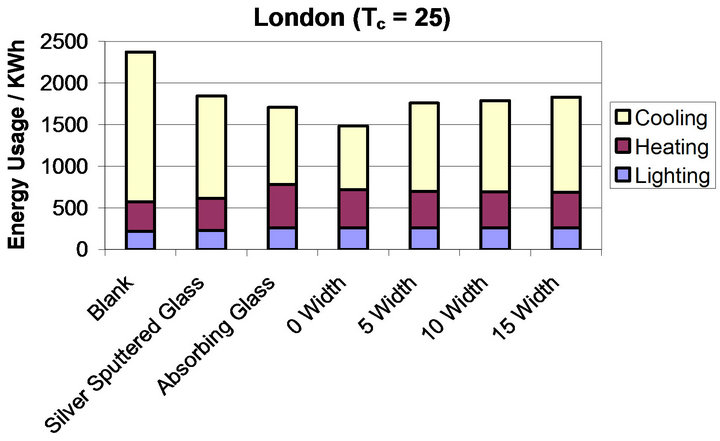 (c)
(c)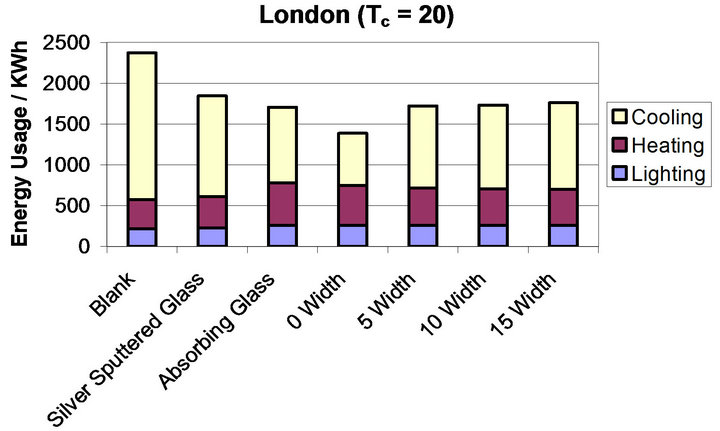 (d)
(d)
Figure 10. (a)-(d) show the breakdown of energy usage in a commercial building model based in London for varying values of Tc ((a) = 35˚C, (b) = 30˚C, (c) = 25˚C, (d) = 20˚C) and varying hysteresis width (0˚C, 5˚C, 10˚C, 15˚C). Each graph shows all modelled glazing systems. The colours correspond to the different energy requirements; yellow = cooling, maroon = heating, blue = lighting.
When comparing the results to the two industry standards (Figure 11) it can be seen that in the case where no hysteresis width is introduced, 0˚C width, the systems out perform both industry standards for all values of Tc (except where Tc = 35˚C). When hysteresis width is introduced there is a drop in the glazing improvement and the lower Tc cases (20˚C & 25˚C) perform comparably to the AG case and the higher Tc cases (30˚C & 35˚C) perform comparably to the SSG instance.
4.3. Helsinki
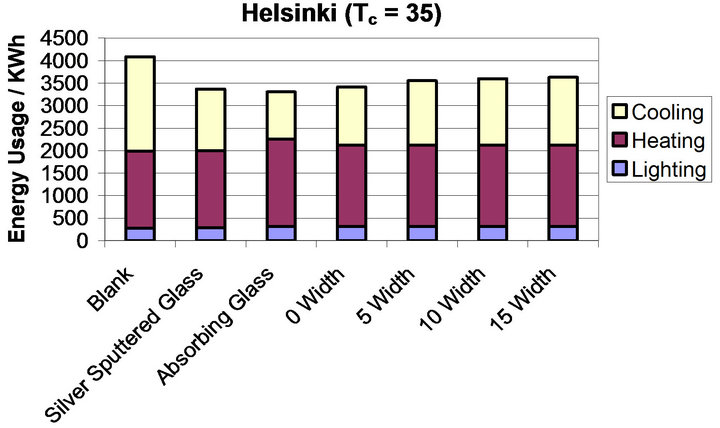
Figure 12 shows the different systems modelled for the Helsinki environment, each of the graphs, (a)-(d), show the systems using blank glass and two industry standards SSG (heat mirror) and AG (absorbing glass). The blank glass system has an energy load requirement of 4088 kWh. SSG has an energy load of 3369 kWh which is a decrease of 719 kWh compared to blank glass. AG has an energy load of 3306 kWh, which is a 782 kWh reduction in energy demand compared to the blank glass case. This indicates that for this environment AG is slightly more efficient than SSG.
Figure 12(a) shows the thermochromic systems where the value of Tc has been set to 35˚C. For the thermochromics in this set of simulations the best performing is the one with the thinnest hysteresis and as hysteresis width is increased the energy load requirement also increases. Then energy requirements are as follows. 0˚C width 3417 kWh, 5˚C width 3554 kWh, 10˚C width 3597 kWh and 15˚C width 3630 kWh. These energy loads, when compared to blank glass, correspond to reductions in energy of: 670, 533, 490 and 458 kWh respectively.
In Figure 12(b) the annual energy loads for systems with Tc value of 30˚C is shown. These systems show the same relationship between hysteresis width and energy load as was observable in the Tc = 35˚C systems where increased hysteresis width leads to increased energy load requirement. 0˚C width requires 3226 kWh, 5˚C width requires 3449 kWh, 10˚C width requires 3505 kWh and 15˚C width requires 3554 kWh of energy per year. These energy values correspond to reductions of 862, 638, 583 and 533 kWh respectively compared to the blank glass system.
Figure 12(c) shows the system where the value of Tc is set to 25˚C this system shows the same trend as the previous two systems with hysteresis width decrease leading to a decrease in energy load. 15˚C width 3449 kWh energy load, 10˚C width 3394 kWh energy load, 5˚C width 3346 kWh energy load and 0˚C width 3052 kWh energy load. These energy loads correspond to reductions, when compared to the blank glass system, of 638, 694, 741 and 1035 kWh respectively.
The last graph, Figure 12(d), shows the system with the lowest Tc value. This system gives the lowest value for each thermochromic when compared to the higher Tc value systems and like the other systems it shows the same trend of decreased hysteresis width leading to lower energy demands. 15˚C width requires 3346, 10˚C width requires 3305 kWh, 5˚C width requires 3276 kWh and 0˚C width requires 2908 kWh. When compared to the blank glass system these energy requirements correspond to reductions of 741, 783, 812 and 1180 kWh respectively.
When comparing the systems to the Industry standards it can be seen from Figure 13 that the thermochromic systems in which there has been a hysteresis width introduced all perform comparably or worse than the both the AG and the SSG systems. For this environment the best performing thermochromic is one with a low Tc value and a narrow hysteresis width, Figure 13, 0˚C width.
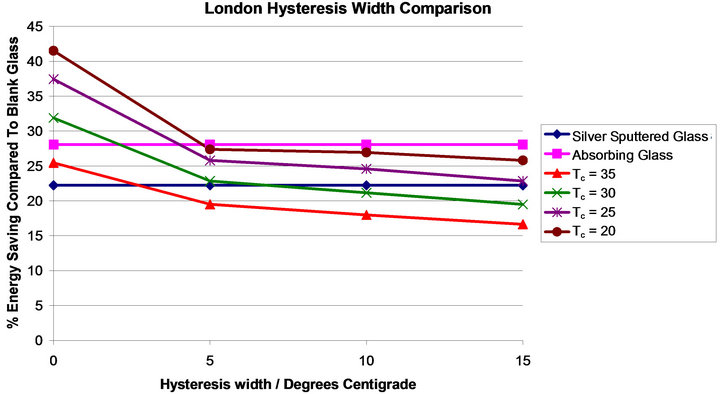
Figure 11. It shows the percentage energy saving of each system when compared to the blank glass system with variation of hysteresis width.
 (a)
(a)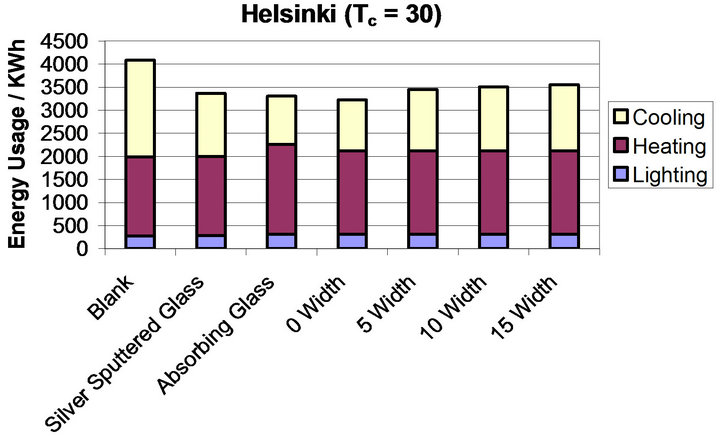 (b)
(b)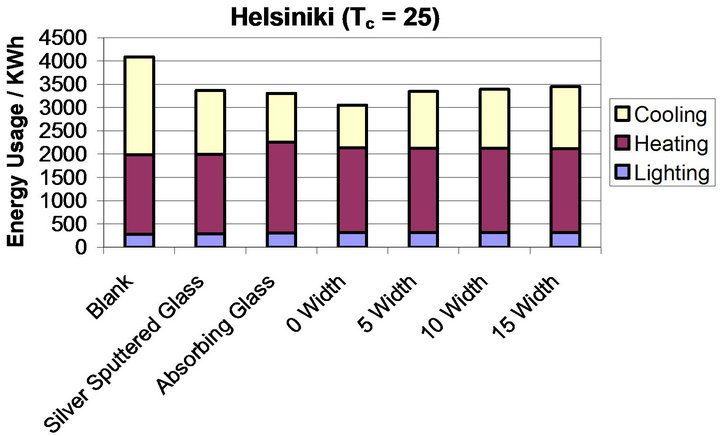 (c)
(c)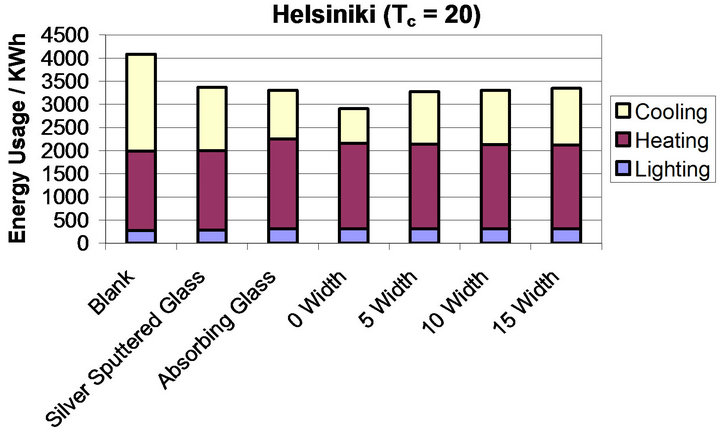 (d)
(d)
Figure 12. (a)-(d) show the breakdown of energy usage in a commercial building model based in Helsinki for varying values of Tc ((a) = 35˚C, (b) = 30˚C, (c) = 25˚C, (d) = 20˚C) and varying hysteresis width (0˚C, 5˚C, 10˚C, 15˚C). Each graph shows all modelled glazing systems. The colours correspond to the different energy requirements; yellow = cooling, maroon = heating, blue = lighting.
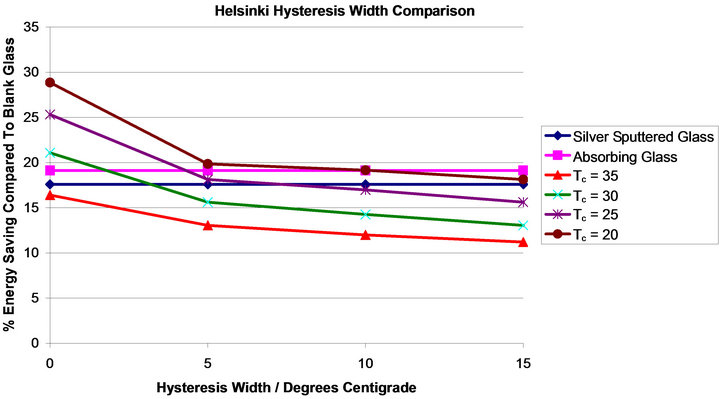
Figure 13. It shows the percentage energy saving of each system when compared to the blank glass system with variation of hysteresis width.
5. Discussion
There are some noticeable general trends in all of the data. Firstly and foremost a lower transition temperature leads to a bigger energy saving. Secondly a lower transition hysteresis width leads to a bigger energy saving. It is also noticeable that the transition temperature has a bigger effect than the hysteresis transition width, i.e. an improvement of 1% per degree Tc reduction as opposed to an improvement of ~0.5% per degree reduction in hysteresis width (except at very low width).
The overall effect in each of the climates investigated was to reduce the energy demand when compared to the clear-clear glazing system. In the hot environment, Palermo, the best performance was for the lowest transition temperature investigated (20˚C) and the lowest hysteresis width (0˚C) with a total energy load of 1983 kWh, representing a reduction in demand of 1672 kWh or 54% compared to the clear-clear glazing system. This was also improvement compared to the industry standards which gave energy demand reductions of 39% for the absorbing glass and 28% for the silver sputtered glass compared to the clear-clear glazing system.
In the mixed environment, London, the best performance was also given by the scenario with the lowest transition temperature investigated (20˚C) and the lowest hysteresis width (0˚C) with a total energy load of 1388 kWh, representing a reduction in demand of 984 kWh or 43% compared to the clear-clear glazing system. This was also improvement compared to the industry standards which gave energy demand reductions of 27% for the absorbing glass and 22% for the silver sputtered glass compared to the clear-clear glazing system.
In the cool environment, Helsinki, the scenario with the lowest transition temperature investigated (20˚C) and the lowest hysteresis width (0˚C) also gave the best energy demand reduction performance. A total energy demand of 2908 kWh was required, representing a reduction in demand of 1180 kWh or 27% compared to the clear-clear glazing system. This was also improvement compared to the industry standards which gave energy demand reductions of 18% for the absorbing glass and 17% for the silver sputtered glass compared to the clearclear glazing system.
Biggest energy improvement is in the hot climate (Palermo), although there is still significant energy demand reduction in the mixed and cool climates investigated (London and Helsinki)
It is readily apparent that the switching of the glazing is having a significant effect. In the best case in each climate the inherent energy demand of the low temperature thermochromic glazing (i.e. no switching) is 3086 kWh for Palermo, 2028 kWh for London and 3676 kWh for Helsinki. In comparison the best thermochromic performance in each climate leads to an overall energy demand of 1983 kWh for Palermo, 1388 kWh for London and 2908 kWh for Helsinki, which represents an energy demand reduction of 36%, 32%, 21% for Palermo, London and Helsinki respectively.
One notable phenomenon is that typically an extra 10% - 15% in energy demand improvement over blank glass can be gained by reducing the hysteresis width from 5˚C to 0˚C. The thinner the hysteresis width the more quickly the hot state is entered, thus allowing for maximum efficiency in allowing most appropriate glazing characteristics to be used. However, the production of thin vanadium dioxide thin films with a 0˚C hysteresis width is not enormously realistic. It is not well understood how to obtain low hysteresis widths, although uniform particle size has been suggested as one possible route [12]. In any case, the vast majority of samples in the literature have widths of 5˚C - 10 ˚C [16,17,26-30]. Which gives a comparable or moderately enhanced performance when compared to the absorbing glass, and a significantly improved performance over the sputtered silver glass.
None the less thermochromic glazing would still provide an additional energy benefit of 1% - 3% compared to absorbing glass and there are a number of practical reasons to prefer a coating of this type. Sputtered silver glasses are typically produced by PVD methodologies and have a limited life span, typically around 10 years much less than the average life span of a modern commercial building. Absorbing glasses are produced by body tiniting, obtaining a stable glass melt in the float glass production time is a laborious process, typically taking around 100 hours, during which time any glass produced at the factory is not saleable this represent 100% loss during this time. Producing films via an integrated CVD process allows for deposition to be turned on and off at will, drastically reducing the float line down time and improving factory efficiency
6. Conclusion
The energy demand associated with the use of a theoretical thermochromic coating in architectural glazing has been evaluated, using the energy simulation package EnergyPlus. The study, the first of this kind, examines the effect of different hysteresis properties of the thermochromic transition. The results demonstrate that such thermochromic glazing could have an additional energy benefit in excess of those approaches currently used in warmer climates. This arises from a combination of absorbing and heat mirror behaviour. The best energy performance occurred in the warm climate examined and where the thermochromic transition temperature was lowest and the hysteresis width at it’s thinnest. In this instance the energy demand of the model could be reduced by 54% compared to a standard double glazed system. The results also indicate that transition temperature has a much larger effect on the energy demand reduction properties of the glazing than the hysteresis width—an improvement of 1% per degree Tc reduction as opposed to an improvement of ~0.5% per degree reduction in hysteresis width. It does however, highlight that hysteresis width does have an important role to play in enhancing the energy demand reduction characteristics of thermochromic glazing systems and that this needs to be considered when thermochromic thin films are synthesised.
7. Acknowledgements
RB thanks the Royal Society for a Dorothy Hodgkin fellowship and the EPSRC for financial support (grant number EP/H005803/1). Mr. Kevin Reeves is thanked for invaluable assistance with electron microscopy.
REFERENCES
- M. Saeli, C. Piccirillo, I. P. Parkin, R. Binions and I. Ridley, “Energy Modelling Studies of Thermochromic Glazing,” Energy and Buildings, Vol. 42, No. 10, 2010, pp. 1666-1673. doi:10.1016/j.enbuild.2010.04.010
- H. Ye, X. Meng and B. Xu, “Theoretical Discussions of Perfect Window, Ideal Near Infrared Solar Spectrum Regulating Window and Current Thermochromic Window,” Energy and Buildings, Vol. 49, 2012, pp. 164-172. doi:10.1016/j.enbuild.2012.02.011
- X. Ye, Y. Luo, X. Gao and S. Zhu, “Design and Evaluation of a Thermochromic Roof System for Energy Saving Based on Poly(N-isopropylacrylamide) Aqueous Solution,” Energy and Buildings, Vol. 48, 2012, pp. 175-179. doi:10.1016/j.enbuild.2012.01.024
- C. G. Granqvist, “Window Coatings for the Future,” Thin Solid Films, Vol. 193-194, 1990, pp. 730-741. doi:10.1016/0040-6090(90)90225-3
- C. G. Granqvist, “Solar Energy Materials,” Advanced Materials, Vol. 15, No. 21, 2003, pp. 1789-1803. doi:10.1002/adma.200300378
- K. D. Rogers, “An X-Ray Diffraction Study of Semiconductor and Metallic Vanadium Dioxide,” Powder Diffraction, Vol. 8, No. 4, 1993, pp. 240-244. doi:10.1017/S0885715600019448
- S. S. Kanu and R. Binions, “Thin Films for Solar Control Coatings,” Proceedings of the Royal Society A: Mathematical, Physical and Engineering Science, Vol. 466, 2009, pp. 19-44.
- F. Béteille, R. Morineau, J. Livage and M. Nagano, “Switching Properties of V1−xTixO2 Thin Films Deposited from Alkoxides,” Materials Research Bulletin, Vol. 32, No. 8, 1997, pp. 1109-1117. doi:10.1016/S0025-5408(97)00084-6
- T. E. Phillips, R. A. Murphy and T. O. Poehler, “Electrical Studies of Reactively Sputtered Fe-Doped VO2 Thin Films,” Materials Research Bulletin, Vol. 22, No. 8, 1987, pp. 1113-1123. doi:10.1016/0025-5408(87)90241-8
- T. D. Manning, I. P. Parkin, M. E. Pemble, D. Sheel and D. Vernardou, “Intelligent Window Coatings: Atmospheric Pressure Chemical Vapor Deposition of TungstenDoped Vanadium Dioxide,” Chemistry of Materials, Vol. 16, No. 4, 2004, pp. 744-749. doi:10.1021/cm034905y
- G. Xu, P. Jin, M. Tazawa and K. Yoshimura, “Thickness Dependence of Optical Properties of VO2 Thin Films Epitaxially Grown on Sapphire (0 0 0 1),” Applied Surface Science, Vol. 244, No. 1-4, 2005, pp. 449-452. doi:10.1016/j.apsusc.2004.09.157
- R. Binions, G. Hyett, C. Piccirillo and I. P. Parkin, “Doped and Un-Doped Vanadium Dioxide Thin Films Prepared by Atmospheric Pressure Chemical Vapour Deposition from Vanadyl Acetylacetonate and Tungsten Hexachloride: The Effects of Thickness and Crystallographic Orientation on Thermochromic Properties,” Journal of Materials Chemistry, Vol. 17, No. 44, 2007, pp. 4652-4660. doi:10.1039/b708856f
- W. Burkhardt, T. Christmann, B. K. Meyer, W. Niessner, D. Schalch and A. Scharmann, “Wand F-doped VO2 Films Studied by Photoelectron Spectrometry,” Thin Solid Films, Vol. 345, No. 2, 1999, pp. 229-235. doi:10.1016/S0040-6090(98)01406-0
- I. Takahashi, M. Hibino and T. Kudo, “Thermochromic Properties of Double-Doped VO2 Thin Films Prepared by a Wet Coating Method Using Polyvanadate-Based Sols Containing W and Mo or W and Ti,” Japanese Journal of Applied Physics, Vol. 40, 2001, p. 1391. doi:10.1143/JJAP.40.1391
- D. Barreca, L. E. Depero, E. Franzato, G. A. Rizzi, L. Sangaletti, E. Tondello and U. Vettori, “Vanadyl Precursors Used to Modify the Properties of Vanadium Oxide Thin Films Obtained by Chemical Vapor Deposition,” Journal of The Electrochemical Society, Vol. 146, 1999, p. 551. doi:10.1149/1.1391642
- R. Binions, C. S. Blackman, T. D. Manning, C. Piccirillo and I. P. Parkin, “Thermochromic Coatings for Intelligent Architectural Glazing,” Journal of Nano Research, Vol. 2, 2008, pp. 1-20. doi:10.4028/www.scientific.net/JNanoR.2.1
- D. Vernardou, M. E. Pemble and D. W. Sheel, “Vanadium Oxides Prepared by Liquid Injection MOCVD Using Vanadyl Acetylacetonate,” Surface and Coatings Technology, Vol. 188-189, 2004, pp. 250-254. doi:10.1016/j.surfcoat.2004.08.037
- M. Saeli, C. Piccirillo, I. P. Parkin, I. Ridley and R. Binions, “Nano-Composite Thermochromic Thin Films and Their Application in Energy-Efficient Glazing,” Solar Energy Materials and Solar Cells, Vol. 94, No. 2, 2010, pp. 141-151. doi:10.1016/j.solmat.2009.08.010
- J. A. Clarke, M. Janak and P. Ruyssevelt, “Assessing the Overall Performance of Advanced Glazing Systems,” Solar Energy, Vol. 63, No. 4, 1998, pp. 231-241. doi:10.1016/S0038-092X(98)00034-6
- C. G. Granqvist and V. Wittwer, “Materials for Solar Energy Conversion: An Overview,” Solar Energy Materials and Solar Cells, Vol. 54, No. 1-4, 1998, pp. 39-48. doi:10.1016/S0927-0248(97)00221-3
- J. H. Klems, “Materials for Solar Energy Conversion: An Overview,” Energy and Buildings, Vol. 33, No. 2, 2001, pp. 93-102. doi:10.1016/S0378-7788(00)00069-4
- M. S. Reilly, F. C. Winkelmann, D. K. Arasteh and W. L. Carroll, “Modeling Windows in DOE-2.1E,” Energy and Buildings, Vol. 22, No. 1, 1995, pp. 59-66. doi:10.1016/0378-7788(94)00901-U
- H. Feustel, A. de Almeida and C. Blumstein, “Alternatives to Compressor Cooling in Residences,” Energy and Buildings, Vol. 18, No. 3-4, 1992, pp. 269-286. doi:10.1016/0378-7788(92)90026-D
- P. Nitz and H. Hartwig, “Solar Control with Thermotropic Layers,” Solar Energy, Vol. 79, No. 6, 2005, pp. 573-582. doi:10.1016/j.solener.2004.12.009
- A. Raicu, H. R. Wilson, P. Nitz, W. Platzer, V. Wittwer and E. Jahns, “Facade Systems with Variable Solar Control Using Thermotropic Polymer Blends,” Solar Energy, Vo. 72, No. 1, 2002, pp. 31-42. doi:10.1016/S0038-092X(01)00093-7
- F. Béteille and J. Livage, “Optical Switching in VO2 Thin Films,” Journal of Sol-Gel Science and Technology, Vol. 13, No. 1-3, 1998, pp. 915-921. doi:10.1023/A:1008679408509
- R. Binions, G. Hyett and P. Kiri, “Solid State Thermochromic Materials,” Advanced Materials Letters, Vol. 1, 2010, pp. 86-105.
- W. Burkhardt, T. Christmann, S. Franke, W. Kriegseis, D. Meister, B. K. Meyer, W. Niessner, D. Schalch and A. Scharmann, “Tungsten and Fluorine Co-Doping of VO2 Films,” Thin Solid Films, Vol. 402, No. 1-2, 2002, pp. 226-231. doi:10.1016/S0040-6090(01)01603-0
- C. G. Granqvist, “Transparent Conductors as Solar Energy Materials: A Panoramic Review,” Solar Energy Materials and Solar Cells, Vol. 91, No. 17, 2007, pp. 1529- 1598. doi:10.1016/j.solmat.2007.04.031
- N. Joyeeta and J. R. F. Haglund, “Synthesis of Vanadium Dioxide Thin Films and Nanoparticles,” Journal of Physics: Condensed Matter, Vol. 20, No. 26, 2008, Article ID: 264016. doi:10.1088/0953-8984/20/26/264016
NOTES
*Corresponding author.