Computational Water, Energy, and Environmental Engineering
Vol. 2 No. 2 (2013) , Article ID: 30595 , 5 pages DOI:10.4236/cweee.2013.22006
Production of Hydrogen by Electrolysis of Water: Effects of the Electrolyte Type on the Electrolysis Performances
Higher Institute of Applied Sciences and Technology, University of Gabes, Gabes, Tunisia
Email: benslama_romdhane@yahoo.fr
Copyright © 2013 Romdhane Ben Slama. This is an open access article distributed under the Creative Commons Attribution License, which permits unrestricted use, distribution, and reproduction in any medium, provided the original work is properly cited.
Received November 30, 2012; revised February 15, 2013; accepted February 23, 2013
Keywords: Hydrogen Production; Electrolysis; Electrolyte; Photovoltaic
ABSTRACT
The production of hydrogen, vector of energy, by electrolysis way and by using photovoltaic solar energy can be optimized by suitable choice of electrolytes. Distilled water, usually used, due to membrane presence may be substituted by wastewaters, which enters more in their treatment. Waste water such as those of the Cleansing National Office, and also of the factories such as those referring with ammonia, the margines, and even urines that make it possible to produce much more hydrogen as distilled or salted water, more especially as they do not even require an additive or membranes: conventional electrolysers with two electrodes. This study seeks to optimize the choice among waste water and this, by electrolysis in laboratory or over the sun according to produced hydrogen flow criteria, electrolysis efficiency and electric power consumption. The additive used is NaCl. The most significant results are on the one hand the significant increase in the produced hydrogen flow by the addition of the additive; on the other hand the advantage of gas liquor and urine compared to the others tested electrolytes.
1. Introduction
Water electrolysis has long been known to produce hydrogen. However, for membrane electrolysers, used water must be pure.
We show here that wastewater electrolysis gives the same performance or even better performance, because they contain bacteria that produce hydrogen.
Among wastewater include those of ONAS (municipal wastewater), the margine, ammonia water of ammonia production plants, but water with vinegar and urine deemed rich in nitrogenous matter (ammonia) according to recent research from the University of Ohio in the United States.
Hydrogen production by water electrolysis can be economically viable by using electrical energy from renewable sources such as photovoltaic solar energy [1-4].
Our previous studies have relied on the use of salt water as electrolyte [5-8]. In this article, we will vary the nature of the electrolyte leaning towards wastewater deemed by their richness in bacteria which are the basis for hydrogen production. Human urine will also be also used in reference to the work of Boot [9,10].
2. Experimental Set-Up
• 2.1. Parameters of Calculation
• Hydrogen production flow rate: Qv = V/t With:
• Absorptive power by the electrolyser: Pa = U.I
• Useful power of the electrolyser: Pu = PCI.Q.r With PCI: lower thermal value of hydrogen (119.9106 J/Kg)
ρ: density of hydrogen (0.09 Kg/m3)
• Consumed electric power: W = Pa.t (J)
• Useful efficiency: h = PCI. (V/(Pa.t)).r
• Consumed electric power per unit of volume: W/V = Pa.t/V (J/cm3)
A photovoltaic module with its panel, electrolysers and their electrodes made in various materials, are represented by the following photographs (Figure 1).
2.2. Chemical Characteristics of Waste Water Used
Table 1 represents the characteristics of the waste water used, such as the pH, the resistivity and initial salinity,
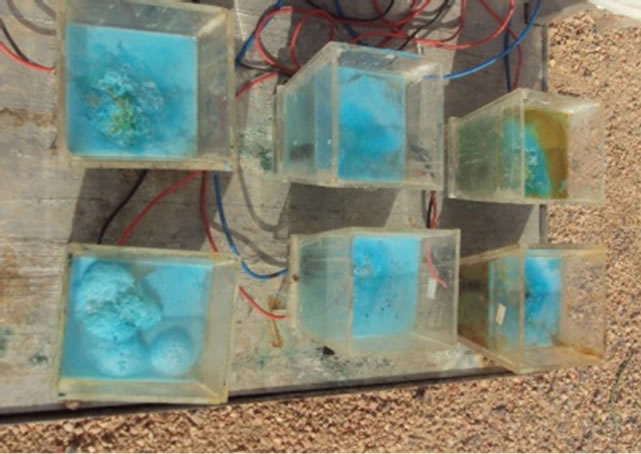
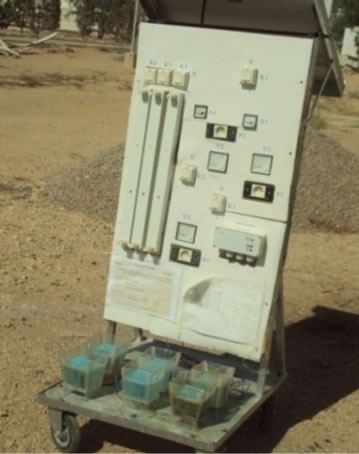

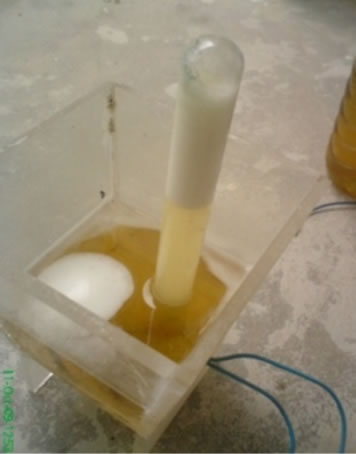
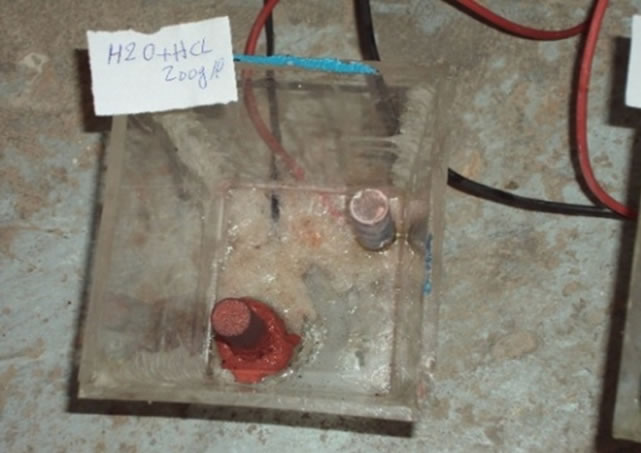

Figure 1. Photographs of the photovoltaic model and the electrolysers with their corroded electrodes.
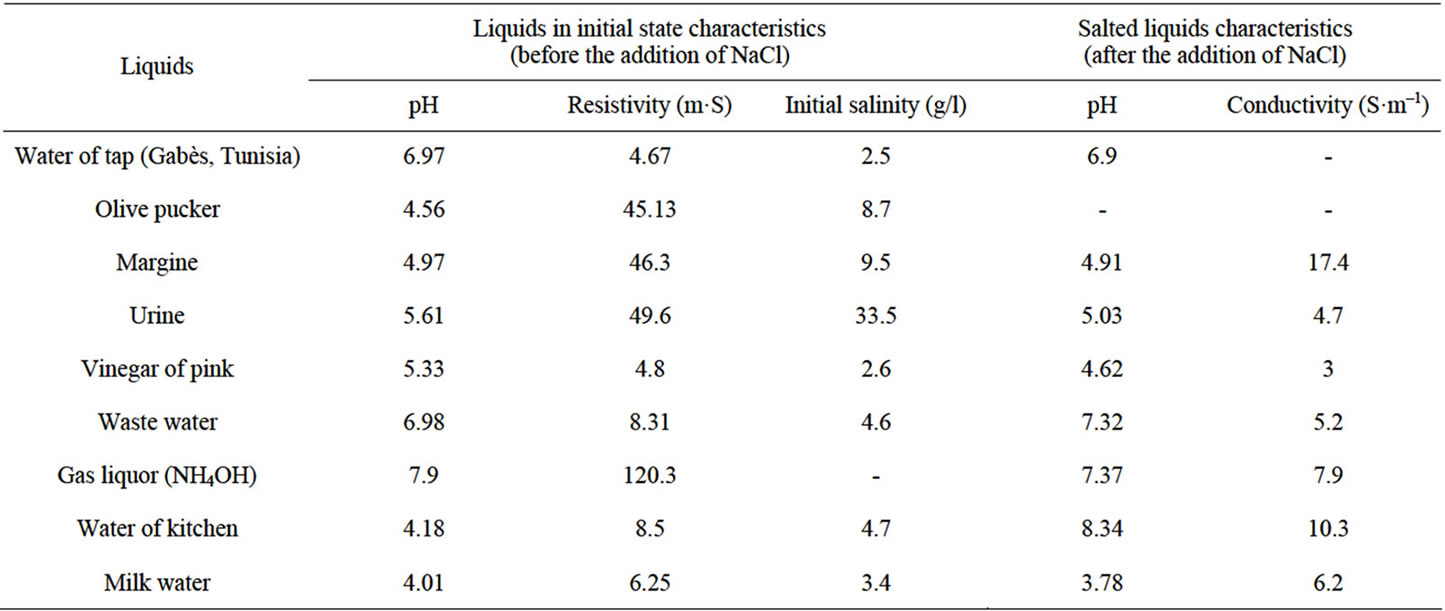
Table 1. Characteristics of the liquids before and after the addition of NaCl.
before and after the sodium chloride addition.
We can notice that the sodium chloride addition has a weak effect on the pH, however the resistivity is strongly reduced.
3. Influence of NaCl Additive on the Electrolysis of Various Waste Water
NaCl is used as additive for handling reasons facility, abundance on the market and low cost.
3.1. First Parameter: Released Hydrogen Flow
These experiments are carried out under a value of 6 V and an ambient temperature of 21˚C.
In the initial state of each liquid (waste water) used, we can notice that the gas liquor and the urine are distinguished because they have release hydrogen flows higher than the other liquids. With the addition of the NaCl additive, all salted liquids will have their hydrogen flow increasing in a significant way. Urine and gas liquor remain among the best as well with as without additive salt.
3.2. Second Parameter: Electric Power Consumed
The electric power is mainly consumed to produce hydrogen. Thus these two parameters are almost proportional according to Figures 2 and 3. However the variation remains enormous between the two configurations with and without additive.
This variation will be reduced in Figures 4 and 5 concerning, respectively, the energetic efficiency and the specific energy consumed for hydrogen production.
The NaCl addition increases the electrolyte conductivity and consequently the current passage and thus the consumed electric power and the produced hydrogen flow and this, whatever the type of electrolyte.
3.3. Third Parameter: Electrolyser Efficiency
The calculated efficiency is proportional to the quotient flow/electric power (Figure 4).
We can only notice a small difference on the results indicated in this Figure 3. In fact, it is noted that the efficiency of the liquids without sodium chloride is larger than that of the liquids with NaCl. This will be explained by the low electric power dissipated for the liquids with-
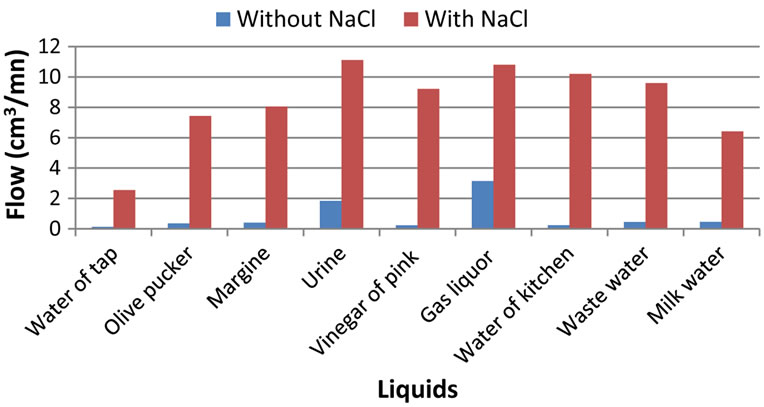
Figure 2. Salinity effect on hydrogen flow produced by electrolyse waste water.
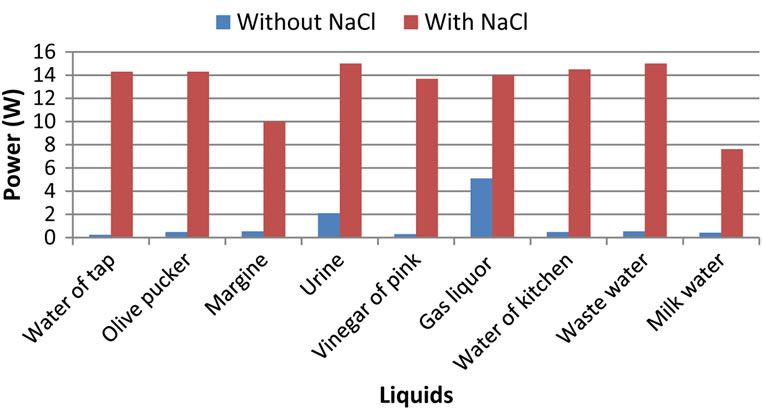
Figure 3. Salinity effect on the electric power consumed to produce hydrogen by waste water electrolysis.
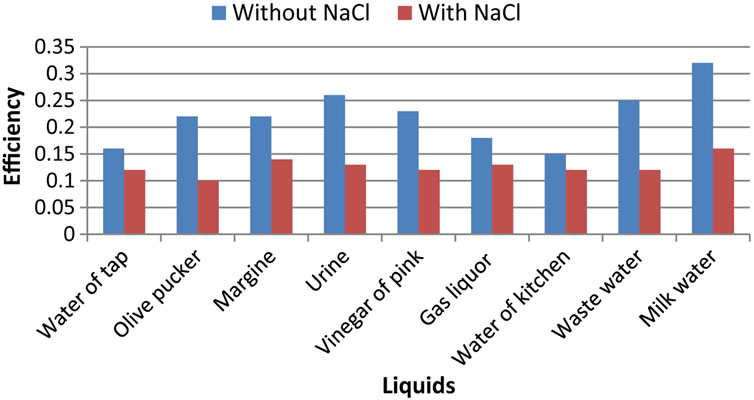
Figure 4. Salinity effect on the produced hydrogen efficiency by waste water electrolyse.
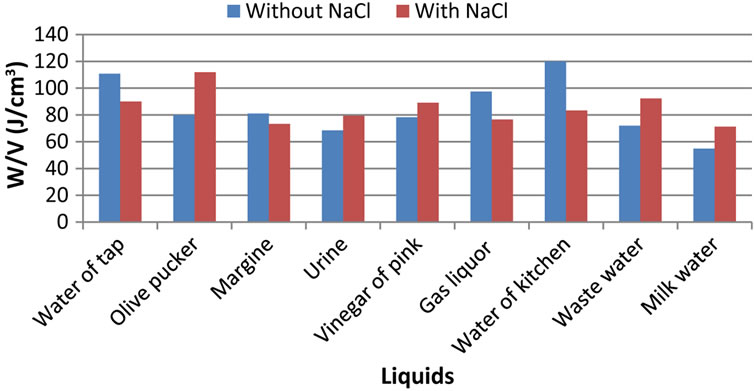
Figure 5. Salinity effect on the consumed specific electric power to produce hydrogen by waste water electrolysis.
out NaCl that for the liquids salted even those which have significant flows.
3.4. Fourth Parameter: Consumed Specific Electric Power
By this measured parameter of consumed specific electric power, we wanted to alleviate the great variations which exist between the two configurations with and without additive, observed in Figures 2 and 3.
If it is true that the addition of NaCl does not have spectacular effect for all the electrolytes as in the case of flow and power consumption, we can however note that the addition of NaCl generates a decrease in the specific energy consumed in the case of the tap water, margine, gas liquor, cooking waste water and an increase in this energy to let us pucker olive, urinates, vinegar of pink, cleansing water and milk water.
4. Optimizing the Choice between Electrolytes, with 200 g/l NaCl
By generating hydrogen by solar water electrolysis, we seeks to maximize the produced hydrogen flow rate Qv and to minimize the specific energy consumption while taking account of the energetic efficiency, so the ratio:
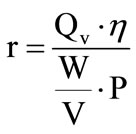
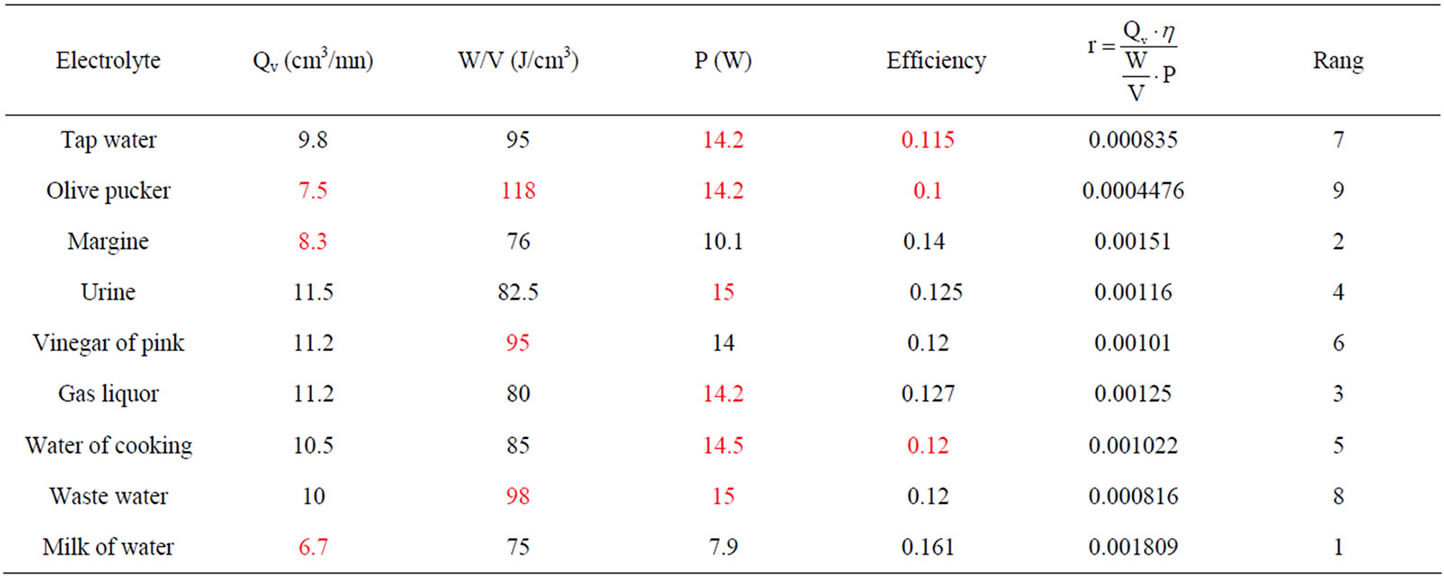
Table 2. Electrolysis performance comparison.
Hence the electrolysis performance comparison chart for different electrolyte containing NaCl at 200 g/l (Table 2).
Tested electrolytes can be classified into five families, in descending order of interest:
• First Family: milk of water, margine
• Second family: gas liquor, urine, water of cooking, vinegar of pink
• Third family: tap water, waste water
• Fourth family: olive pucker Most hydrogen producers electrolytes, while minimizing energy consumption, are based on ammonia.
Their abundance varies: Ammonia is industrially produced, vinegar of pink can be synthesized. As for urine, and feed its human or animal production not requires no worries about its abundance and renewable character, throughout the human life.
5. Interpretation of Results
Various measurements give sometimes conclusions that can appear contradictory as for the interest of the NaCl additive. However, our purpose is to reach the best production flows with less power consumption; it is with the manner of the vehicles that must drive fasr without consuming too much!
Thus while using NaCl like additive, rank first the ammonia water and urine, to the second rank waste water of cooking and from the cleansing water and the margine, finally the water out of the tap and the others.
If theoretical energy to break the water molecule is of 285 kJ/mol or 12.7 J/cm3, our found values are thus high and electrolysis still requires to be optimized for example by reducing the supply voltage by the parallel assembly of the electrolysers on the photovoltaic module.
The tests results over the sun show that the electric power consumed by the electrolyser follows that of the daily sunning; it is the reverse for the efficiency. We observed the same paces of efficiency for the case of the solar water heaters.
6. Conclusions
The addition of NaCl in the electrolytes had activated the electrochemical reactions and produced more hydrogen and this is the goal required in this work.
According to the type of used electrolyte (tap water, margine, gas liquor, waste water from cooking, puckered olive, urine, vinegar of pink, municipal waste water and finally milk water), there is variation of the hydrogen flow rate produced by supplying the electrolysers in electrical current by the photovoltaic module.
As the energetic efficiency does not change often in the same direction as the produced hydrogen flow, it is for that we use also the specific energy consumption parameter “W/V” which can be considered as being the most characteristic parameter in the comparisons between the various types of electrolytes.
REFERENCES
- E. Bilgen, “Solar Hydrogen from Photovoltaic Eletrolizer Systems,” Energy Conversion and Management, Vol. 42, No. 9, 2001, pp. 1047-1057. |doi:10.1016/S0196-8904(00)00131-X
- S. H. Jensen, et al., “Hydrogen and Synthetic Fuel Production from Renewable Energy Sources,” International Journal of Hydrogen Energy, Vol. 32, No. 15, 2007, pp. 3253-3257. doi:10.1016/j.ijhydene.2007.04.042
- P.-H. Floch, et al., “On the Production of Hydrogen via Alkaline Electrolysis during Off-Peak Periods,” International Journal of Hydrogen Energy, Vol. 32, No. 18, 2007, pp. 4641-4647. doi:10.1016/j.ijhydene.2007.07.033
- L. Solera, J. Macanása, M. Muñoza and J. Casado, “Electrocatalytic Production of Hydrogen Boosted by Organic Pollutants and Visible Light,” International Journal of Hydrogen Energy, Vol. 31, No. 1, 2006, pp. 129-139. doi:10.1016/j.ijhydene.2004.11.001
- R. Ben Slama, “Production of Hydrogen by Electrolyse of Water and Photovoltaic Energy,” Proceeding of the 3rd International Congress on Renewable Energies and Environment CERE, Tunis, 6-8 November 2006.
- R. Ben Slama, “Tests on the Solar Hydrogen Production by Water Electrolysis,” Proceeding of the JITH, Albi, 28-30 August 2007.
- R. Ben Slama, “Solar Hydrogen Generation by Water Electrolysis,” Proceeding of the First Francophone Conference on Hydrogen: Energy Vector, Sousse, 9-11 May 2008.
- R. Ben Slama, “Génération d’Hydrogène par Electrolyse Solaire de l’eau,” Proceeding des Journées Annuelles 2008 Société Française de Métallurgie et de Matériaux, Paris, 4-6 June 2008.
- M. Cooper and G. G. Botte, “Hydrogen Production from the Electro-Oxidation of Ammonia Catalyzed by Platinum and Rhodium on Raney Nickel Substrate,” Journal of the Electrochemical Society, Vol. 153, No. 10, pp. A1894-A1901.
- F. Vitse, M. Cooper and G. G. Botte, “On the Use of Ammonia Electrolysis for Hydrogen Production,” Journal of Power Sources, Vol. 142, No. 1-2, 2005, pp. 18-26. doi:10.1016/j.jpowsour.2004.09.043
Nomenclature
I Electrical current (A)
U Voltage (V)
P Power (W)
PCI Lower heating value (J/kg)
Q Flow rate (m3/s)
V Volume of the test tube (m3)
t Tube filling time (s)
W Electrical energy (J)
r Density of hydrogen (Kg/m3)
Indices
a Absorbed
u Useful