Pharmacology & Pharmacy
Vol.3 No.3(2012), Article ID:20645,6 pages DOI:10.4236/pp.2012.33036
Gold Nanoparticles/Carbon Nanotubes Composite Film Modified Glassy Carbon Electrode Determination of Meclofenoxate Hydrochloride
![]()
1School of Pharmacy, Guangdong Pharmaceutical University, Guangzhou, China; 2School of Chemistry and Environment, South China Normal University, Guangzhou, China.
Email: likang229@yahoo.com.cn
Received April 10th, 2012; revised May 31st, 2012; accepted June 11th, 2012
Keywords: Meclofenoxate Hydrochloride; SWNTs; Gold Nanoparticles; Square Wave Voltammetry
ABSTRACT
A novel voltammetric sensor based on gold nanoparticles (GNPs) and single-walled carbon nanotubes (SWNTs) composite was developed. The nanocomposite modified electrode was characterized using atoms force microscope (AFM). The electrochemical behavior of meclofenoxate hydrochloride (MFX) was investigated on this sensor. The results indicated that the GNPs/SWNTs modified electrode exhibited efficient electrocatalytic oxidation for MFX with relatively high sensitivity, and stability. Using square wave voltammetry (SWV), the GNPs/SWNTs modified electrode exhibited a linear voltammetric response for MFX in the concentration range of 5.0 × 10⁻⁷ - 2.0 × 10⁻⁵ mol·L–1, with the limit of detection (LOD) of 1.0 × 10⁻⁷ mol·L–1. The sensor was applied to determine MFX in finished drug with a satisfactory result.
1. Introduction
Meclofenoxate hydrochloride (MFX), 4-chlorophenoxyacetic acid 2-(dimethylamino) ethyl ester hydrochloride (Figure 1), belongs to the group of psychostimulantsnootropic agents [1,2]. It has been used for the following off-label conditions: senile dementia, skull and brain trauma, urinary incontinence after stroke; encephalopathy; mental disorders (in combination with psychotropic agents); and tardive dyskinesia [3]. In the interest of using MFX securely, scientifically and getting better curative effect, it is important to develop a simple, rapid, and sensitive method for the determination of MFX. Compared with other methods, such as high performance liquid chromatography [4], protonmagnetic resonance spectroscopy [5], and flow injection [6], the electrochemical technique exhibits its predominance such as rapid response, simple operation, time saving, and low-cost. To our knowledge, there has been no report regarding the voltammetric determination of MFX so far. More inadequate, the pharmacological action of MFX is not observed using these methods. Electrochemical methods also help for identifying the redox of compounds and provide important information about pharmacological actions.
As all we know, carbon nanotubes (CNTs) are unique one-dimensional materials with special electronic properties and have been widely used in analytical chemistry. This tendency is well manifested by several recently published excellent reviews [7,8]. To optimize the use of CNTs in various applications, it is necessary to attach functional groups or other nanoparticles materials onto their surfaces [9]. The combination of CNTs with other nanomaterials is expected to be useful for catalysis, or making sensors. On the other hand, gold nanoparticles (GNPs) have advantages such as narrow size distribution, efficient surface modification, and desirable biocompatibility. It has been widely used in analytical chemistry for many years [10,11]. Although the electrocatalytic activity of CNTs and GNPs films show good results individually, some of the biochemical compounds do not undergo electrocatalysis. To overcome this difficulty, new studies
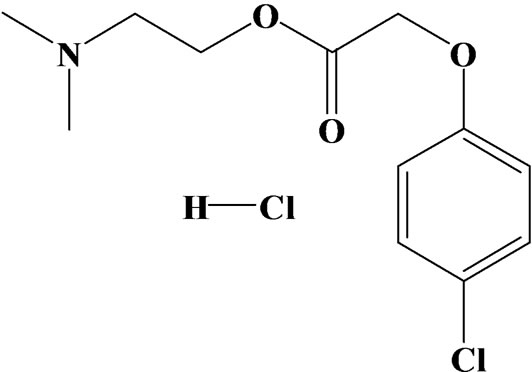
Figure 1. Chemical structure of Meclofenoxate Hydrochloride (MFX).
have been carried out for preparing composite films that consisted of both CNTs and GNPs [13]. However, the electrocatalytic activity of this catalyst is usually cast on the surface of the electrode [14], which will lead to more or less subjective factors. In this paper, we present a convenient and practical route for preparing GNPs and single wall carbon nanotubes (SWNTs) nanocomposite modifiled glassy carbon electrode (GNPs/SWNTs/GCE) by deposition techniques. The electrochemical behaviors of MFX were investigated on the modified electrode. The main objective of this study is to investigate the oxidation mechanism of MFX by cyclic voltammetry and determination of this compound in pharmaceutical dosage forms using square wave voltammetry technique. The method has been applied to determining MFX in the real sample.
2. Experimental
2.1. Materials and Reagents
Single wall carbon nanotubes (SWNTs, purity > 95%) was obtained from Chengdu Institute of Organic Chemistry, Chinese Academy of Sciences. Hydrogen tetrachloroaurate hydrate (HAuCl4·3H2O) was purchased from Alfa Aesar China Co., Ltd. (Tianjin, China). Stock solution (1.0 × 10⁻³ mol·L–1) of MFX (Beijing Chemical Reagent, China) was prepared in normal saline, and stored at 4˚C. Britton-Robinson (B-R) buffer solution (0.1 mol·L–1, pH 4.0) was selected as supporting electrolyte solution. All other reagents were of analytical grade and used without further purification. All solutions were made up with ultrapure water (18.2 MΩ, Simplicity Plus, Millipore Corp, US). The capsule and tablet were obtained in a local medicamentarius. For the practical application, five MFX capsules and tablets were weighed accurately and finely pulverized in an agate mortar. A certain amount of the powder was weighed and dissolved in normal saline with the help of sonication. After centrifugation and filtration, the clear filtrate was collected into a 100 mL volumetric flask and diluted to volume with normal saline.
2.2. Instrumentations
All the electrochemical measurements were performed on a CHI 660B electrochemical working station (CH Instrument, Shanghai, China). The three-electrode system consisted of a modified glassy carbon electrode or a bare glassy carbon electrode as a working electrode, a platinum electrode and a Ag/AgCl electrode were used as the auxiliary and reference electrodes, respectively. An atomic force microscope (Agilent 5500, Agilent Technologies, US) was used to characterize the morphology of modifiled electrode. The high-performance liquid chromatography (HPLC, LC-10AT, Shimadzu, Kyoto, Japan) equipped with a C18 reverse phase column (5 µm, 4.6 × 250 mm) and an injection volume of 25 μL was employed as a comparative technique to test the correctness of the square wave voltammetry. All experiments were carried out at room temperature (25˚C ± 2˚C).
2.3. Preparation of GNPs/SWNTs/GCE
For the preparation of a GNPs/SWNTs/GCE, SWNTs (2 mg) was added into a 10 mL of 0.1% (wt%) SDS solution in an ultrasonic bath to prepare an aqueous suspendsion of SWNTs with of 0.2 mg·mL–1 (1%, w/v) and dispersed for 30 min under ultrasound. Before modification, a bare glassy carbon electrode (GCE, 3.0 mm in diameter) was polished with 0.3 µm and 0.05 µm alumina slurry sequentially and then washed ultrasonically in ethanol and then water for 5 minutes, respectively. After rinsing, the electrode was electrochemically pretreated by cyclic potential scanning between ±1.0 V in 0.02 mol·L–1 H2SO4 until stable cyclic voltammogram curve was obtained. Afterwards, the electrode was immersed in the aqueous suspension and connected as the positive pole whereas a platinum electrode was used as the negative pole. A potential of 10 V was applied for 30s electrophoretic accumulation of SWNTs [15]. After that, it could be seen the GCE was covered with a blue-color thin film. The electrode was named as SWNTs/GCE.
After the electrode was dried, the SWNTs/GCE was immersed in HAuCl4 solution (1 × 10⁻³ mol·L–1). A multi-potential steps was employed for the direct electrodeposition of metal particles. In a first series of experiments, a pulse potential profile of 200 mV (500 ms) ~ –1200 mV (100 ms) ~200 mV (500 ms) (vs. Ag/AgCl) was applied and 30 pulses were used for each deposition [15]. At the end of process, the modified electrode was thoroughly washed with pure water. It was observed that the SWNTs/GCE was covered with a dark red thin film.
3. Results and Discussion
3.1. Morphology of the Multilayer Films
Direct morphological observation of the as-prepared SWNTs/GCE and GNPs/SWNTs/GCE was obtained using an atomic force microscope (AFM). The typical contact mode AFM images for the GNPs are shown in Figure 2. It can be seen that uniformly coated the electrode surface (Figure 2(a)). The homogeneity of the dispersed SWNTs adsorbed on the electrode surface. It may be the SWNTs deposited onto the electrode surface by means of electrophoretic accumulation [16]. Compared with the AFM image of the SWNTs/GCE, the AFM picture of GNPs/SWNTs/GCE (Figure 2(b)) showed an obviously dots grow on the SWNTs. In addition, the special surface morphology offered the GNPs/SWNTs/GCE a much larger real surface area than that of the apparent geometric area.
3.2. Cyclic Voltammograms Behaviour of MFX
The electrochemical behavior of MFX at the bare GCE and GNPs/SWNTs/GCE was investigated in 0.1 mol·L–1 B-R (pH 4.0) using cyclic voltammetry, and the result was shown in Figure 3. It is clear that no redox peak was observed at the bare GCE (curve a). Figure 3(b) is a CV curve of GNPs/SWNTs/GCE in a blank solution, no peaks were observed in blank solution (curve b). When MFX was added into blank solution (curve c), a well defined oxidation peak was observed at the modified electrode with the oxidation potential at 0.952 V. No corresponding reduction peak was observed at the reverse scan, indicating that the electrochemical oxidation of MFX was a totally irreversi le reaction at the GNPs/ SWNTs/GCE under the above experimental conditions. This phenomenon should be attributed to the immobilized GNPs and SWNTs, which can catalyze the oxidation of MFX.
3.3. Oxidation Mechanism of MFX
To infer more about the reaction process of MFX on GNPs/SWNTs/GCE, the effect of the scan rate (v) on the peak currents was studied. Figure 4 shows CV curves with scan rates of 50, 100, 200, 300, 400, and 500 mV·s–1, respectively. The oxidation peak current increased gradually with the increase of scan rate. As shown in Figure 4 insert, the oxidation peak current increased linearly with the square root of scan rate in the range of 50 - 500 mV·s–1 and can be expressed as: Ipa (µA) = –7.155 v1/2 (mV·s–1) – 0.753 (R = 0.998), which indicated that the oxidation of MFX on GNPs/SWNTs/GCE was a typical diffusion-controlled process [17]. Based on the equation: Ip = nFQv/4RT, where n is the number of electrons transferred, F (C·mol–1) is the Faraday’s constant, Q (C) is the quantity of charge and v (V·s–1) is the scan rate. The value of n was estimated to be 2.06, which suggested that a total of two electrons were involved in the oxidation reaction.
The effect of pH on the current response of MFX on the GNPs/SWNTs/GCE was studied in the pH range from 3.0 to 6.0. As shown in Figure 5(a), the oxidation peak current gradually increased with the increase of pH value from 3.0 to 4.0. However, when the pH was further increased to 4.0, the oxidation peak current conversely decreased. Therefore, considering the sensitivity of MFX determination, a pH value of 4.0 was chosen for the subsequent analytical experiments.
The relationship between the oxidation peak potential (Epa) and pH was shown in Figure 5(b). A linear shift of Epa towards negative potential with an increasing pH indicated that protons were directly involved in the oxidation of MFX. It obeyed the following equation: Epa(V) = –0.059 pH + 1.18 (R = 0.996). The slope is approximately close to the theoretical value of 57.6 mV·pH–1, indicating that the electron transfer was accompanied by an equal number of protons in electrode reaction [18]. Thus, it may conclude that the electrode reaction of MFX was accompanied by two proton and two electrons.
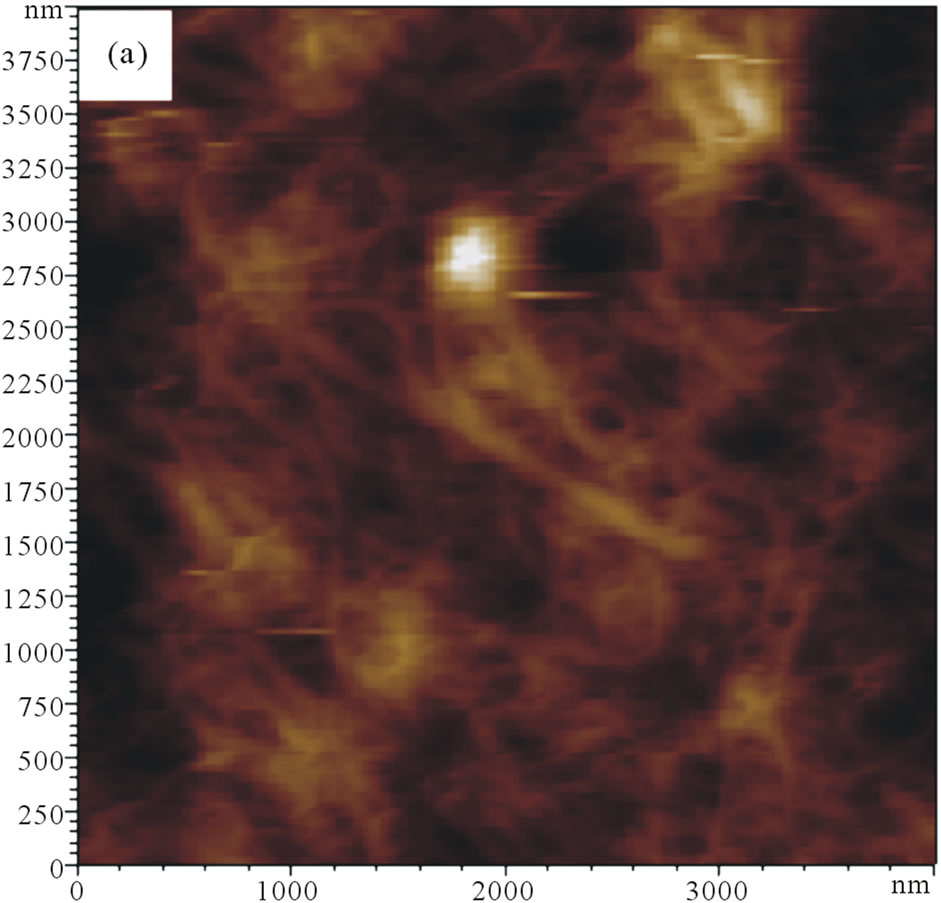
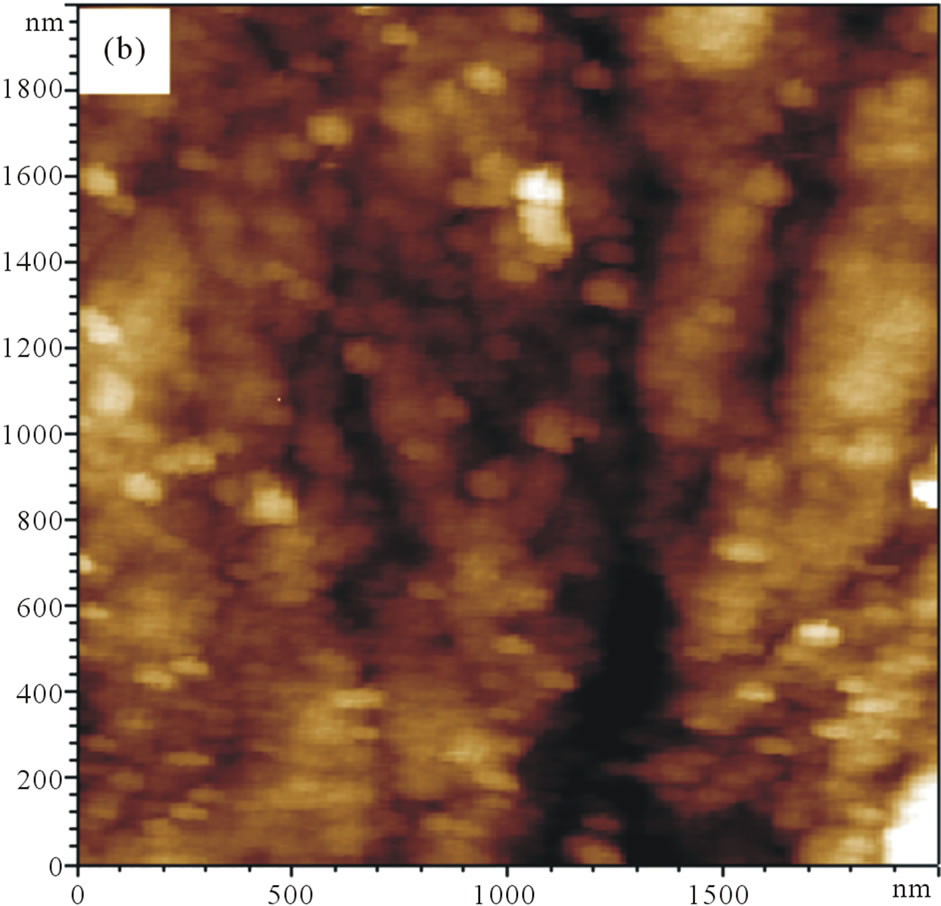
Figure 2. AFM 2D topography images. (a) SWNTs/GCE; (b) GNPs/SWNTs/GCE.
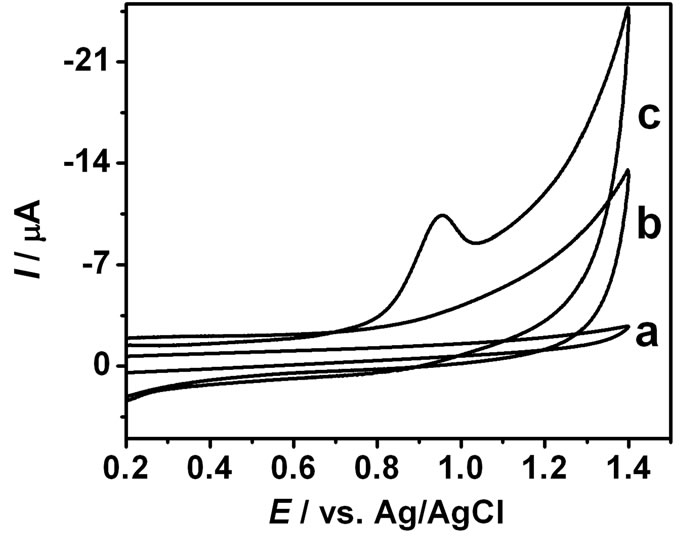
Figure 3. Cyclic voltammograms of 1.0 × 10⁻⁵ mol·L–1 MFX at GCE (a), GNPs/SWNTs/GCE (c), GNPs/SWNTs/GCE (b) in 0.1 M B-R (pH 4.0). Scan rate: 50 mV·s–1.

Figure 4. Cyclic voltammograms of MFX (1.0 × 10⁻⁵ mol·L–1) at different scan rates. Scan rates (curve 1 - 6): 50, 100, 200, 300, 400, 500 mV·s–1. Other conditions same as in Figure 3. The insert is the Ip-v1/2 relation.
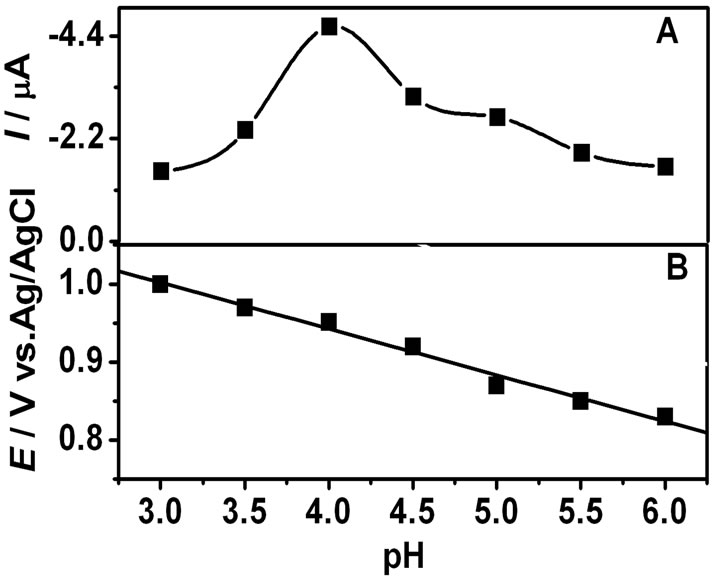
Figure 5. Effect of pH on the oxidation current (A) and oxidation potential (B). Other conditions same as in Figure 3.
3.4. Influence of Accumulation Time and Potential
In consideration of the detection sensitivity and adsorption of MFX on the GNPs/SWNTs/GCE surface, square wave voltammetry technique, coupled with accumulation procedure, was adopted for researching the analytical method. For a MFX solution (1.0 × 10⁻⁵ mol·L–1), the peak currents increased with increasing accumulation time, and it reached a maximum value when accumulation time was 200 s. After investigation, accumulation potential had little effect on peak currents, so accumulation of MFX was carried out under open circuit for further studies.
3.5. Calibration Curve
Square wave voltammetry was used to investigate the relationship between peak currents and MFX concentrations under the optimized conditions. The results (Figure 6) exhibited a linear relationship between peak currents (Ipa) and MFX concentrations within the range from 5.0 × 10⁻⁷ to 2.0 × 10⁻⁵ mol·L–1, which can be described by the following linear regression equation: Ip(µA) = 0.846 c (10–6 mol·L–1) + 0.582, with a correlation coefficient of 0.996. Based on the signal-to-noise ratio of 3, the detection limit was obtained as 1.0 × 10⁻⁷ mol·L–1.
3.6. Stability and Reproducibility and Selectivity
The successive stability of the proposed sensor was evaluated. Ten successive scans in the solution containing 1.0 × 10⁻⁵ mol·L–1 MFX were performed. The relative standard deviation values was found to be 2.52%, indicating excellent stability of the modified electrode. Moreover, after the modified electrode was stored for one week, only a small decrease of the oxidation peak current was observed, demonstrating that the electrode had good stability. Under the optimized experimental conditions described above, the effects of some foreign species on the determination of MFX at the 1.0 × 10⁻⁵ mol·L–1 level were evaluated thoroughly; 200-fold concentration of Al3+, Fe3+, Fe2+, Mg2+, Zn2+, Pb2+, Ca2+, 100-fold of ascorbic acid, dextrin, glucose and sucrose
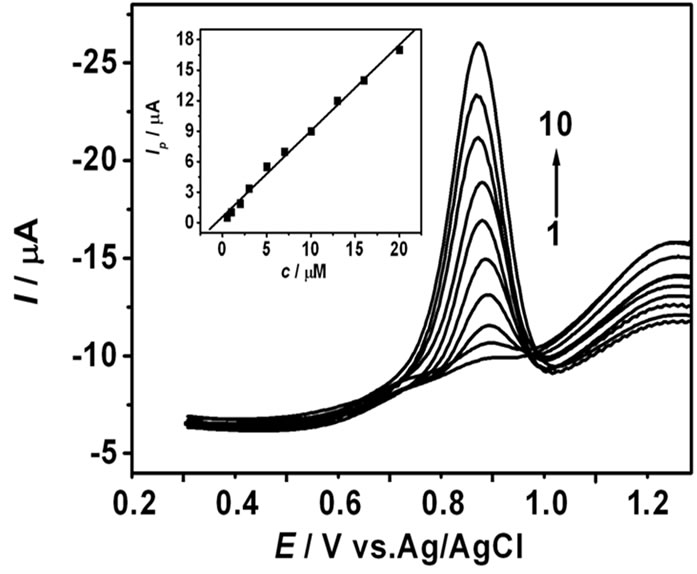
Figure 6. SWV of different MFX concentrations. MFX concentrations (from 1 to 10): 5.0 × 10⁻⁷, 1.0 × 10⁻⁶, 2.0 × 10⁻⁶, 3.0 × 10⁻⁶, 5.0 × 10⁻⁶, 7.0 × 10⁻⁶, 1.0 × 10⁻⁵, 1.3 × 10⁻⁵, 1.6 × 10⁻⁵, 2.0 × 10⁻⁵ mol·L–1. The insert is Linear dependence of the peak current on MFX concentration.
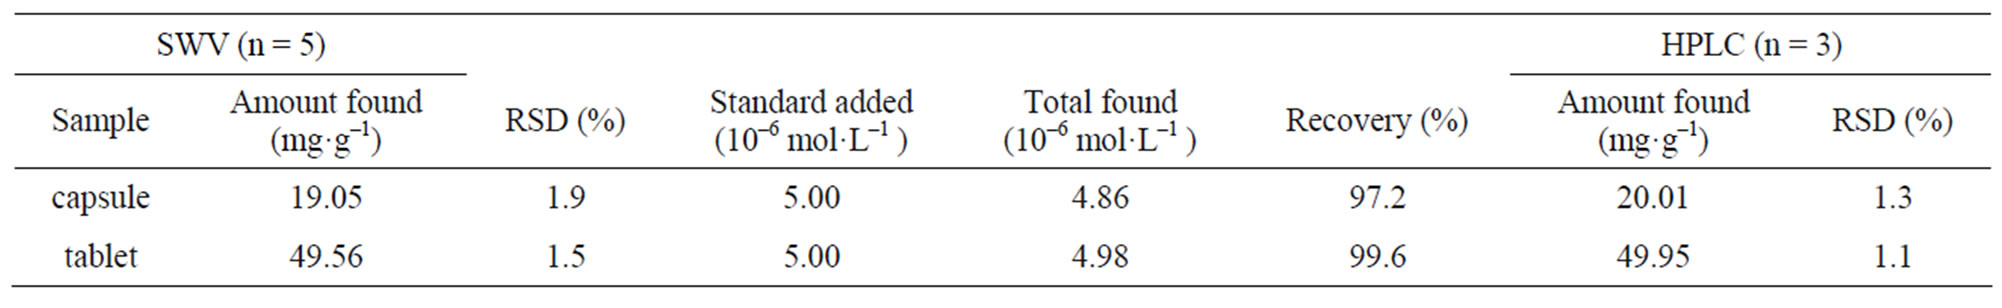
Table 1. Determination results of MFX in capsule and tablet.
had almost no influence on the current response of MFX (signal change below 5%). All of these results indicated that the present method had good selectivity for the determination of MFX.
3.7. Analysis of MFX in the Capsule and Tablet
The GNPs/SWNTs/GCE was used to determine the MFX concentrations in capsule and tablet. The results were shown in Table 1. Meanwhile, HPLC was also used to detect MFX to testify the accuracy of the proposed method. The results obtained by the GNPs/SWNTs/GCE were in good agreement with the HPLC method (Table 1). The detected results obtained from the two methods were compared using t test under 95% confidence levels. Furthermore, in order to establish the applicability of the proposed method, known amounts of the standard MFX were added into the analytical solution, and the same analysis procedure was carried out. The recoveries indicated that the accuracy of the proposed method was acceptable. From the experimental results, it was obvious that this novel GNPs/SWNTs/GCE had great potential for practical sample analysis.
4. Conclusion
In summary, an electrochemical sensor based on GNPs/ SWNTs modifiled electrode was prepared for the detection of trace amounts of MFX. The sensor exhibited good sensitivity of MFX with the detection limit of 1.0 × 10⁻⁷ mol·L–1 by square wave voltammetry under accumulation time of 200 s. The proposed method was further applied for the detection of MFX in real sample with satisfactory results. More importantly, the oxidation reaction of MFX was accompanied by two proton and two electrons, which could provide a valuable reference for the pharmacological action of MFX in clinical study.
5. Acknowledgements
This work was supported by the National Natural Science Foundation of China (30801515).
REFERENCES
- J. L. Gedye, A. N. Exton-Smith and J. Wedgwoo, “A Method for Measuring Mental Performance in the Elderly and Its Use in a Pilot Clinical Trial of Meclofenoxate in Organic Dementia (Preliminary Communication),” Age and Ageing, Vol. 1, No. 2, 1972, pp. 74-80. doi:10.1093/ageing/1.2.74
- H. A. Zuhair, A. A. Fattah and M. I. Sayed, “The Effect of Meclofenoxate with Ginkgo Biloba Extract or Zinc on Lipid Peroxide, Some Free Radical Scavengers and the Cardiovascular System of Aged Rats,” Pharmacological Research, Vol. 38, No. 1, 1998, pp. 65-72. doi:10.1006/phrs.1998.0333
- J. J. Zou, H. J. Ji, D. W. Wu, J. Yao, Q. Hu, D. W. Xiao and G. J. Wang, “Bioequivalence and Pharmacokinetic Comparison of A Single 200-mg Dose of Meclofenoxate Hydrochloride Capsule and Tablet Formulations in Healthy Chinese Adult Male Volunteers: A Randomized Sequence, Open-Label, Two-Period Crossover Study,” Clinical Therapeutics, Vol. 30, 2008, p. 1651. doi:10.1016/j.clinthera.2008.09.013
- B. Ni, J. R. Zhang, J. J. Zou, W. Zhao and J. H. Li, “A Simple and Sensitive HPLC Method For Quantification of the Metabolin of Meclofenoxate In Human Plasma,” Journal of Chromatographic Science, Vol. 48, 2010, p. 353.
- I. Shoukrallah, A. Sakla and B. Paletta, “Quantitative Determination of Some Pharmaceuticals in Bulk Drugs and Tablets by Proton Magnetic Resonance (PMR) Spectroscopy,” IF Farmaco, Vol. 45, 1990, p. 55.
- X. L. Hu, D. P. Xu, S. P. Liu, Z. F. Liu, C. X. Li and P. L. Chen, “Determination of Meclofenoxate Hydrochloride by Resonance Rayleigh Scattering Method Coupled with Flow Injection Technique,” Analytical Letters, Vol. 43, No. 13, 2010, pp. 2125-2133. doi:10.1080/00032711003698820
- D. L. Giokas, A. G. Vlessidis, G. Z. Tsogas and N. P. Evmiridis, “Nanoparticle-Assisted Chemiluminescence and Its Applications in Analytical Chemistry,” TrAC Trends in Analytical Chemistry, Vol. 29, No. 10, 2010, pp. 1113-1126. doi:10.1016/j.trac.2010.07.001
- J. Wang, “Carbon-Nanotube Based Electrochemical Biosensors: A Review,” Electroanalysis, Vol. 17, No. 1, 2005, pp. 7-14. doi:10.1002/elan.200403113
- M. Tominaga, T. Shimazoe, M. Nagashima and I. Taniguchi, “Electrocatalytic Oxidation of Glucose at Gold Nanoparticle-Modified Carbon Electrodes in Alkaline and Neutral Solutions,” Electrochemistry Communications, Vol. 7, No. 2, 2005, pp. 189-193. doi:10.1016/j.elecom.2004.12.006
- M. C. Daniel and D. Astruc, “Gold Nanoparticles: Assembly, Supramolecular Chemistry, Quantum-Size-Related Properties, and Applications toward Biology, Catalysis, and Nanotechnology,” Chemical Review, Vol. 104, No. 1, 2004, pp. 293-346. doi:10.1021/cr030698+
- X. D. Cao, Y. K. Ye and S. Q. Liu, “Gold NanoparticleBased Signal Amplification for Biosensing,” Analytical Biochemistry, Vol. 417, No. 1, 2011, pp. 1-16. doi:10.1016/j.ab.2011.05.027
- U. Yogeswaran, S. Thiagarajan and S. M. Chen, “Nanocomposite of Functionalized Multiwall Carbon Nanotubes with Nafion, Nano Platinum, and Nano Gold Biosensing Film for Simultaneous Determination of Ascorbic Acid, Epinephrine, and Uric Acid,” Analytical Biochemistry, Vol. 365, No. 1, 2007, pp. 122-131. doi:10.1016/j.ab.2007.02.034
- J. C. Abbar, S. J. Malode and S. T. Nandibewoor, “Electrochemical Determination of a Hemorheologic Drug, Pentoxifylline at a Multi-Walled Carbon Nanotube Paste Electrode,” Bioelectrochemistry, Vol. 83, 2012, pp. 1-7. doi:10.1016/j.bioelechem.2011.06.008
- X. X. Chen, K. Eckhard, M. Zhou, M. Bron and W. Schuhmann, “Electrocatalytic Activity of Spots of Electrodeposited Noble-Metal Catalysts on Carbon Nanotubes Modified Glassy Carbon,” Analytical Chemistry, Vol. 81, No. 18, 2009, pp. 7597-7603. doi:10.1021/ac900937k
- F. Valentini, G. Palleschi and E. L. Morales, “Functionalized Single-Walled Carbon Nanotubes Modified Microsensors for the Selective Response of Epinephrine in Presence of Ascorbic Acid,” Electroanalysis, Vol. 19, No. 7-8, 2007, pp. 859-869. doi:10.1002/elan.200603788
- R. Joseph and K. G. Kumar, “Electrochemical Sensing of Acyclovir at a Gold Electrode Modified with 2-Mercaptobenzothiazole-[5,10,15,20-tetrakis-(3-methoxy-4-hydroxyphenyl)porphyrinato] Copper(II),” Analytical Sciences, Vol. 27, 2011, p. 67. doi:10.2116/analsci.27.67
- M. Y. Xi, Y. Y. Duan, X, Li, L. N. Qu, W. Sun and K. Jiao, “Carbon Electrode Modified with Ionic Liquid and Multi-Walled Carbon Nanotubes for Voltammetric Sensing of Adenine,” Microchimica Acta, Vol. 170, No. 1-2, 2010, pp. 53-58. doi:10.1007/s00604-010-0371-8
- T. Luckza, “Preparation and Characterization of the Dopamine Film Electrochemically Deposited on a Gold Template and Its Applications for Dopamine Sensing in Aqueous Solution,” Electrochimica Acta, Vol. 53, No. 19, 2008, pp. 5725-5731. doi:10.1016/j.electacta.2008.03.052