American Journal of Climate Change
Vol.3 No.2(2014), Article
ID:47076,8
pages
DOI:10.4236/ajcc.2014.32013
Impact of Climate Change and Variability on Wheat and Corn Production in Buenos Aires, Argentina
Maria Pol, Jacqueline Binyamin*
Department of Geography, University of Winnipeg, Winnipeg, Canada
Email: *J.binyamin@uwinnipeg.ca
Copyright © 2014 by authors and Scientific Research Publishing Inc.
This work is licensed under the Creative Commons Attribution International License (CC BY).
http://creativecommons.org/licenses/by/4.0/


Received 10 January 2014; revised 8 February 2014; accepted 1 March 2014
ABSTRACT
From the Global Historical Climate Network (GHCN-V3), monthly mean summer (DJF) temperature (1856-2012) and total precipitation (1861-2012) are analyzed in correlation with four climate modes and sunspot number to better understand the role of teleconnections on Buenos Aires’ (Argentina) climate. A general increase in temperature and precipitation was observed. Temperature has increased by about 1.8˚C and precipitation has increased by about 300 mm in the past century and a half. Indices of Arctic Oscillation (AO), Pacific North American (PNA), Antarctic Oscillation (AAO), and El Niño-Southern Oscillation (ENSO) are evaluated to study their effects on wheat and corn production and export. AO and PNA show strong relationships with precipitation and temperature received. AAO and ENSO show strong negative correlations with precipitation patterns and weak correlations with temperature. Sunspot Number shows a positive correlation with temperature. ENSO phases are strongly linked with the wheat and corn production and export; during El Niño Buenos Aires tends to experience extremely wet summer weather, causing soggy fields and extremely dry summer weather during La Niña causing drought. Both of these conditions result in reducing wheat and corn production and export.
Keywords:Climate Change of Buenos Aires, Teleconnections, PNA, AO, Sunspot Number, AAO, ENSO, Wheat, Corn Production and Export

1. Introduction
Buenos Aires, Argentina is located at 34.6˚ south latitude and at 58.5˚ west longitude. The station is 25 m above sea level and located at the Buenos Aires’ International Airport, 30 km from the Atlantic Ocean and 9 km from the urban center. Because of its location in the southern hemisphere, Buenos Aires’s seasons are opposite of those from the northern hemisphere; summer is in December, January and February (DJF), winter is during June, July and August (JJA), spring is in September, October and November (SON) and autumn is during the months of March, April and May (MAM). Monthly average temperature and total precipitation data for Buenos Aires are obtained from the Global Historical Climate Network (GHCN-V3).
Buenos Aires’ average annual summer temperature is 23˚C for the period of 1856-2012. Due to its proximity to the South Atlantic Ocean, the average annual temperature fluctuates very little. The summer temperature ranges from approximately a high of 25.3˚C to a low of 21˚C. The winter temperature ranges from approximately a high of 13.3˚C to a low of 6.3˚C. Summer average precipitation is about 283 mm. The distribution shows seasonal periods of intense low to high precipitation amounts. The period of intense precipitation is during the autumn months with a total average of 299 mm, while it receives low amounts of precipitation in the winter months with a total average of 184 mm. Precipitation in the summer months supports farming production and failure of precipitation leads to devastating economic losses [1] [2] . Wheat and corn are two of the major crops that Buenos Aires produces and exports. The climate of Argentina is very sensitive to the ENSO phases, especially with the amount precipitation received, largely contributing to a summer drought during a La Niña year, and a summer flood during El Niño [2] .
This paper examines the effect of four teleconnections and sunspot number on the summer temperature and precipitation of Buenos Aires. The teleconnections include: Arctic Oscillation (AO), Pacific North American Oscillation (PNA), Antarctic Oscillation (AAO), and El Niño-Southern Oscillation (ENSO). AO is distinguished by pressure changes between the Arctic Polar Regions and areas south of the North Pole causing changes in upper-level zonal winds [3] . In the positive phase of AO, the strong low pressure system in the Arctic keeps the cold air north and in the negative phase of AO; the weak low pressure system in the Arctic keeps the cold air south.
The PNA relates to the atmospheric circulation pattern over the North Pacific Ocean and over the North American continent mostly affecting North American climate. The PNA index deals with the average of the standardized monthly 700 mb height anomalies for Hawaii, the Aleutian Islands, southeastern United States and over the Intermontagne region of North America.
The AAO is measured by the Antarctic Oscillation Index, which is the difference in pressure between 40˚S and 65˚S. AAO affects the areas between 20˚S to 90˚S and has a strong effect on the location of the midlatitude jet stream affecting areas in the southern hemisphere [4] . Just like in the Northern hemisphere, there is an opposition between the Azores high and the high pressure belt over Argentina, where a lack of southern data hindered the research for more oscillations [4] [5] . The positive phase of AAO consists of the southern hemisphere tropical jet stream moving south, causing warm and dry conditions in the lower latitudes closer to the equator and cold and wet in the higher latitudes closer to the South pole. The negative phase of AAO is the opposite.
ENSO is a large-scale interaction between the ocean and the atmosphere. It is measured using the Southern Oscillation Index (SOI) where large negative SOI values represent El Niño, ocean warming, and large SOI positive values represent La Niña, ocean cooling [6] [7] . SOI is calculated by the pressure differences between Tahiti and Darwin. ENSO affects South America by mimicking the Peruvian conditions into Buenos Aires from the Pacific to the Atlantic Ocean coast [8] .
Sunspots are large magnetic storms that are cool spots appearing dark on the sun. They are surrounded by plagues or faculae, known as bright spots. Sunspots lead to an increase in the receipt of solar radiation, and there is evidence that sunspots can cause a potential increase in temperature [9] .
This work is important because it explains how teleconnections that occur around the world affect Buenos Aires’ climate. It also explains why some teleconnections affect only temperature and not the precipitation patterns, and vice versa. There is some work done around Buenos Aires, for example, in Chile, Las Pampas, Southern Brazil, Peru and the Andes Mountains regarding temperature and precipitation patterns, but little work is dedicated with the focus of the effect of teleconnections on Buenos Aires, Argentina, and how the ENSO phases influences the production and exporting of wheat and corn. Section 2 describes temperature and precipitation results and the impact of ENSO on wheat and corn production and export; and Section 3 summary and conclusions.
2. Results and Discussion
2.1. Temperature
Buenos Aires has experienced a warming trend in the past century and a half. There are links of this increasing trend of the temperature with more frequent occurrences of warmer days and nights and a decrease of cold days and nights [10] [11] . Figure 1 shows that the average annual temperature of Buenos Aires has increased by about 1.8˚C over the past 156 years. There appears to be a year-to-year variation on the temperature of Buenos Aires, ranging from a low of approximately 14.8˚C to a high of approximately 18.5˚C, supporting the strong warming trend. The lowest average summer temperature is 21˚C and the highest average summer temperature is 25.4˚C. The increasing trend shows a dramatic drop in the temperature in 2008. The year 2008 was a strong La Niña year. During a La Niña year, the western coast of South America, experiences a higher than average air pressure system causing colder temperatures. This colder air temperature travels up and over the Andes Mountains and across the South American continent into Buenos Aires, causing a higher than average air pressure system in Buenos Aires, causing a decrease in the temperature to approximately 14.8˚C in 2008.
Figure 2 shows the trend of the seasonal and annual 30-year-average temperature of Buenos Aires. The graph shows a strong increase in the average temperature from 1893 to 1982, which could be associated with the exchange of tropical and polar air masses that produce an increase and variability in the southern hemisphere temperature, especially from the period of 1953 to 1982 [12] . During the period of 1983-2012, there was a decline in the average annual temperature in all seasons. The drop in the temperature can be linked to the cold La Niña events that occurred in 1989, 1999, 2008, 2011 and 2012 (Figure 1).
The AO, PNA and Sunspot Numbers show the strongest correlations with the summer temperature of Buenos Aires. AO shows a strong positive correlation coefficient of 0.24 (Figure 3). The positive phase of AO shows
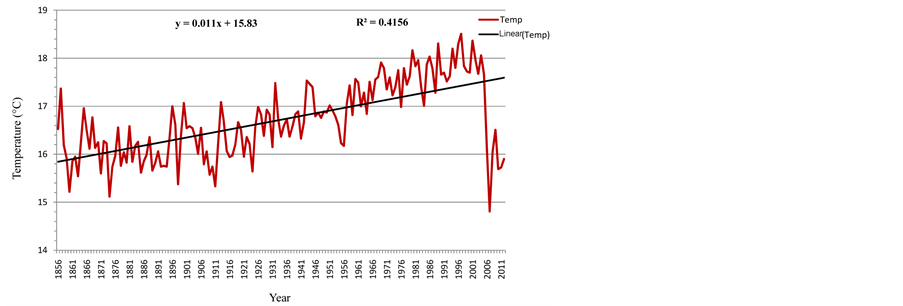
Figure 1. Average annual temperature (˚C) for Buenos Aires, Argentina from the years 1856-2012.
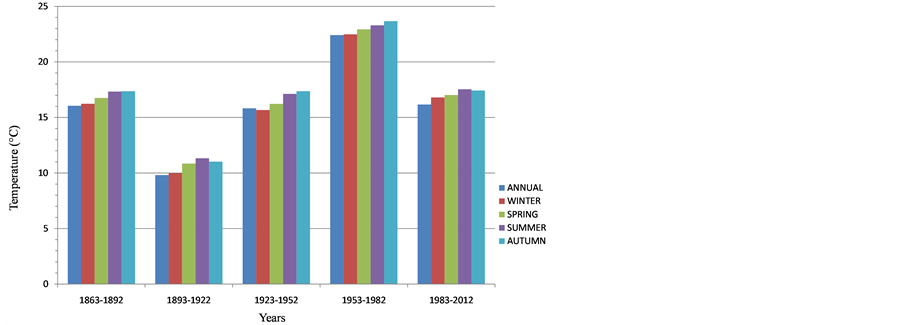
Figure 2. 30-year seasonal temperature (˚C) averages for Buenos Aires, Argentina, for the period 1863-2012.
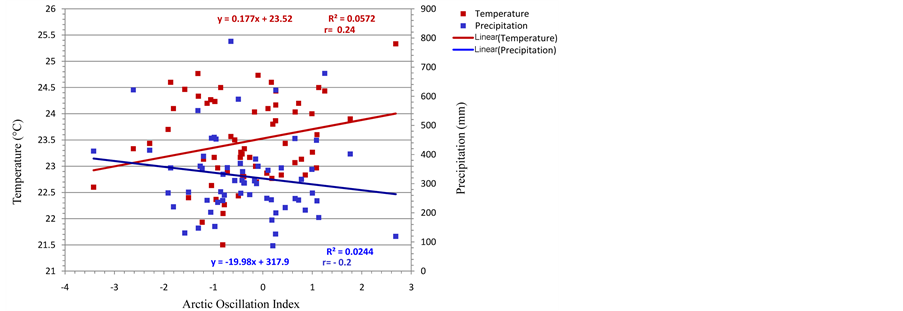
Figure 3. Correlation between average summer (DJF) temperature (˚C), total precipitation (mm) and Arctic Oscillation Index (AO), for Buenos Aires, Argentina, 1950-2012.
high temperatures of about 25.4˚C and during the negative phase Buenos Aires experiences lower temperatures of about 21.5˚C. During the positive phase of AO, the cold Arctic air and strong westerly winds aloft stay further north, creating warmer temperatures in the southern hemisphere. During the negative phase of AO, Buenos Aires experiences colder temperatures, which could be due to large clouds over the Atlantic Ocean [5] and colder air descending from the Arctic due to strong zonal winds [3] .
PNA also shows a positive relationship with the summer temperature of Buenos Aires with a correlation coefficient of 0.10 (Figure 4), meaning that the positive events produce warm temperatures and the negative events produce colder temperatures. PNA’s slight increase in temperature could be influenced by El Niño, where warm episodes in the eastern Pacific could enhance the temperature of Buenos Aires.
AAO and ENSO showed weak to no correlations with the summer temperature of Buenos Aires. The correlation between AAO and temperature is 0.06 (Figure 5). This means that during the positive phase of AAO, Buenos Aires experiences warm temperatures as the subtropical jet moves south (55˚S) and during the negative phase of AAO, cooler temperature are experienced because subtropical jet moves north (40˚S) closer to Buenos Aires area . The correlation between ENSO and temperature is −0.02 (Figure 6). The negative correlation means El Niño events produce warm temperatures while La Niña events produce cold temperatures. ENSO’s weak correlation occurs because ENSO circulates and affect the areas of the central Pacific Ocean having very little effect on the Atlantic regions.
There is also a strong positive relationship between Sunspot Numbers and Buenos Aires’ summer temperature. The two variables have a correlation coefficient of 0.21 (Figure 7). When there are fewer sunspots, approximately between 0 - 150, the temperature ranges from about 19.8˚C to 24.8˚C, and when there are more sunspots (between 150 - 250), the temperature tends to be higher, ranging from about 22.4˚C to 25.4˚C. This means that when there are more sunspots, there is an increase in solar radiation received at the surface (Figure 7).
2.2. Precipitation
Buenos Aires’ precipitation has increased by about 300 mm over the past 151 years (Figure 8). The annual and summer average precipitation is 1020.11 mm and 283 mm, respectively. It shows a dramatic decrease in the total annual precipitation in 2008 (La Niña year). The anomalously high pressure on the western coast of South America travels through the South American continent creating a high pressure system that brings dry conditions to Buenos Aires.
Figure 9 depicts the frequency distribution of total annual precipitation of Buenos Aires and shows that 81 of the 151 years of precipitation fall between 900 mm and 1299 mm. Penalba and Robledo [2] explain that these years could have been particularly wetter than the rest because of a probable daily precipitation rate greater than 0.1 mm/day.
The correlation between AO and precipitation shows a strong negative correlation r = −0.20 (Figure 3). The positive phase of AO accounts for less precipitation with a minimum amount of about 90 mm, while the negative phase correlates with more precipitation up to about 800 mm. The low pressure system that forms storms in
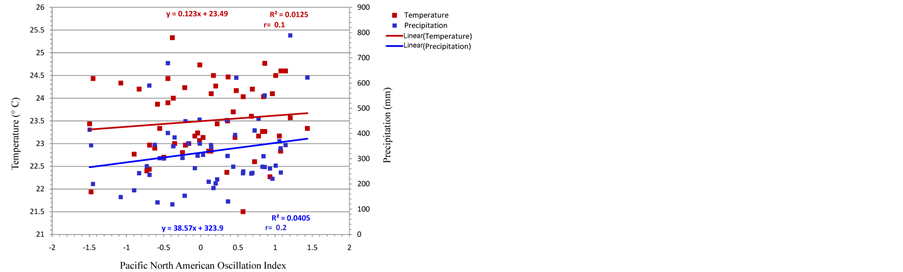
Figure 4. Correlation between average summer (DJF) temperature (˚C), total precipitation (mm) and Pacific North American Oscillation Index (PNA), for Buenos Aires, Argentina, 1955-2012.
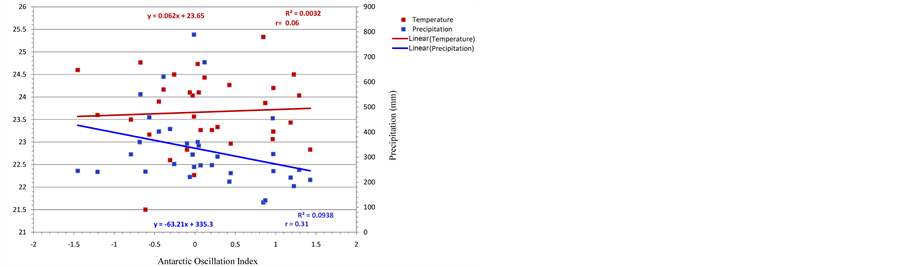
Figure 5. Correlation between average summer (DJF) temperature (˚C), total precipitation (mm) and Antarctic Oscillation Index (AAO), for Buenos Aires, Argentina, 1980-2012.
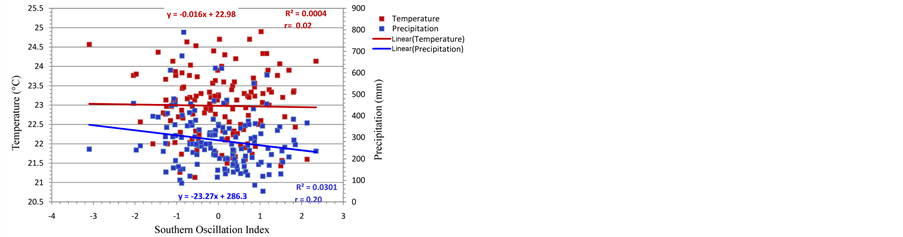
Figure 6. Correlation between average summer (DJF) temperature (˚C), total precipitation (mm) and Southern Oscillation Index (SOI), for Buenos Aires, Argentina, 1867-2012.
the Mediterranean region adds moisture to the warm summer air above the Atlantic Ocean and creates more precipitation during the negative phase of AO.
PNA has a strong positive relationship with Buenos Aires’ summer precipitation with a correlation coefficient of 0.20 (Figure 4). The positive phase of PNA causes more precipitation and the negative phase causes less precipitation.
AAO also shows a strong negative correlation with the summer precipitation of Buenos Aires with a correlation coefficient of −0.31 (Figure 5). The positive phase of AAO results in less precipitation and the negative phase results in more precipitation. Increased amounts of precipitation during the negative phase of AAO is due to the abundant moisture brought by the northward movement of the subtropical jet stream centered at about
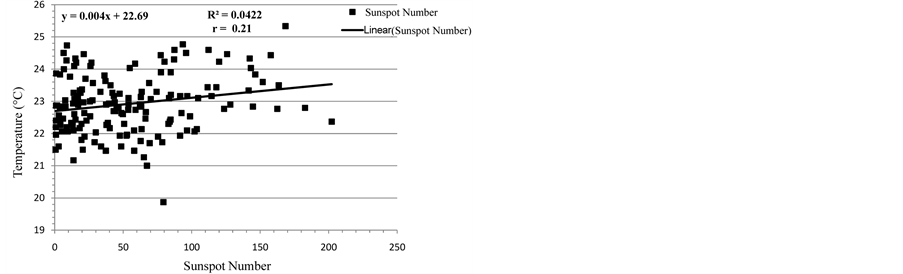
Figure 7. Correlation between average summer (DJF) Sunspot Number and temperature (˚C) for Buenos Aires, Argentina, 1856-2012.
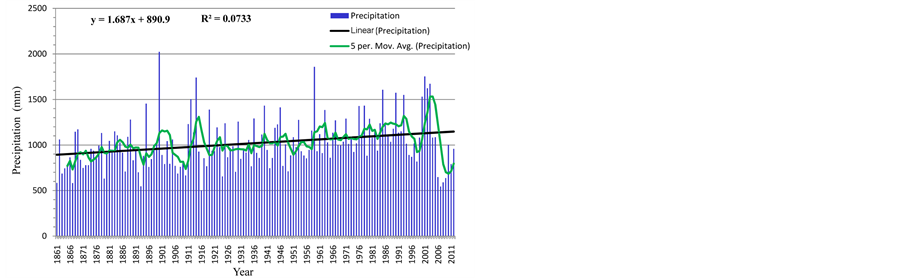
Figure 8. Total annual precipitation (mm) received in Buenos Aires, Argentina, 1861-2012.
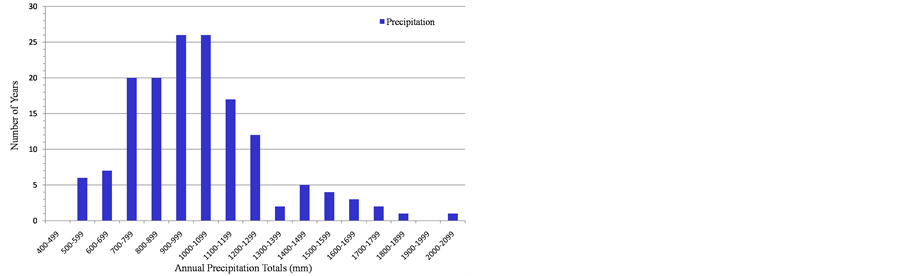
Figure 9. Frequency distributions of annual precipitation totals (mm) for Buenos Aires, Argentina, 1861-2012.
40˚S. The positive phase of AAO exhibits opposing moisture and precipitation effects due to the southward movement of the subtropical jet stream centered at about 55˚S (IPCC, 2007).
ENSO shows a strong negative correlation with the summer precipitation of Buenos Aires. The correlation coefficient is −0.20 (Figure 6). This means that strong negative SOI values represents El Niño, a large low pressure system over the Western coast of South America, and during strong positive SOI values (La Niña), a large high pressure system over Western coast of South America.
2.3. The Impact of ENSO on Wheat and Corn Production
The conditions that affect the western coast of South America during the ENSO phases are the same conditions that affect Buenos Aires. The low (high) pressure system transfers from the western coast of South America across the South American continent by mimicking the Peruvian conditions into the eastern slope of Buenos Aires’ South Atlantic coast, causing the same conditions in Peru and Buenos Aires during ENSO phases [8] [13] . When the Peruvian region experiences an El Niño event (low pressure), there is an abundant amount of precipitation received, as well as in Buenos Aires. The summer is extremely dry, causing drought in a typical La Niña year, but extremely wet, causing soggy fields and floods in a strong El Niño year [2] resulting less wheat and corn production and export [14] [15] . In the 1997-1998 El Niño year, the total annual precipitation exceeded 1700 mm and in 2007-2008 La Niña year the precipitation decreased to 550 mm (Figure 8).
2.3.1. ENSO, Wheat Production and Exports
Buenos Aires is especially prone to a severe drought season during La Niña, a province that accounts for 60% - 65% on the national wheat output [14] . The wheat is planted between May and June, harvested in December and usually exported between December and January. During 1997-1998, a soggy El Niño year, wheat production decreased from 15,740 (Million Tones (MT)) in 1996-1997 to 13,300 MT, and the wheat growth rate dropped 15.5% due to and flooded fields in December, the key harvesting month for wheat [16] . In 1998, of the 13,300 MT of production, 10,000 MT were exported [14] . During 2007-2008, a dry La Niña year, wheat production dropped from 18,600 MT in 2006-2007 to 11,000 MT and only about 6500 MT of wheat was exported [14] . The wheat growth rate dropped 40.86% due to the dry conditions which created damaged wheat that was not able to be sold as grain, therefore, a loss of production and export was experienced during 2008-2009 [16] .
2.3.2. ENSO, Corn Production and Exports
The United States is accountable for nearly 60% of global corn exports and Argentina is the second with a 15% share of the world trade [15] . Corn is planted between October and November, harvested between March and April and usually exported at the end of April and into May (G. Alonso-Murray, private communication, 2013). During 1997-1998, corn production decreased from 19,361 MT in 1996-1997 to 13,504 MT and the corn growth rate dropped 30.25 [15] . From the 13,504 MT of corn production, only about 8000 MT was exported. Corn dropped due to wetter than normal fields through the months of December to February. During the 2007-2008, a dry La Niña year, the low production of 15,500 MT resulted in an approximate drop of 11,000 MT of corn export, and the corn growth rate decreased by 30% [15] . During the 2007-2008 droughts, nearly 40% of the harvested corn was damaged and lost as the drought grew more intense in the summer from December to February; therefore the corn loss was cut for silage and was not sold [15] . The Argentina national corn yield fell 14% below trend in 2007-2008.
Recently, during the 2009-2010, a moderate El Niño year, Argentina’s total precipitation increased to 1000 mm (Figure 8) and the corn production was 23,600 MT [15] . In 2011-2012, a weak La Niña year the total annual precipitation dropped to about 750 mm (Figure 8), causing corn production to fall to 21,000 MT [15] .
3. Summary and Conclusion
Buenos Aires has experienced a warming of about 1.8˚C of its average annual temperature during the period of 1856-2012. This warming can be associated with more frequent occurrences of warmer days and nights and a decrease of cold days and nights. Another explanation of this warming trend could be due to the cold Arctic air staying in the North due to strong pressure differences between Arctic polar regions and the central Atlantic as well as strong westerly winds aloft, creating warmer temperatures. The unusual cool period in 2007-2008 occurred due to the strong La Niña year causing major wheat and corn economic losses.
The AO, PNA, NAO and Sunspot Number have showed to have major effects on Buenos Aires’ summer temperature. The AO, PNA and AAO all showed high temperatures in the positive phase and low temperatures in the negative phase. This is due to their strong positive correlation coefficients with temperature. Sunspot Number showed that with fewer sunspots, the temperature is lower, ranging from about 19.8˚C to 24.8˚C, and with more sunspots, the temperature is higher, ranging from about 22.4˚C to 25.4˚C.
Precipitation in Buenos Aires has increased by about 150 mm to 300 mm during 1861-2012. Also, AO, PNA, AAO and ENSO have showed to have major effects on the summer precipitation of Buenos Aires. The AO accounts for drier summer conditions in the positive phase and wetter summer conditions in the negative phase. The PNA showed an increase in precipitation during the positive phase causing wet summer conditions, and during the negative phase, causing dry summers. Unlike PNA, AAO showed that positive phase resulted in less precipitation, causing dry summer weather and the negative phase resulted in more precipitation, causing moist summer weather. Finally, the ENSO phases causes Buenos Aires to experience extremely wet summer weather during El Niño (negative SOI values) and extremely dry summer weather during La Niña (positive SOI values). Both of these conditions have a major impact on the wheat and corn production and export of Buenos Aires.
The teleconnections discussed showed how climate changes from warmer to colder temperatures and wetter to dryer conditions. Buenos Aires’ climate change is based on the various phases of the climate modes affecting the temperature and precipitation. Teleconnections have large effects on Buenos Aires’ summer temperature and precipitation and showed an increase in average temperature and total precipitation in the past century and a half. A change in the Earth’s climate as a whole in the next 50 - 100 years will have an effect on the return periods and magnitudes of the teleconnections discussed and, therefore, they will change the climate and the ability of Buenos Aires’ crops to maintain successful wheat and corn production and exports to nurture the world. Further research is needed to understand the relationship between the teleconnections and climate change to be able to predict the future of the wheat and corn production and exports of Buenos Aires and in other parts of the world.
References
- Podesta, G., Letson, D., Messina, C., Royce, F., Ferreyra, R.A., Jones, J., Hansen, J., Liovet, I., Grondona, M. and O’Brien, J.J. (2002) Use of ENSO-Related Climate Information in Agricultural Decision Making in Argentina: A Pilot Experience. Agricultural Systems, 74, 371-392. http://dx.doi.org/10.1016/S0308-521X(02)00046-X
- Penalba, O.C. and Robledo, F.A. (2005) Frequency of Precipitation in the Humid Pampa of Argentina. Atlantic, 40, 30-36.
- Ambaum, M.H., Hoskins, B.J. and Stephenson, D.B. (2001) Arctic Oscillation or North Atlantic Oscillation? Journal of Climate, 14, 3495-3507. http://dx.doi.org/10.1175/1520-0442(2001)014<3495:AOONAO>2.0.CO;2
- Gong, D. and Wang, S. (1999) Definition of Antarctic Oscillation Index. Geophysical Research Letters, 26, 459-462.http://dx.doi.org/10.1029/1999GL900003
- Hunter, C. and Binyamin, J. (2012) The Impact of Climate Modes on Summer Temperature and Precipitation of Darwin, Australia, 1870-2011. Atmospheric and Climate Sciences, 2, 562-567. http://dx.doi.org/10.4236/acs.2012.24051
- Diaz, H.F., Hoerling, M.P. and Eischeid, J.K. (2001) ENSO Variability, Teleconnections and Climate Change. International Journal of Climatology, 21, 1845-1862. http://dx.doi.org/10.1002/joc.631
- Moreiras, S.M. (2005) Climatic Effect of ENSO Associated with Landslide Occurrence in the Central Andes, Mendoza province, Argentina. Landslides, 2, 53-59. http://dx.doi.org/10.1007/s10346-005-0046-4
- Watterson, I.G. (2009) Components of Precipitation and Temperature Anomalies and Change Associated with Modes of the Southern Hemisphere. International Journal of Climatology, 29, 809-826.http://dx.doi.org/10.1002/joc.1772
- Dikpati, M., Gilman, P.A. and de Toma, G. (2008) The Waldmeier Effect: An Artifact of the Definition of Wolf Sunspot Number? The Astrophysical Journal Letters, 673, L99-L101. http://dx.doi.org/10.1086/527360
- Rusticucci, M. and Barrucand, M. (2004) Observed Trends and Changes in Temperature Extremes over Argentina. Journal of Climate, 17, 4099-4107. http://dx.doi.org/10.1175/1520-0442(2004)017<4099:OTACIT>2.0.CO;2
- Parry, M.L., Canziani, O.F., Palutikof, J.P., Van der Linden, P.J. and Hanson, C.E. (2007) Contribution of Working Group II to the Fourth Assessment Report of the Intergovernmental Panel on Climate Change.http://www.ipcc.ch/publications_and_data/ar4/wg2/en/ch13s13-2-4.html
- Rusticucci, M. and Vargas, W. (2002) Cold and Warm Events over Argentina and Their Relationship with the ENSO Phases: Risk Evaluation Analysis. International Journal of Climatology, 22, 467-483.http://dx.doi.org/10.1002/joc.743
- Berman, A.L., Silvestri, G. and Compagnucci, R. (2012) Eastern Patagonia Seasonal Precipitation: Influence of Southern Hemisphere Circulation and Links with Subtropical South American Precipitation. Journal of Climate, 25, 6781-6795. http://dx.doi.org/10.1175/JCLI-D-11-00514.1
- Martell, G. (2011) Argentina Wheat Production Reduced Sharply from Drought. In Martell Crop Projections.http://www.martellcropprojections.com
- Martell, G. (2012) Argentina 2012 Corn Prospects Improve on Heavy Rainfall. In Martell Crop Projections.http://www.martellcropprojections.com
- Wheat Production by Year (2012) In Index Mundi. http://www.indexmundi.com/agriculture/?country=ar&commodity=wheat&graph=production
NOTES

*Corresponding author.