Open Journal of Applied Sciences
Vol.4 No.5(2014), Article ID:44895,7 pages DOI:10.4236/ojapps.2014.45024
Relationship between Onset of Cerebral Infarction and Classification of Meteorological Elements
Mitsuhiro Kojima1, Norimitsu Ogasawara2, Hiroshi Morimoto1
1Graduate School of Environmental Studies, Nagoya University, Nagoya, Japan
2Japan Weather Association, Tokyo, Japan
Email: kojima.mitsuhiro@e.mbox.nagoya-u.ac.jp, hiroshim@info.human.nagoya-u.ac.jp
Copyright © 2014 by authors and Scientific Research Publishing Inc.
This work is licensed under the Creative Commons Attribution International License (CC BY).
http://creativecommons.org/licenses/by/4.0/


Received 27 February 2014; revised 31 March 2014; accepted 8 April 2014
ABSTRACT
It is well recognized that there are many kinds of diseases that are affected by meteorological factors. This study aims at investing the relation between the onset of cerebral infarction (CI) and climatic elements. Databases of medical emergency transfers in Nagoya during the winter seasons of 2002-2004 were reviewed. We applied a bi-directional self-organizing map (SOM), cluster analysis and decision tree to estimate the effects of climatic elements on the onset of CI. We classified climatic elements into three patterns, such as “rainy weather”, “west high and east low pressure” and “fair weather” by applying SOM. The risk of CI was estimated more clearly over each pattern. The meteorological variances are associated with the onset of CI. This fact was more accurately observed by classification of climatic patterns based on SOM. This study also suggests that effective warning is possible for the onset of CI, if we classify weather patterns.
Keywords:Stroke Onset, Weather Chart, Bi-Directional Self-Organizing Map, Decision Tree, Cerebral Infarction Onset

1. Introduction
The daily evolution of meteorological events influences biological processes and induces human disease. A stroke is considered as one of typical disease affected by climate events [1] . In Germany, health-weather forecasting has been carried by daily newspaper [2] . This study aims to develop health-weather forecasting systems in Japan. Stroke causes an estimated 5.8 million deaths each year and it is the leading cause of death in Japan.
Many investigators have found that stroke onset peaks happen during the winter [3] -[5] . Weather conditions relevant to the onset of cerebral infarction (CI) have been studied for many years [6] -[9] . Stroke is a generic term for cerebrovascular disorders of sudden onset that comprise CI, cerebral hemorrhage and subarachnoid hemorrhage. Stroke is considered a meteoropathy that worsens when weather conditions change. Relationships between stroke onset and climatic elements have been studied [10] -[12] . The onset of CI is related to climatic elements such as sea-level pressure, mean temperature and sunshine duration. However, quantitative analyses of the risk of CI are challenging.
The present study examined daily transfers of patients with CI resulting from calls to public ambulance emergency services in Nagoya during the winters of 2002-2004 to quantify the effects of weather elements on CI.
We discuss the weather chart type not only climatic elements, and succeeded in understanding the characteristics of the climatic elements from the point of view of meteorology. We used advanced statistical techniques (bidirectional SOM, cluster analysis and decision trees), included several climatic elements in our models and examined the incidence of stroke.
Several studies have reported the relation between stroke and climate elements using logistic regression [10] or multivariate model [13] . The present paper tried to take classification of weather patterns in the method of decision tree.
2. Subjects and Methods
2.1. Area
This study proceeded in Nagoya (latitude 35˚11'N, longitude 136˚55'E), a typical commercial city of about 2.2 million inhabitants located in a Pacific climatic zone. Summers are hot and humid, whereas winters are cold, mostly clear and dry.
2.2. Database
We obtained information about the numbers of persons transferred to hospital with cerebral infarction (CI) from the database of the Nagoya public ambulance emergency service during December, January and February of 2002-2004.
2.3. Meteorological Data
Daily meteorological data were obtained from the Japan Meteorological Agency. Principal component analysis (PCA) was applied to climatic elements to detect correlations. Since the PCA determined that differences in solar radiation and the duration of sunshine closely correlated with other elements, they were removed to avoid multicollinearity between winter climatic elements. PCA was performed with statistical software SPSS 16, using VARIMAX rotation.
We collected data about the following elements: sea-level pressure, mean, minimum and maximum temperatures, diurnal temperature range (maximum-minimum temperature), mean vapor pressure, mean relative humidity, mean wind speed, sunshine duration, solar radiation and precipitation. We then determined differences in the following elements: sea-level pressure, mean, minimum and maximum temperatures, vapor pressure, mean relative humidity, mean wind speed, cloud cover and sunshine duration.
2.4. Weather Chart Type
We used the “weather chart classification” (weather chart) created by the Japan Weather Association. These charts classify climatic conditions based on the position and distance of weather fronts from Nagoya, such as the type of high/low pressure distribution and nature of atmospheric pressure, as follows: east high and west low (EHWL); north high and south low (NHSL); south high and east low (SHEL); west high and east low (WHEL) along with high (HP) and low (LP) atmospheric pressure.
Low pressure type is determined by the positional relationship between the pressure gradient. Type of front is determined by front type, direction, and the distance to the front.
3. Statistical Methods
Learning Algorithm of Bi-Directional SOM
The SOM is used to make prediction and trend analysis by visualizing complex high-dimensional data onto simple two-dimensional grids [14] . SOM is comprised of an input layer and a competitive layer.
Bi-directional SOM uses a supervised learning algorithm achieved by adding one more layer (called output layer) to the normal SOM. Thus, bi-directional SOM consists of three layers, input, competitive and output layers (Figure 1). Input layer has normally high-dimensional input vectors ( ). Output layer has a target vector (
 ) acting as a teacher signal.
In the bi-directional SOM, we use the Euclidean distance in order to measure the similarity of the weight vectors. The pair of weight vectors  of the winner unit (uc) satisfies the following Equation (1)
 (1)
(1)
The weight vectors of units in the neighborhood of the winner unit are also updated according to the distance from the winner unit.
Weight vector  at time
  of the unit (ui) is defined as follows, using a weight vector
  at time (t).
 (2)
(2)
where

 : Neighboring of the winner unit (uc);
 : Positive constant;
 : Position vector of the two-dimensional plane.
Thus, the feature of the input and teacher vector is reflected in each weight vector (2). Thus, two kinds of weight vectors arranged in each unit in two-dimensional plane become the final results of bi-directional SOM.
In this study, we used a bi-directional SOM to classify the climate pattern with respect to the risk of CI. And then, we used bi-directional SOM with 20-dimensional climatic elements as input vector, the transferred number of CI as target vector.
In this study, SOM is performed by using the statistical software “R” and its functions “som” and “xyf” in the package of “kohonen”. The function “som” calculates a basic SOM by using only input data, and the function

Figure 1. Conceptual diagram of bi-directional SOM. Bi-directional SOM consists of three layers, input, competitive and output layers.
“xyf” calculates bi-directional SOM by adding target data. These functions use Gaussian by default.
Input and output data is normalized in advance. The grids of units are set to 5 × 5 lattices. The number of iterations is set to 1000.
We then performed a cluster analysis of the climatic elements based on the results of the bi-directional SOM and classified them into climate patterns A, B and C.
In this study, we used Ward’s method in cluster analysis. As a result of cluster analysis, the feature of climate patterns was classified into three clusters.
4. Result
4.1. Climate Pattern
We see that the bi-directional SOM can contribute to trend-analysis and classification of relationship between complex 20-dimensional climatic elements and transferred number of CI onto simple two-dimensional grid.
We compared our result and that by Japan Weather Association. Thus, we could identify our classification (by SOM) with the weather patterns by Japan Weather Association.
Climate pattern A essentially comprised rainy weather with high levels of precipitation, a short duration of sunshine and low levels of solar radiation. Climate pattern B was classified as having a west high and east low pressure distribution (WHEL). Climate pattern C (fair weather) was classified as comprising high atmospheric pressure (Table 1).
4.2. Estimation of the Risk of CI
One “unit” is a group classified by the SOM. Small (low risk of CI) and large (high risk of CI) units contain input vectors with daily translation numbers <6 and >7. Average and standard deviation of transport number of CI was 5.3 and 2.4 respectively. From these results, we determined daily transport numbers of CI more than 7 as high risk.
4.3. Risk of CI in Climate Pattern A (“Rainy Weather”)
We analyzed CI under conditions of climate pattern A (rainy weather) using a decision tree to determine differences in low and high risk. Minimal temperature in the first node branched at 3.1˚C.
Risk was reduced and increased when the minimum temperature was >3.1˚C and <3.1˚C respectively.
4.4. Risk of CI in Climate Pattern B (“WHEL”)
We analyzed individuals with CI transferred under a WHEL by the similar way as the pattern A. Difference of mean relative humidity in the first node branched at −21.5%. Risk was reduced and increased when difference of mean relative humidity was >−21.5% and <−21.5% respectively.
4.5. Risk of CI in Climate Pattern C (“Fair Weather”)
We analyzed the data of this pattern similarly. Diurnal temperature range in the first node branched at 8.55˚C.

Table 1. Comparison of weather chart type and climate patterns.
Risk was respectively reduced and increased at diurnal temperatures above and below 8.55˚C.
4.6. Predicted Risk of CI Onset
The present study compared the predictive accuracy of decision trees, bi-directional SOM, and cluster analysis with that of decision tree alone. The predictive accuracy of decision tree alone (without weather classifications) was 77.5%. Adding our climate classification improved this to 95.6%, 81.3% and 95% during rainy weather, fair weather, and during a west high and east low pressure distribution, respectively.
5. Discussion
Stroke is considered to be a meteorotropism. Associations between the onset of CI and the climatic elements, such as air pressure, temperature and humidity have been investigated [15] [16] .
However, these reports did not sufficiently consider pressure patterns and the position of weather fronts. We classified climate patterns and elements, and then estimated the risk of CI using bi-directional SOM and multidimensional data. Bi-directional SOM allowed the classification of weather elements according to the risk of CI as “rainy weather”, “west high and east low pressure distribution” and “fair weather”. We found that bi-directional SOM is effective for understanding complicated changes in climatic elements. In addition, the application of decision tree allowed a more precise estimation of the risk of CI associated with each climatic condition.
The risk of CI was higher in rainy weather, for example, when a cold front passed through Nagoya (Figure 2). Precipitation and low temperature also increased risk. On the other hand, risk was low when a front was stationary. We can say that the risk during rainy weather is affected by temperature and front lines.
Here are examples of CI risk under climate pattern B. The risk became increased immediately after a front passed through Nagoya, that is, on the day after precipitation (Figure 3). On the other hand, risk decreased when a front passed through followed by a distant high pressure front.
We found that over 10 individuals were transported during fair weather and that the risk of CI increased at higher temperatures, or when the diurnal temperature range was 11.7˚C. Heat stress might be caused by transitions in temperatures. High/low temperatures might cause psychological stress, which in turn would increase blood pressure and thus the risk of CI. Here are examples of increased CI risk under climate pattern C (Figure 4). Heat stress appeared to affect the autonomic nervous system. Rapid changes in temperature seemed to exert considerable physical stress. Risk of CI was high when temperatures increased, or when the diurnal temperature range was 11.7˚C.
Judging from these results, the mechanism of the onset of CI varies with climate patterns. We found that the risk of CI onset can be estimated more effectively from decision trees which are applied after classifying climate patterns in bi-directional SOM, than by using conventional decision trees that only consider weather conditions without any classification of climatic elements. We classified evolutionary patterns of meteorological events into three patterns. This enabled to analyse more clearly the relation of the onset of CI and climate elements. The method of decision tree was improved by applying it over each classified climate pattern.
We can conclude that classification of climate patterns improves the accuracy of health-weather forecasting.
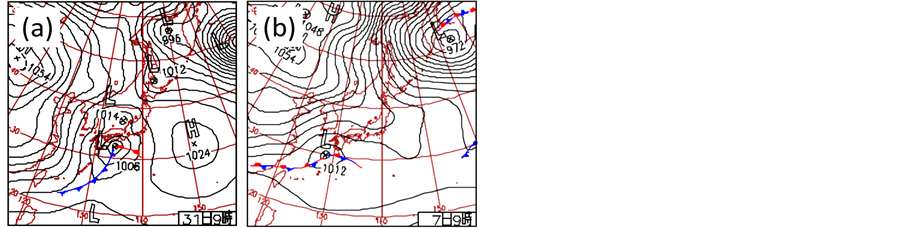
Figure 2. Typical example in Group A, “rainy weather”. (a) Risk of cerebral infarction becomes higher. On December 31, 2004, twelve persons were reported to have been transported; (b) Risk of cerebral infarction becomes lower. On December 7, 2002, one person was reported to have been transported.
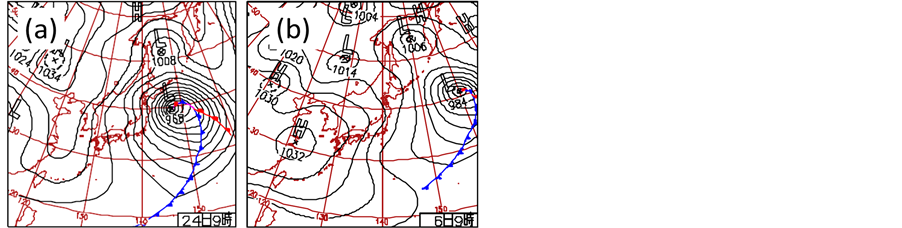
Figure 3. Typical example in Group B, “West High and East Low pressure distribution type (WHEL)”. (a) Risk of cerebral infarction becomes higher. On December 24, 2003, eleven persons were reported to have been transported; (b) Risk of cerebral infarction becomes lower. On February 6, 2003, two persons were reported to have been transported.
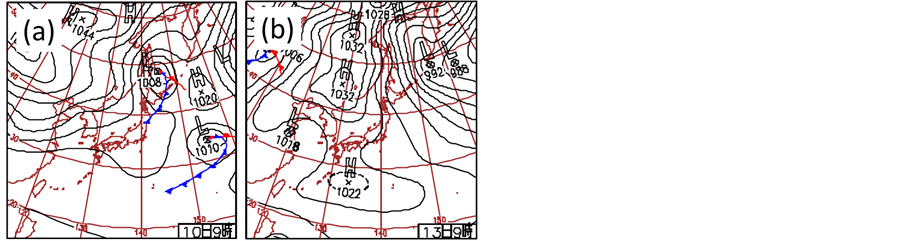
Figure 4. Typical example in Group C, “fair weather”. (a) Risk of cerebral infarction becomes higher. On February 10, 2003, thirteen persons were reported to have been transported; (b) Risk of cerebral infarction becomes lower. On January 13, 2002, one person were reported to have been transported.
Thus effective warnings can be possible based on our method.
Acknowledgements
We thank the public ambulance emergency service of Nagoya for providing the patients’ data.
References
- Lanska, D.J. and Hoffmann, R.G. (1999) Seasonal Variation in Stroke Mortality Rates. Neurology, 52, 984. http://dx.doi.org/10.1212/WNL.52.5.984
- Goggins, W.B., Woo, J., Ho, S., Chan, E.Y. and Chau, P.H. (2012) Weather, Season, and Daily Stroke Admissions in Hong Kong. International journal of biometeorology, 56, 865-872. http://dx.doi.org/10.1007/s00484-011-0491-9
- Walach, H., Schweickhardt, A. and Bucher, K. (2002) Does Weather Modify Headaches? An Empirical Evaluation of Bio-Weather Categorization. Schmerz (Berlin, Germany), 16, 1-8. http://dx.doi.org/10.1007/s004820100066
- Inagawa, T. (2002) Seasonal Variation in the Incidence of Aneurysmal Subarachnoid Hemorrhage in Hospital-and Community-Based Studies. Journal of neurosurgery, 96, 497-509. http://dx.doi.org/10.3171/jns.2002.96.3.0497
- Fischer, T., Johnsen, S.O.R.P., Pedersen, L., Gaist, D., Sørensen, H.T. and Rothman, K.J. (2004) Seasonal Variation in Hospitalization and Case Fatality of Subarachnoid Hemorrhage—A Nationwide Danish Study on 9367 Patients. Neuroepidemiology, 24, 32-37. http://dx.doi.org/10.1159/000081047
- Chen, R., Wang, C., Meng, X., Chen, H., Thach, T.Q., Wong, C.M. and Kan, H. (2013) Both Low and High Temperature May Increase the Risk of Stroke Mortality. Neurology, 81, 1064-1070. http://dx.doi.org/10.1212/WNL.0b013e3182a4a43c
- Kawai, K., Nonaka, K., Suzuki, H., Kirino, T. and Tamura, A. (2001) Differential Effects of Activity and Climate on Onset of Subarachnoid Hemorrhage. Neurologia Medico-Chirurgica, 41, 229-236. http://dx.doi.org/10.2176/nmc.41.229
- Wang, H., Matsumura, M., Kakehashi, M. and Eboshida, A (2006) Effects of Atmospheric Temperature and Pressure on the Occurrence of Acute Myocardial Infarction in Hiroshima City, Japan. Hiroshima Journal of Medical Sciences, 55, 45-51.
- Lim, Y.H., Kim, H. and Hong, Y.C. (2013) Variation in Mortality of Ischemic and Hemorrhagic Strokes in Relation to High Temperature. International journal of Biometeorology, 57, 145-153. http://dx.doi.org/10.1007/s00484-012-0542-x
- Setzer, M., Beck, J., Hermann, E., Raabe, A., Seifert, V., Vatter, H. and Marquardt, G. (2007) The Influence of Barometric Pressure Changes and Standard Meteorological Variables on the Occurrence and Clinical Features of Subarachnoid Hemorrhage. Surgical Neurology, 67, 264-272. http://dx.doi.org/10.1016/j.surneu.2006.06.060
- Hong, Y.C., Rha, J.H., Lee, J.T., Ha, E.H., Kwon, H.J. and Kim, H.O. (2003) Ischemic Stroke Associated with Decrease in Temperature. Epidemiology, 14, 473-478. http://dx.doi.org/10.1097/01.ede.0000078420.82023.e3
- Woo, J., Kay, R. and Nicholls, M.G. (1991) Environmental Temperature and Stroke in a Subtropical Climate. Neuroepidemiology, 10, 260-265. http://dx.doi.org/10.1159/000110282
- Lejeune, J.P., Vinchon, M., Amouyel, P., Escartin, T., Escartin, D. and Christiaens, J.L. (1994) Association of Occurrence of Aneurysmal Bleeding with Meteorologic Variations in the North of France. Stroke; a Journal of Cerebral Circulation, 25, 338-341. http://dx.doi.org/10.1161/01.STR.25.2.338
- Kohonen, T. (1982) Self-Organized Formation of Topologically Correct Feature Maps. Biological Cybernetics, 43, 59- 69. http://dx.doi.org/10.1007/BF00337288
- Oberg, A.L., Ferguson, J.A., McIntyre, L.M. and Horner, R.D. (2000) Incidence of Stroke and Season of the Year: Evidence of an Association. American journal of epidemiology, 152, 558-564. http://dx.doi.org/10.1093/aje/152.6.558
- Liang, W., Hu, Y., Kasabov, N. and Feigin, V. (2011) Exploring Associations between Changes in Ambient Temperature and Stroke Occurrence: Comparative Analysis Using Global and Personalised Modelling Approaches. In Neural Information Processing, Springer, Berlin, Heidelberg, 129-137.