Advances in Microbiology
Vol.3 No.6A(2013), Article ID:37926,11 pages DOI:10.4236/aim.2013.36A003
Nitrogen Constrains the Growth of Late Summer Cyanobacterial Blooms in Lake Erie
1Department of Environmental Sciences and Lake Erie Center, University of Toledo, Toledo, USA
2F.T. Stone Laboratory, Ohio State University and Ohio Sea Grant, Columbus, USA
3Department of Biological Sciences, Kent State University, Kent, USA
Email: *chaffin.46@osu.edu
Copyright © 2013 Justin D. Chaffin et al. This is an open access article distributed under the Creative Commons Attribution License, which permits unrestricted use, distribution, and reproduction in any medium, provided the original work is properly cited.
Received July 18, 2013; revised August 17, 2013; accepted August 27, 2013
Keywords: Cyanobacteria; Eutrophication; Nitrogen; Phosphorus; Phytoplankton
ABSTRACT
Phosphorus (P) is generally considered to be the main limiting nutrient to freshwater phytoplankton productivity. However, recent research is drawing attention to the importance of nitrogen (N) in freshwater eutrophication and N often constrains growth of cyanobacteria in small lakes. In this study we determined phytoplankton nutrient limitation in a large lake, Lake Erie during two growing seasons. During 2010 and 2011, nutrient enrichment bioassays (+P, +N and, +P and N) were conducted monthly from June through September with water collected in Maumee Bay (site MB18) and in the center of the western basin (site WBC). Nutrient concentrations were monitored every other week. At MB18, total P concentration was often >3 mmol/L and nitrate concentration decreased from >250 mmol/L in early summer to <1 mmol/L in late summer. Nitrogen and P levels were about five-fold less at WBC. Bioassays indicated that phytoplankton nutrient limitation varied in summer, spatially, and even among phytoplankton groups. For site MB18, +P increased chlorophyll concentration in one of the eight bioassays, indicating that P did not typically limit production. For site WBC, +P increased chlorophyll concentration in six of the eight bioassays. As a result of very low ambient nitrate concentration (<5 mmol/L) in late summer, +N (without P) increased chlorophyll concentration, suggesting symptoms of N-limitation. The N-fixing cyanobacterium Anabaena became dominant following N-limitation. This study highlights the need to reduce P loading to restore water quality. Furthermore, due to low nitrate concentration, the severity of the cyanobacterial blooms could be worse if not for N-limitation in western Lake Erie.
1. Introduction
Eutrophication of freshwater has become a global problem due to humans accelerating nutrient loading into lakes and rivers [1]. Dense biomasses of cyanobacteria, often called blooms, are likely symptom of eutrophication due to high nutrient concentrations [2]. Cyanobacterial blooms are problematic because of their ability to produce harmful toxic compounds that negatively affect aquatic life, pets, and humans [3]. Furthermore, local economies suffer when a lake experiences a cyanobacterial bloom because recreational income decreases and lakefront property value declines [4]. Understanding factors that promote cyanobacterial blooms is paramount in order to prevent them.
High phosphorus (P) concentration is considered a main factor responsible for promoting eutrophication and cyanobacterial blooms [5]. Lakes with high P concentration are likely to have high biomasses of cyanobacteria and a phytoplankton community that consists largely of cyanobacteria [6]. This knowledge led to successful P abatement programs that reduced the amount cyanobacteria in many lakes [7,8]. However, recent research is drawing attention to the importance of nitrogen (N) in freshwater eutrophication [9-11]. In lakes with sufficient P concentrations to meet phytoplankton growth demand, N is the next likely nutrient to limit phytoplankton growth [12,13].
Lake Erie (North America) has been plagued by annual summer blooms of the cyanobacterium Microcystis since the mid-1990s [14,15]. Lake Erie is the 11th largest lake on Earth in terms of area and the 18th by volume [16]. The lake is considered to have three basins with different chemical, physical, and biological properties [17]. The eastern basin is the deepest (69 meters) and the most oligotrophic area of the lake. The central basin has an average depth of 19 meters and is mesotrophic to oligotrophic. The western basin is much shallower with an average depth of 8 meters and is considered eutrophic to mesotrophic. Blooms of the cyanobacterium Microcystis spp. are prevalent in each year in the western basin [15], but they can extend into the central basin in years with high nutrient loads [18]. The western basin receives a heavy nutrient load from the Maumee River [19], which drains a large (16,376 km2), highly agricultural (87%) water-shed [20]. Phytoplankton growth in Lake Erie is typically considered P-limited and the size of the summer cyanobacterial bloom is proportional to the spring-time total P load from the Maumee River [14]. However, late summer nitrate ( ) concentrations and the total N to total P ratio (TN:TP) in western Lake Erie decrease to values that would suggest N-limitation [21].
Within an algal assemblage, it is possible that P may limit some species while N may limit others [22]. In western Lake Erie, previous sampling indicated that  concentrations have exceeded 200 mmol/L during early summer and declined to concentrations below 1 mmol/L by mid-August, while ammonium (
 ) concentration had no temporal pattern and ranged from 2 to 10 mmol/L during the summer months [21]. The 2008 Lake Erie Microcystis bloom was found to be N-replete during the times of low
  availability [21], and it has been suggested that Microcystis blooms are able to remain N-replete during low overall N availability due to being a superior competitor for low levels of
  [11]. Because western Lake Erie has low concentrations of
  and
and  in late summer, it is possible that Microcystis blooms are P-limited while eukaryotic algae are P and N co-limited.
The goal of our study was to determine which nutrient (P or N) limited the growth of specific groups of phytoplankton at two sites in western Lake Erie during the growing seasons of 2010 and 2011. Nutrient enrichment bioassays were used in which we determined the growth responses to P and/or N enrichment of four phytoplankton groups with distinct pigment fluorescent properties. Ambient nutrient concentrations, light climate, and the cyanobacteria community composition were monitored throughout the growing seasons at the two sites. We hypothesized that all phytoplankton taxa would be P-limited in all waters. In nitrate-depleted waters we hypothesized that eukaryotic algae would be P and N co-limited and cyanobacteria (Microcystis) would be P-limited because of low concentrations of .
.
2. Materials and Methods
2.1. Study Site
This research was conducted at two sites in western Lake Erie (Figure 1) from early June to late September in 2010 and 2011. Site MB18 is in Maumee Bay and has a depth of 2.5 meters. Site WBC is in the center of the western basin and has a depth of 9 meters. MB18 typically has high nutrient concentrations that are 3 to 4 times greater than WBC because of influence from the Maumee River discharge [21,23].
2.2. Field Methods
Water was collected from surface to a depth of 2 meters at MB18 and from surface to 8 meters depth at WBC using a metal-free integrated tube sampler. Water for nutrient analysis was kept in acid-washed polyethylene bottles and in a ice cooler during transportation back to the laboratory. Water for analysis of cyanobacteria composition was poured into 350 mL glass jars and preserved with Lugol’s solution. Water for the bioassays was transported to the laboratory in acid-washed polyethylene jugs and kept in large cooler to protect from sunlight during transportation back to the laboratory. Two to 4 hours passed between water collection and transportation back to the laboratory.
Vertical profiles of underwater photosynthetic active radiation (PAR) were recorded to determine the light attenuation coefficient [21], and then used to calculate mean PAR [24]. Lake temperature was recorded with a YSI #6600 (Yellow Springs Instruments, Yellow Springs, Ohio, USA).
2.3. Nutrient Analysis
Unfiltered water was analyzed for total phosphorus (TP) and total Kjeldahl nitrogen (TKN) concentration. Filtered water (0.45 µm) was analyzed for dissolved nutrients [dissolved reactive P (DRP),  ,
,  , and silica] concentrations. All nutrient analyzes were conducted at
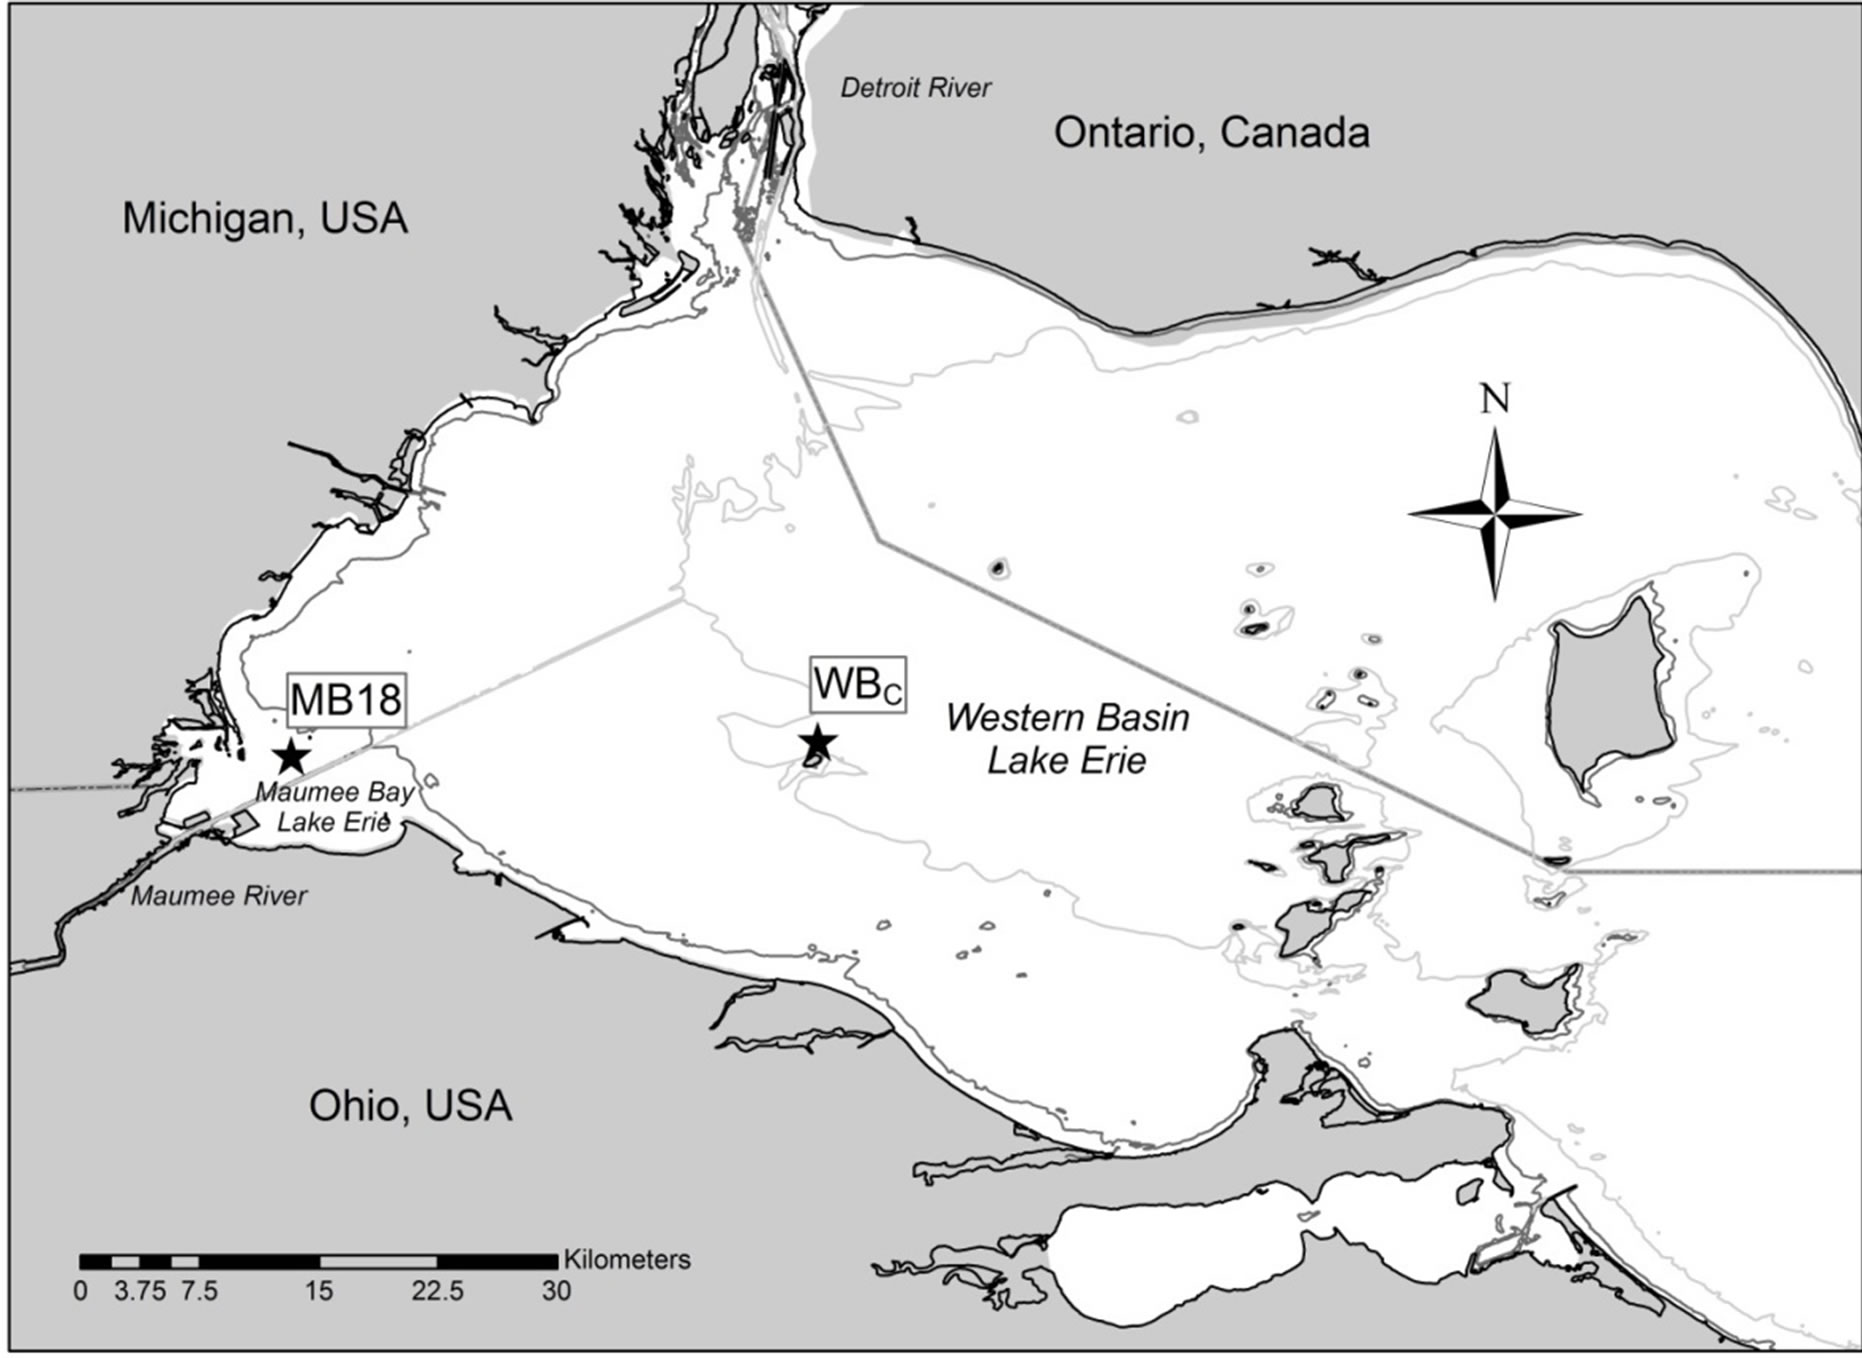
Figure 1. Map of western Lake Erie. MB18 in Maumee Bay and WBC in the center of the western basin were used for nutrient enrichment bioassays. Contour lines are 3-meter and 8-meter depth.
the National Center for Water Quality Research at Heidelberg University (Tiffin, Ohio, USA) using USA Environmental Protection Agency protocols [25]. The sum of  and TKN was used to calculate total N (TN) concentration.
2.4. Cyanobacteria Biovolume
Phytoplankton from the Lugol’s fixed samples were concentrated to 10 to 30 mL by pouring the sample into a 500-mL graduated cylinder and allowing the phytoplankton to settle to the bottom for 48 hours [26]. A 1-mL subsample was pipetted into a gridded Sedgewick-Rafter counting chamber. At least 200 individual cells, colonies, or trichomes were identified to the genus level, or counted until 100 of the most abundant taxa was counted under 200× or 400× (Leica MZ12, Wetzlar, Germany). The number of Microcystis cells in colonies was determined using SPOT Advanced (Sterling Heights, Michigan, USA) software [27]. Biovolume was calculated by measuring cell diameter, width, and/or length [26] until a constant average was obtained for each taxon.
2.5. Bioassays
Nutrient enrichment bioassays were conducted monthly (June, July, August, and September) in order to determine phytoplankton nutrient limitation [28]. In these experiments, the enrichment of a non-limiting nutrient will have the same result as the no-nutrient added control, because that nutrient is already in excess. However, the enrichment of the limiting nutrient will stimulate phytoplankton growth, and treatments with additions of the limiting nutrient will have greater chlorophyll (chl) a concentration than the control. In the laboratory, 200 mL of lake water was poured into acid-washed 250-mL polycarbonate flasks and enriched with one of the following treatments: 10 mmol/L P (+P; as KH2PO4), 520 mmol/L N (+N; as NaNO3 and (NH4)2SO4), combination P and N enrichment (+P&N), or a no-nutrient enrichment control. Each treatment and control was replicated in three separate flasks. Flasks were incubated in a growth chamber (Percival model: E-36HO, Fontana, Wisconsin, USA) at lake temperature at time of collection under a light intensity of 300 - 350 mmol photon/m2/s on a 12:12 h light:dark cycle. This light intensity approximates the mean PAR in western Lake Erie [21]. Flasks were inverted several times to prevent settling and randomly rearranged in the growth chamber daily [29].
In order to determine phytoplankton abundance before and after incubation, lake water was analyzed using a FluoroProbe (bbe Moldenke, GmbH, Schwentinental, Germany) equipped with a bench-top cuvette reader (Workstation 25) and magnetic stirrer. The FluoroProbe is capable of differentiating phytoplankton into four groups based on specific composition of photosynthetic accessory pigments [30]. The four groups of algae are: 1) Chlorophyta and Euglenophyta, 2) Cyanobacteria with phycocyanin, 3) Heterokontophyta (Bacillariophyceae and Chrysophyceae) and Dinophyta, and 4) Cryptophyta and cyanobacteria containing phycoerythrin and phycocyanin, which were termed green algae, cyanobacteria, diatoms, and cryptophytes (respectively) because these are the dominant phytoplankton taxa in western Lake Erie for each FluoroProbe group. The FluoroProbe partitions the total chl a concentration among these four groups. FluoroProbe measurements were corrected for colored dissolved organic matter (which may interfere with chl reading) using filtered (0.22 µm) lake water that was collected from that site on the day of the experiment [31]. Phytoplankton groups were considered not detected when chl a was less than 0.5 µg/L. The FluoroProbe Chi square parameter, the indicator of data quality, was similar between initial and final measurements of all experiments and indicates that the fluorescence properties of the phytoplankton groups did not change throughout incubation (Christian Moldaenke, bbe Moldaenke GmbH, personal commutation).
Phytoplankton was collected on GF/F filters after the final FluoroProbe measurements to validate the FluoroProbe by chl extraction. Filters were stored at −80˚C on silica gel until analysis. Chls a, b, and c were extracted using dimethylsulfoxide (DMSO) and quantified by absorbance [32]. To validate cyanobacteria, cultures of Lake Erie Microcystis were analyzed with the FluoroProbe and then collected on GF/F filters for analysis of phycocyanin (PC). Phycocyanin was extracted from filters by sonication using a 0.1-M sodium phosphate buffer and quantified via fluorometry [32].
Chlorophyll a concentration determined by DMSO extraction and total chl a from the FluoroProbe increased linearly with each other at a nearly one-to-one ratio (y = 1.0765x + 8.7122; r2 = 0.85; p < 0.001). Extracted chl b and green algae-chl a (green algae contain chl b) and extracted chl c and diatom-chl a (diatoms contain chl c) also increased linearly with each other but with less precision (r2 = 0.72, 0.66, respectively; p < 0.001). Phycocyanin and cyanobacteria-chl a increased linearly with a r2 = 0.93 using cultured Lake Erie Microcystis. Cryptophyte-chl a was not validated because the dominant taxon of this group (Cryptomonas) also contain PC.
2.6. Data Analysis
One-way ANOVA was used to determine significant difference among treatments and a post hoc Tukey tests were used to compare differences among treatments. When needed, data was log transformed to satisfy normality assumption. Differences were considered significant if p value was less than 0.05. SPSS statistics version 20 was used for statistical tests.
3. Results
3.1. Lake Properties
Nutrient concentrations and light climate were determined 13 times in both 2010 and 2011 from site MB18, and 14 times in 2010 and 12 times in 2011 from site WBC (Figure 2). Nutrient concentrations were typically greater at MB18 than at WBC. Ammonium concentrations were variable in both summers and at both sites. Nitrate concentration at site MB18 declined throughout the summer from high values (>250 mmol/L) in early summer to values below 1 mmol/L. In 2011 at MB18, nitrate concentration increased in late summer from concentrations below 1 mmol/L to concentrations similar to early summer. Dissolved silica concentrations declined to low levels (<5 mmol/L) at MB18 in both years then increased mid-summer. Dissolved silica concentrations at WBC ranged from 15.6 to 34.1 mmol/L and had no temporal pattern in both summers. Dissolved reactive P concentrations at MB18 were very high (>3.0 mmol/L) dur-
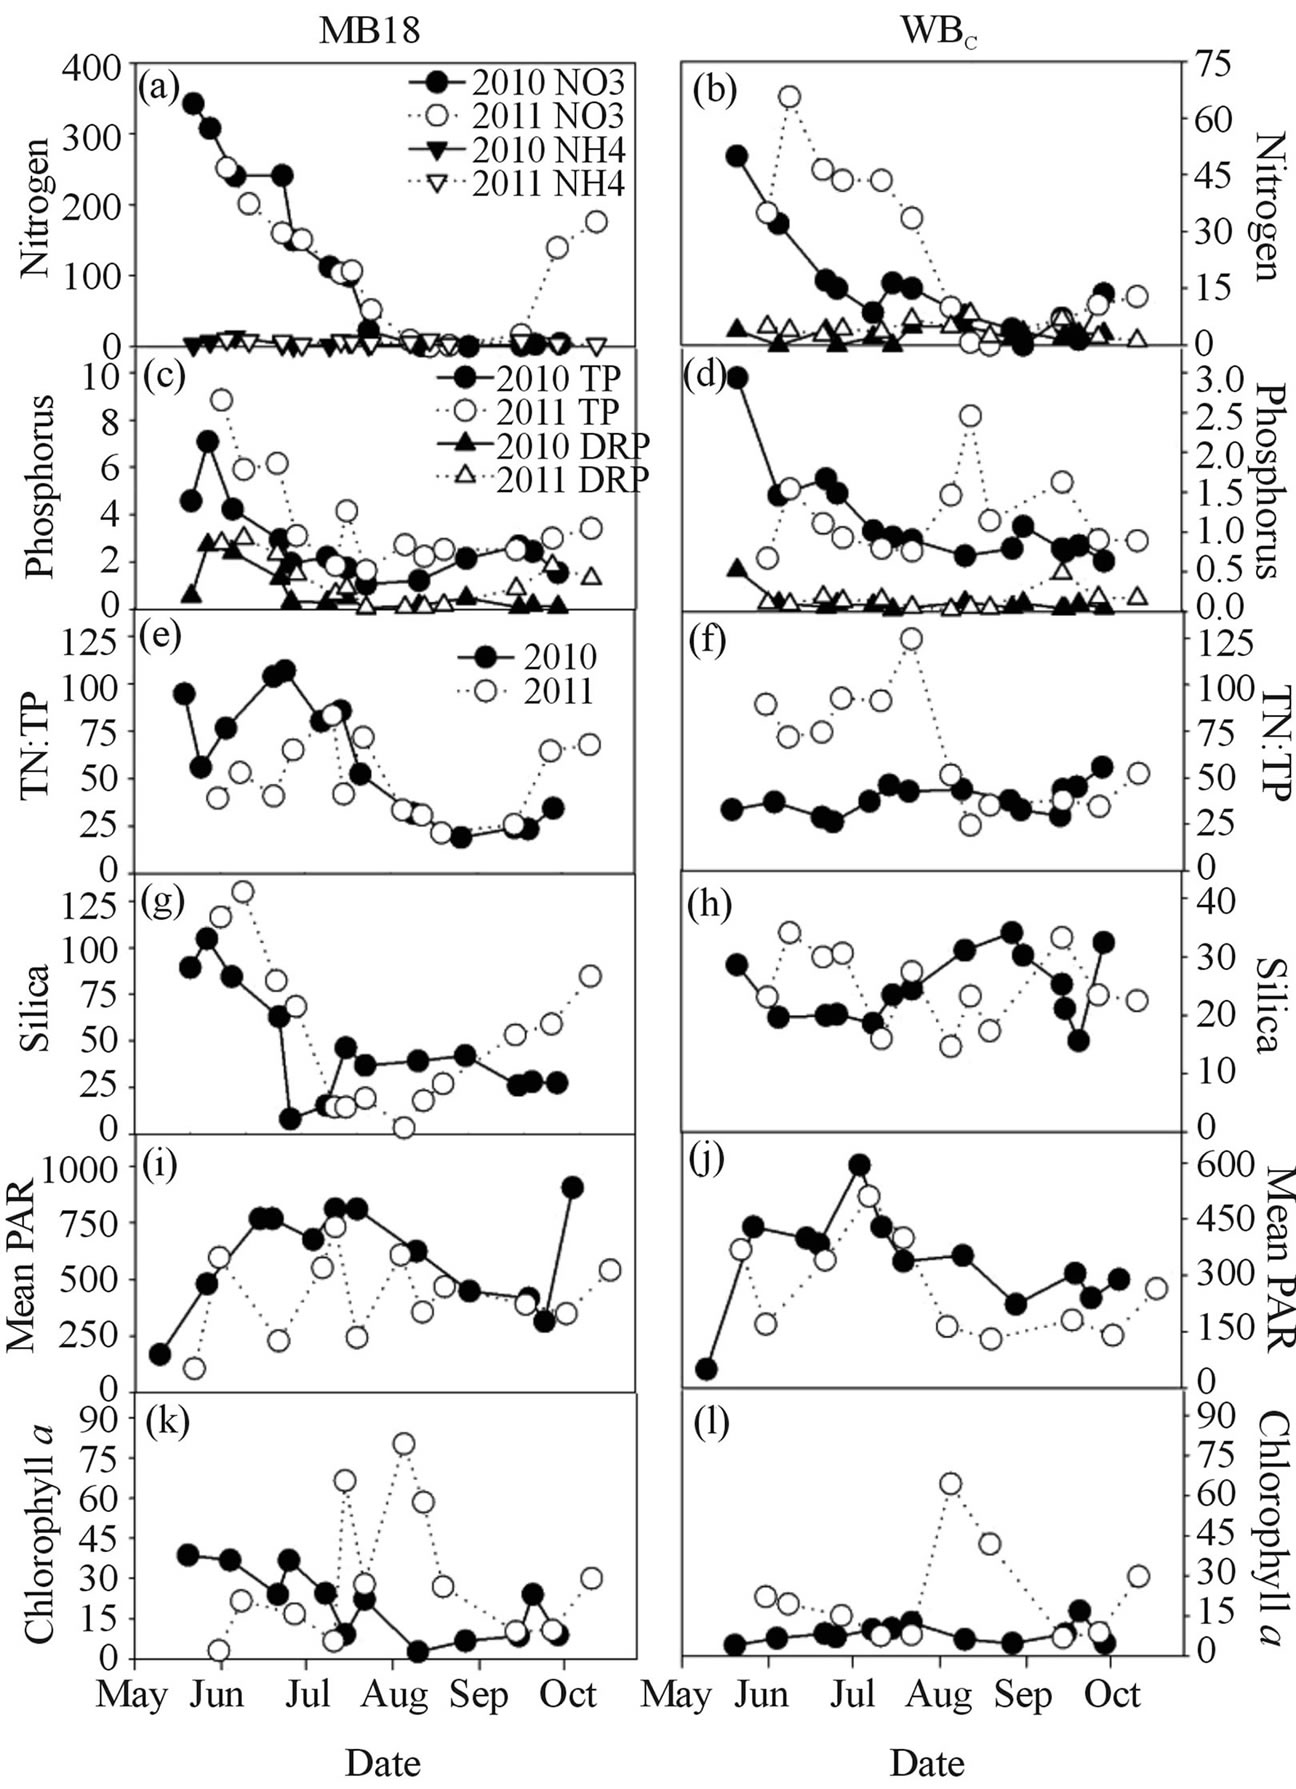
Figure 2. Ambient nutrient concentrations (in mmol/L), mean PAR, and chlorophyll a concentrations of Maumee Bay (left column; site MB18) and the center of the western basin (right column; site WBC) during 2010 and 2011.
ing early summer of both years and then were less than 1.0 mmol/L for the rest of the summer. Dissolved reactive P concentrations were much lower at WBC, with 24 of the 26 samples having DRP less than 0.20 mmol/L. Total phosphorus concentrations were high (>6.0 mmol/L) at MB18 in early summer both years then decreased to values ranging between 2 and 4 mmol/L for the rest of the summer. Total phosphorus concentrations were lower at WBC, with 24 of the 26 samples having TP less than 1.7 mmol/L. TN:TP was variable during among summers and sites, but lowest TN:TP values (<25, molar) occurred during mid-to-late summer and highest values (>100) occurred during early summer.
Mean PAR was generally greater at site MB18 than at WBC, and 2010 had higher levels than 2011 (Figures 2(i) and (j)). On the six of the eight occasions when water was collected for enrichment experiments, mean PAR at site WBC ranged between 250 and 450 mmol photon/m2/s, encompassing the 300 - 350 mmol photon/m2/s light level used in the incubations. Mean PAR at WBC was less than 150 mmol photon/m2/s during the 2011 cyanobacterial bloom. Mean PAR for site MB18 was more variable, ranging between 227 and 810 mmol photon/m2/s at time of water collection for the experiments.
Total chl a concentrations measured at site MB18 exceeded 25 mg/L during June and early July of 2010 (Figures 2(k) and (l)). Chl a concentrations at site MB18 from mid-July through October and all samples at WBC in 2010 were less than 20 mg/L. Highest total chl a concentrations were measured mid-July to mid-August 2011 with values that exceeded 50 mg/L at both sites.
3.2. Bioassay Enrichment Response
At site MB18 in 2010 (Figure 3) in June and July, chl a concentration increased from initial levels in the controls and treatments of all groups, except for the cryptophytes, and the July chl a response to P-only enrichment (+P) was 2× greater (p < 0.001) than control and N-only (+N). For all groups in August, the chl a response to +N was 2× to 3× greater (p < 0.001) than control and +P, but all groups except cyanobacteria had greatest chl a response to P and N (+P&N). In September, chl a concentrations of the green algae and diatoms increased during incubation but did not differ among treatments, while cyanobacteria and cryptophytes chl a was similar or less than initial levels, respectively.
At site WBC in 2010 during June and July, the chl a response of all groups, excluding cyanobacteria, to +P were 1.5× to 2× greater (p < 0.001) than control and +N (Figure 4). Initial cyanobacteria chl a concentration in June and July was less than 1 mg/L. In August, the chl a response of green algae and diatom to +P was significantly greater than control and +N and the response to +P&N was 2× greater (p < 0.001) than +P. Cyanobacteria
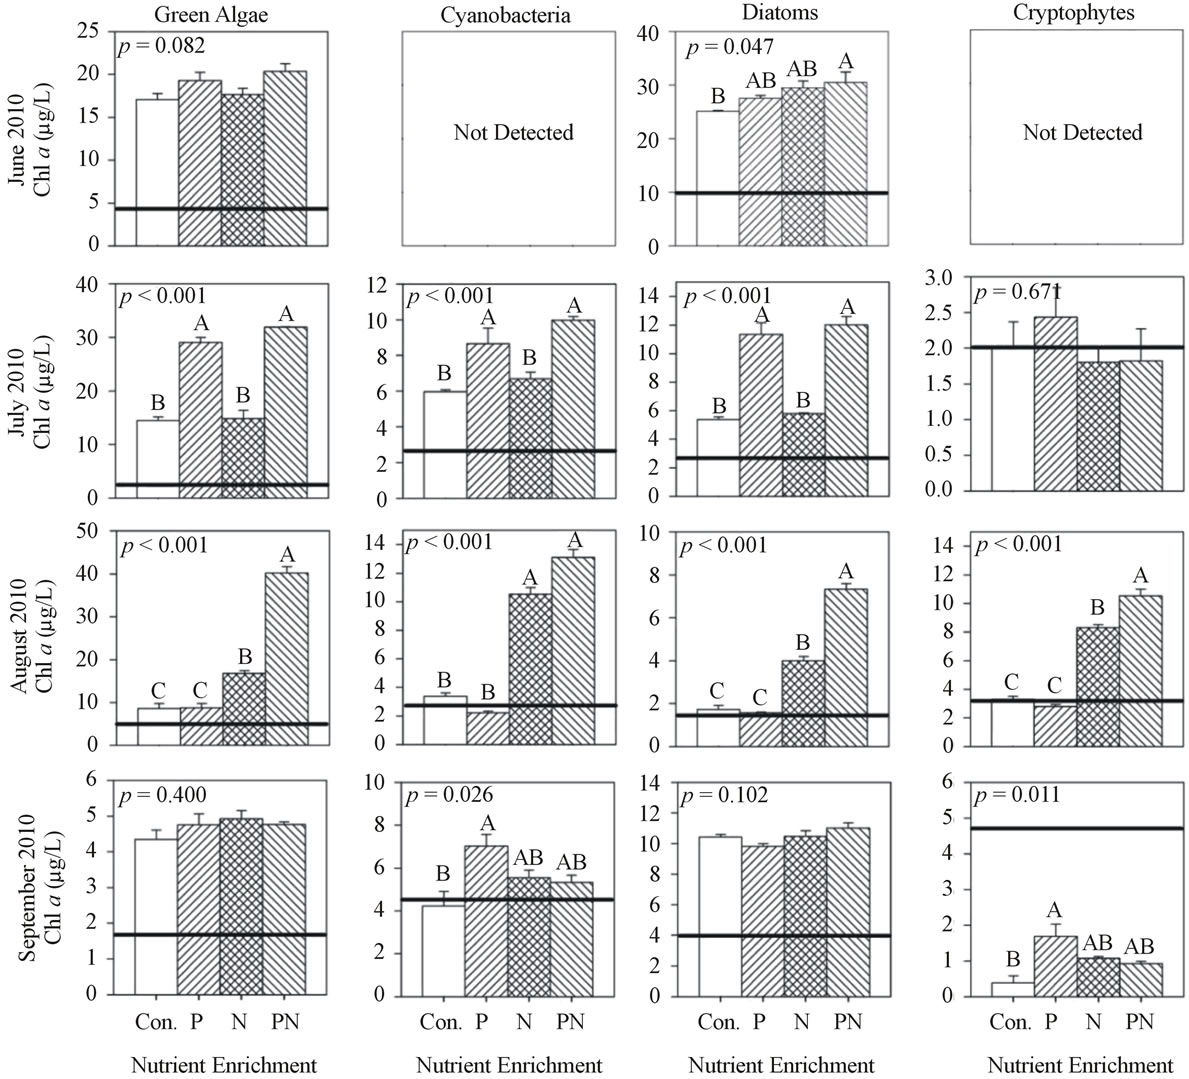
Figure 3. Chlorophyll a concentration of each algal group after incubation (48 h) and nutrient enrichment of site MB18 during 2010. Values are mean of three replicates and error bars represent the standard error of the mean. Initial chlorophyll a concentrations are indicated by the horizontal line. ANOVA p values are reported on each. Letters above each bar represent significance levels of the post hoc Tukey test. Identical letters indicate no difference among treatments (p > 0.05), while difference among different letters is significant (p < 0.05) and the means descend in alphabetical order (for example, the mean of A is greater than the mean of B).
and cryptophytes chl a response to +N was 1.4× greater than control and +P. In September, green algae chl a response to +P was 1.3× greater (p < 0.01) than control, while cyanobacteria and cryptophyte chl a response to +P&N was 2× greater (p < 0.05) than all other treatments.
At site MB18 in 2011, chl a concentration in June, July, and September increased during incubation but did not significantly differ among treatments and control (Figure 5). In August, cyanobacteria and cryptophytes chl a response to +N was 4× and 2× greater, respectively, (p < 0.01) than control and +P, and the chl a response to +P&N was 1.2× greater than +N.
At site WBC in 2011 during June and July, the chl a response of green algae and diatoms to +P was about 2× greater (p < 0.01) than control and +N (Figure 6). Chl a of cyanobacteria and cryptophytes did not respond to enrichment. In August, cyanobacteria and cryptophyte chl a response to +N was 2× greater (p < 0.01) than control and +P, and the response +P&N was 1.5× greater than +N. In September, diatom chl a response to +N was 2× greater (p < 0.05) than control and +P, and cyanobacteria and cryptophyte chl a did not differ among treatments.
3.3. Cyanobacteria Biovolume
Cyanobacteria biovolume was lowest during June of both years and both sites, and in general, 2011 had much greater biovolumes than 2010 (Figure 7). Microcystis was the dominant cyanobacterium during July and August of both years (>70% of total cyanobacteria biovolume). Anabaena became dominant in September 2010 (>90%) and co-dominant with Microcystis in August and
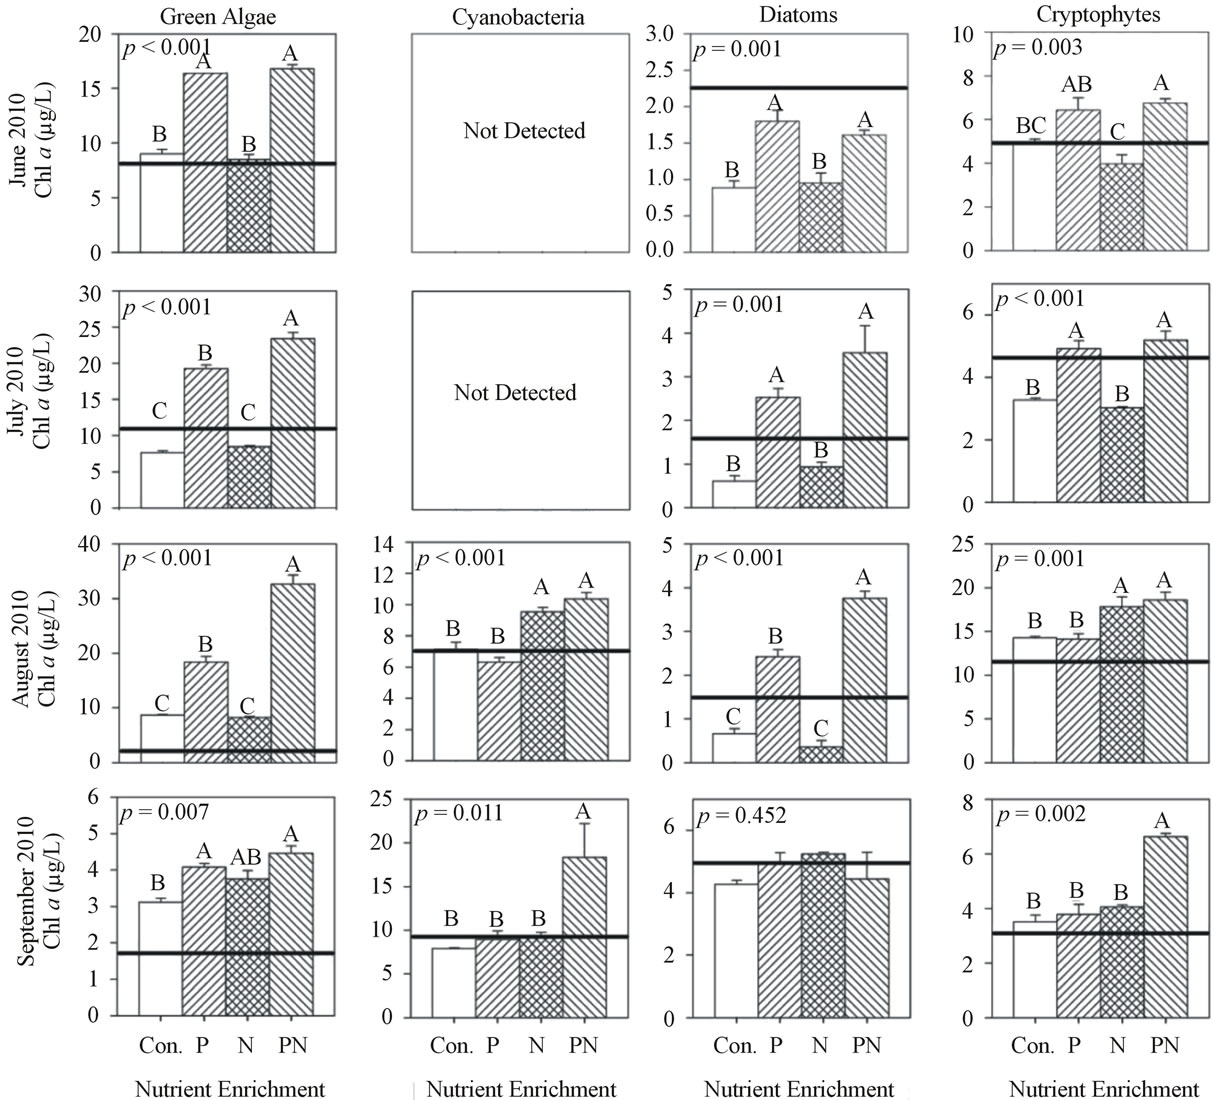
Figure 4. Chlorophyll a concentration of each algal group after incubation (48 h) and nutrient enrichment of site WBC during 2010. Values are mean of three replicates and error bars represent the standard error of the mean. Initial chlorophyll a concentrations are indicated by the horizontal line. ANOVA p values are reported on each. Letters above each bar represent significance levels of the post hoc Tukey test. Identical letters indicate no difference among treatments (p > 0.05), while difference among different letters is significant (p < 0.05) and the means descend in alphabetical order (for example, the mean of A is greater than the mean of B).
September 2011 (40% - 50%). Other cyanobacteria observed included Merismopedia, Chroococcus, and Planktothrix, but their biovolume was less than 5% that of Microcystis and Anabaena.
4. Discussion
4.1. P to N Limitation of Cyanobacteria
In June and July P enrichment stimulated chl a production of WBC phytoplankton, which indicates P-limitation. Phytoplankton chl a of site MB18 did not respond to P nor N enrichment, which was likely due to the high ambient concentrations of  (200 mmol/L) and DRP (3 mmol/L). During periods of rapid algal growth, inorganic N is likely to be depleted more rapidly than DRP [33]. Nitrate concentration decreased to levels less than 1 mmol/L by late August and
  concentration remained below 10 mmol/L (Figure 2), which resulted in chl a stimulation by N enrichment and indicates symptoms of N-limitation. Cyanobacteria biovolume was greater in August and September than June and July (Figure 7). Therefore, cyanobacteria growth during bloom conditions in Lake Erie was constrained by low N concentrations. Similar patterns have been reported in the much smaller hypereutrophic Lake Taihu [34]. Taken together, N-limitation of cyanobacterial blooms can occur in small and large lakes.
Analysis of the bioassays with the FluoroProbe allows for comparing and contrasting how each algal group responded to nutrient enrichment. The chl a response was similar among all groups in site MB18 in either year, indicating that all phytoplankton groups in Maumee Bay
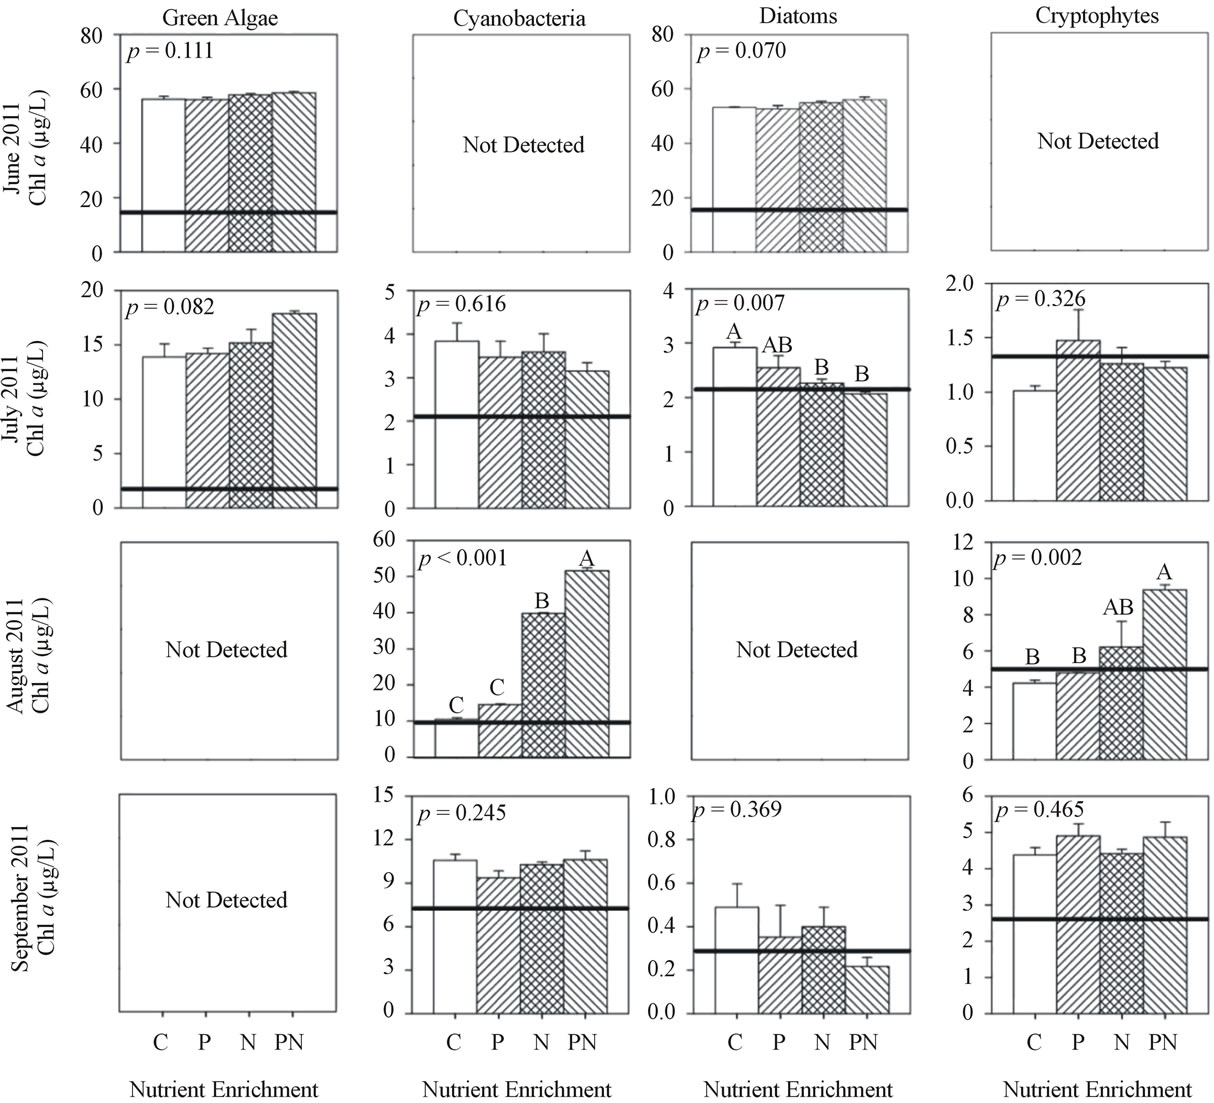
Figure 5. Chlorophyll a concentration of each algal group after incubation (48 h) and nutrient enrichment of site MB18 during 2011. Values are mean of three replicates and error bars represent the standard error of the mean. Initial chlorophyll a concentrations are indicated by the horizontal line. ANOVA p values are reported on each. Letters above each bar represent significance levels of the post hoc Tukey test. Identical letters indicate no difference among treatments (p > 0.05), while difference among different letters is significant (p < 0.05) and the means descend in alphabetical order (for example, the mean of A is greater than the mean of B).
were P-limited during early summer and then N-limited during late summer. Although silica limitation was not tested for, dissolved silica concentrations less than 6.5 mmol/L recorded at MB18 during mid-summer might indicate silica limitation among diatoms [35]. Site WBC algal groups showed considerable differences to P or N enrichment. Often a few groups were either P or N-limited, while another group was unaffected by N and P, indicating no limitation (e.g., in June 2010, July 2011, and September 2011). The limiting nutrient also differed among phytoplankton groups. In August 2010 cyanobacteria were N-limited while green algae and diatoms were P-limited. Cyanobacteria may store enough excess intracellular P to allow cellular growth for several days without extracellular P resources [36]. This might explain why cyanobacteria did not respond to P while green algae and diatoms required P. These results concurred with Lewis et al. [22] who suggested that P may limit one group while N limits another. Furthermore, nutrient limitation differed spatially, which was evident during early summer because MB18 phytoplankton did not respond to either P or N while the phytoplankton at WBC were P-limited. Therefore general statements regarding nutrient limitation in large lakes should recognize that nutrient limitation varies spatially, temporally, and even among phytoplankton taxa with regard to the key nutrients in question, usually P and N.
The results of the bioassays indicate symptoms of N-limitation during the cyanobacterial blooms. In contrast, the 2008 Microcystis bloom in Lake Erie was determined to be N-replete based on cellular ratios of carbon to N, in spite of  and
and  concentrations
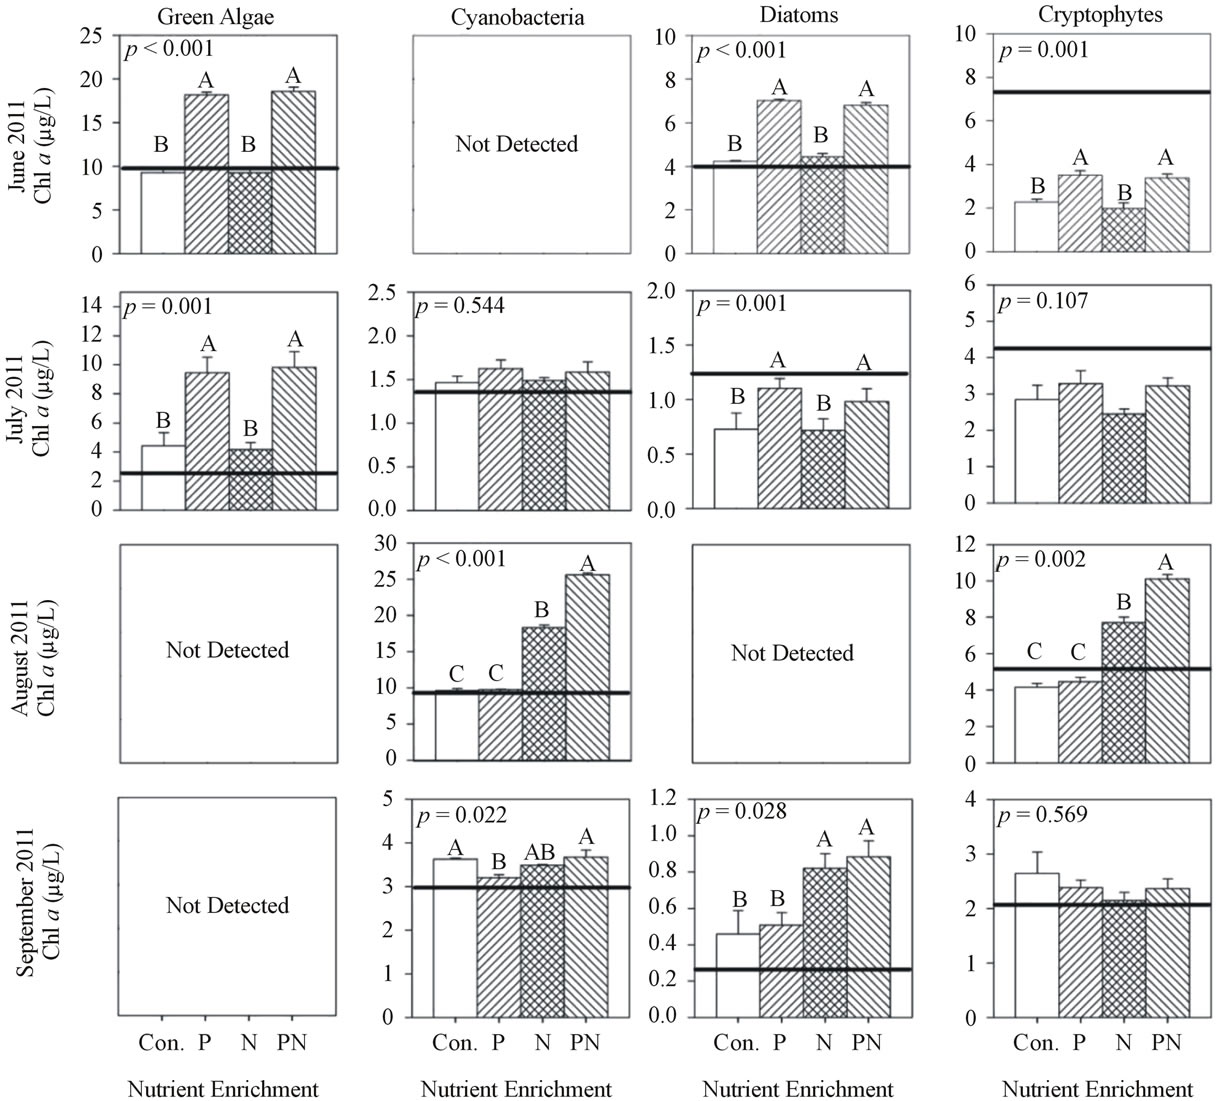
Figure 6. Chlorophyll a concentration of each algal group after incubation (48 h) and nutrient enrichment of site WBC during 2011. Values are mean of three replicates and error bars represent the standard error of the mean. Initial chlorophyll a concentrations are indicated by the horizontal line. ANOVA p values are reported on each. Letters above each bar represent significance levels of the post hoc Tukey test. Identical letters indicate no difference among treatments (p > 0.05), while difference among different letters is significant (p < 0.05) and the means descend in alphabetical order (for example, the mean of A is greater than the mean of B).
that were less than 10 mmol/L [21]. Furthermore, the N-fixing cyanobacterium Anabaena did not appear in 2008. Hence, it was unlikely that the low  and
and  concentrations measured in 2008 resulted in Nlimitation. Interestingly, during 2010 and 2011 Microcystis remained dominant for the first month of N-limitation, and then Anabaena became dominant during September. Ammonium regeneration from the lake sediment has been suggested as a means to support the nonN-fixing cyanobacterium Microcystis during N-limitation [11]. Furthermore, because P enrichment in the late summer experiments did not increase cyanobacteria chl a and N enrichment did, it is possible that the cyanobacterial blooms could be more severe if not for the N-limitation.
Human activities have nearly doubled the amount of reactive N in ecosystems by anthropogenic N fixation [37,38]. Recently, regulating both N and P to control eutrophication has had support [9-11] while others are in favor of P only control [8,39,40]. N-fixation in Lake Erie was documented during the Anabaena blooms of 2010 and 2011 (Bade unpublished data), but it is unknown if N-fixation can offset N deficiencies in small lakes [41,42] and for Lake Erie, a large lake.
Iron is important for the assimilation of  by phytoplankton [43], and low iron concentration in the eastern basin of Lake Erie was shown to induce a Nlimitation [44]. However, in western Lake Erie iron concentrations are elevated due to the inflow of the Maumee River [45]. Furthermore, iron enrichment to Maumee Bay water during cyanobacterial blooms did not result in additional N uptake compared no iron enrichments [46]. Thus, the N-limitation observed in our study was likely
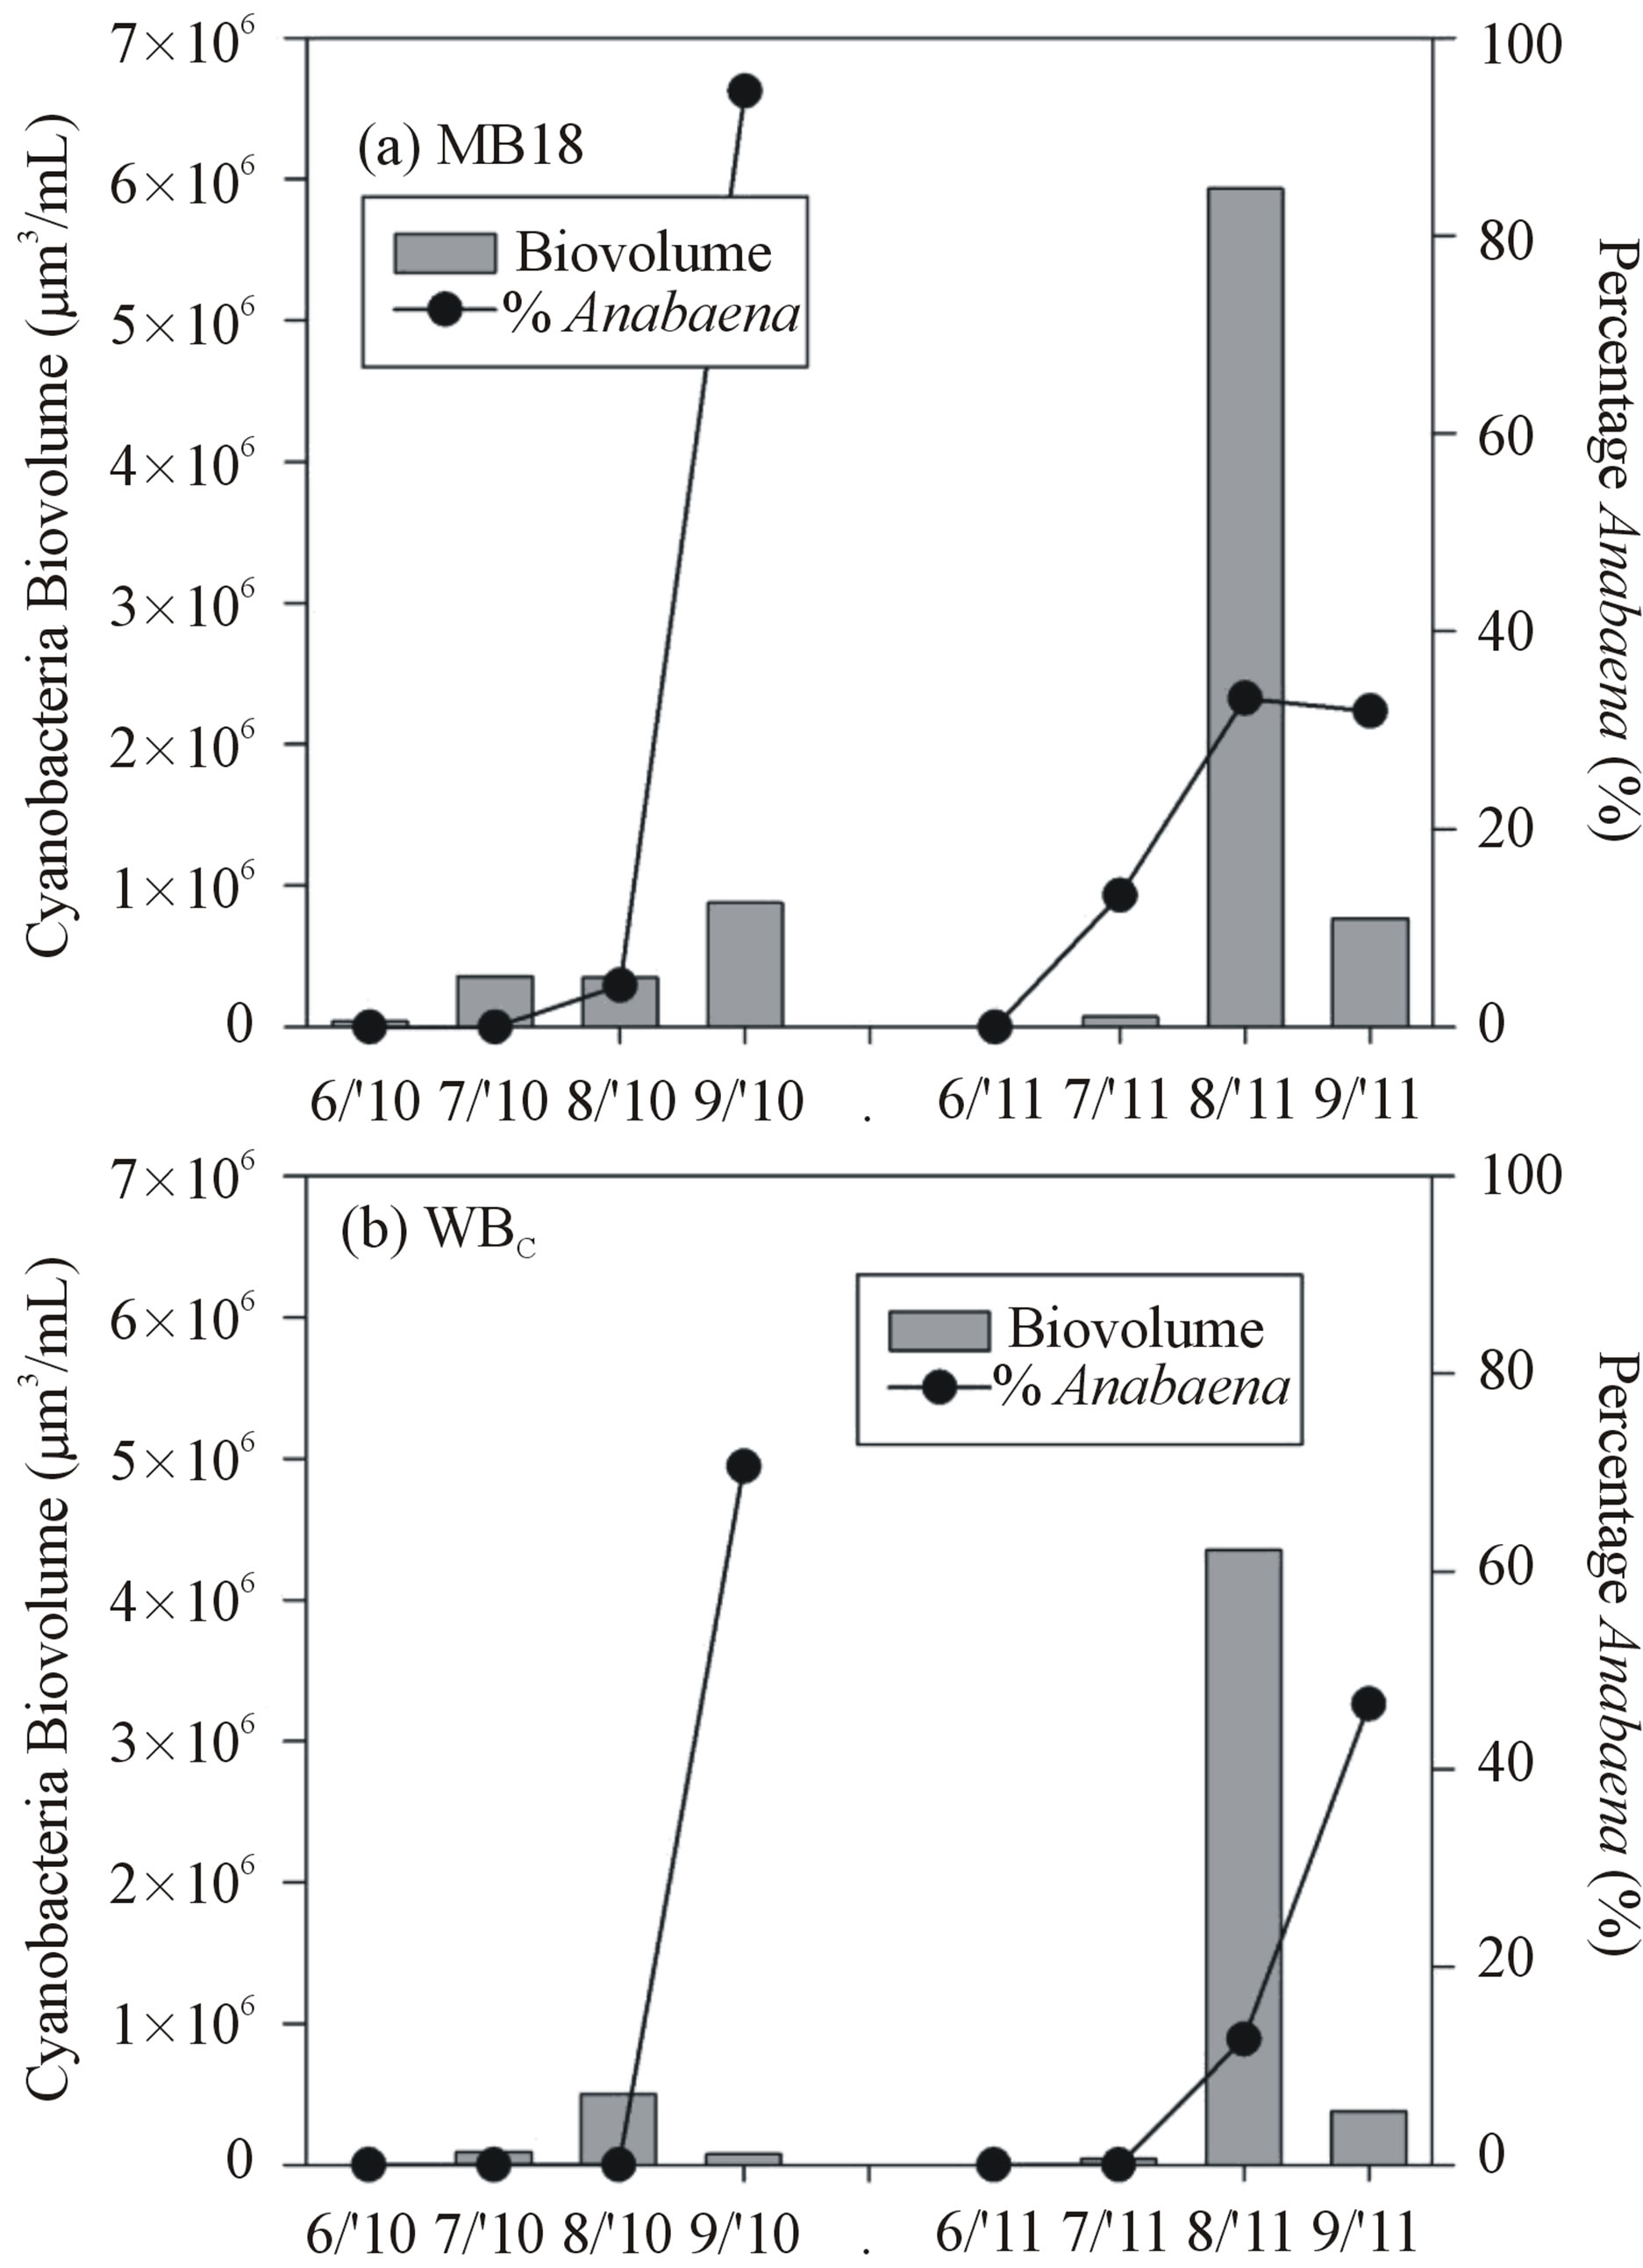
Figure 7. Total cyanobacteria biovolume (bars) and percent Anabaena of total cyanobacteria biovolume (lines) present in the lake at time of collection for nutrient enrichment experiment. Top (a) is site MB18 and bottom (b) is site WBC.
due to low concentrations of  and
and  rather than low iron availability.
4.2. Physical Factors
In addition to nutrients, physical factors can affect phytoplankton dynamics. For example, weak lake circulation acted together with high P loading to result in the large 2011 bloom [18]. Positively buoyant cyanobacteria like Microcystis and Anabaena benefit from poor circulation because they can remain in sunlight at the surface while negatively buoyant phytoplankton sink out of the photic zone [47]. During the 2011 cyanobacterial bloom, green algae and diatoms were not detected by the FluoroProbe and the mean PAR was less than 150 mmol photon/m2/s (Figure 2). Light-limitation of the green algae and diatoms is a likely reason why they were not detected during the 2011 bloom.
Light climate can affect phytoplankton pigment content [48]. Site WBC had a mean PAR (Figure 2) that was similar to the light intensity used for incubations (300 - 350 mmol photon/m2/s). Site MB18 had relatively high mean PAR (>623 mmol photon/m2/s) during the June, July, and August 2010 experiments. If phytoplankton altered pigment content in response to lower light levels in the growth chamber, we would have expected that control chl a concentration would increase. Control chl a increased in the June and July 2010 enrichments but not in the August 2010 enrichment (Figure 3). Furthermore, chl a increased in controls of site MB18 during the September 2010 and June, July, and September 2011 enrichments when mean PAR (242 - 415 mmol photon/m2/s) was similar to the incubation intensity. Thus, the chl a increase in controls was more likely due to high dissolved nutrients (Figure 2), which allowed for continued phytoplankton growth, rather than undersaturating light levels in the growth chambers.
5. Conclusion
Nutrient limitation of western Lake Erie phytoplankton varied in the summer, spatially, and among phytoplankton groups. High DRP concentrations (>3 mmol/L) in June and July met the phytoplankton growth demand for P in Maumee Bay. Minimizing early summer P loads should be top priority. Then in August and September, low  and
and  concentrations (<10 mmol/L) resulted in N-limitation. These results indicate that the late summer cyanobacteria during bloom conditions were constrained by N, and additional N loading may exacerbate blooms in this large lake. Further research is needed to determine if targeting N in addition to P could augment the impacts of P regulations aimed at reducing cyanobacterial blooms.
6. Acknowledgements
We are very grateful for the assistance of Sarah Panek, Courtney Mobilian, Peter Bichier, Stephanie Messa, and Kristen Woodling who helped us collect the water, set up the experiment, terminate the experiment, and conduct chlorophyll analysis during this project. The 2010 experiments were conducted using the growth chamber in Dr. Christine Mayer’s lab. Chlorophyll analyses were conducted in Dr. Scott Heckathorn’s lab. We thank Christian Moldaenke for assistance validating the FluoroProbe measurements. Finally, we thank anonymous reviewers who helped us improve this manuscript. This project was funded in part through the Lake Erie Protection Fund (SG 406-2011) and by the National Science Foundation under Grant No. 1039043.
REFERENCES
- V. H. Smith, “Eutrophication of Freshwater and Coastal Marine Ecosystems a Global Problem,” Environmental Science and Pollution Research, Vol. 10, No. 2, 2003, pp. 126-139. http://dx.doi.org/10.1065/espr2002.12.142
- J. D. Brookes and C. C. Carey, “Resilience to Blooms,” Science, Vol. 334, No. 6052, 2011, pp. 46-47. http://dx.doi.org/10.1126/science.1207349
- J. Huisman, H. C. P. Matthijs and P. M. Visser, “Harmful Cyanobacteria,” Kluwer Academic Publisher, Norwell, 2005.
- W. K. Dodds, W. W. Bouska, J. L. Eitzmann, et al., “Eutrophication of US Freshwaters: Analysis of Potential Economic Damages,” Environmental Science & Technology, Vol. 43, No. 1, 2008, pp. 12-19. http://dx.doi.org/10.1021/es801217q
- D. W. Schindler, “Evolution of Phosphorus Limitation in Lakes,” Science, Vol. 195, No. 4275, 1977, pp. 260-262. http://dx.doi.org/10.1126/science.195.4275.260
- J. A. Downing, S. B. Watson and E. McCauley, “Predicting Cyanobacteria Dominance in Lakes,” Canadian Journal of Fisheries and Aquatic Sciences, Vol. 58, No. 10, 2001, pp. 1905-1908. http://dx.doi.org/10.1139/f01-143
- C. L. Schelske, “Eutrophication: Focus on Phosphorus,” Science, Vol. 324, No. 5928, 2009, p. 722. http://dx.doi.org/10.1126/science.324_722
- D. W. Schindler, “The Dilemma of Controlling Cultural Eutrophication of Lakes,” Proceedings of the Royal Society B: Biological Sciences, 2012, pp. 1-12
- W. M. Lewis and W. A. Wurtsbaugh, “Control of Lacustrine Phytoplankton by Nutrients: Erosion of the Phosphorus Paradigm,” International Review of Hydrobiology, Vol. 93, No. 4-5, 2008, pp. 446-465. http://dx.doi.org/10.1002/iroh.200811065
- D. J. Conley, H. W. Paerl, R. W. Howarth, et al., “Controlling Eutrophication: Nitrogen and Phosphorus,” Science, Vol. 323, No. 5917, 2009, pp. 1014-1015. http://dx.doi.org/10.1126/science.1167755
- H. W. Paerl, H. Xu, M. J. McCarthy, et al., “Controlling Harmful Cyanobacterial Blooms in a Hyper-Eutrophic Lake (Lake Taihu, China): The Need for a Dual Nutrient (N & P) Management Strategy,” Water Research, Vol. 45, No. 5, 2011, pp. 1973-1983. http://dx.doi.org/10.1016/j.watres.2010.09.018
- J. A. Downing and E. McCauley, “The Nitrogen: Phosphorus Relationship in Lakes,” Limnology and Oceanography, Vol. 37, No. 5, 1992, pp. 936-945. http://dx.doi.org/10.4319/lo.1992.37.5.0936
- S. J. Guildford and R. E. Hecky, “Total Nitrogen, Total Phosphorus, and Nutrient Limitation in Lakes and Oceans: Is There a Common Relationship?” Limnography and Oceanography, Vol. 45, No. 6, 2000, pp. 1213-1223. http://dx.doi.org/10.4319/lo.2000.45.6.1213
- R. P. Stumpf, T. T. Wynne, D. B. Baker and G. L. Fahnenstiel, “Interannual Variability of Cyanobacterial Blooms in Lake Erie,” PloS One, Vol. 7, No. 8, 2012, Article ID: e42444. http://dx.doi.org/10.1371/journal.pone.0042444
- T. B. Bridgeman, J. D. Chaffin and J. E. Filbrun, “A Novel Method for Tracking Western Lake Erie Microcystis Blooms, 2002-2011,” Journal of Great Lakes Research, Vol. 39, No. 1, 2013, pp. 83-89. http://dx.doi.org/10.1016/j.jglr.2012.11.004
- C. E. Herdendorf, “Large Lakes of the World,” Journal of Great Lakes Research, Vol. 8, No. 3, 1982, pp. 379-412. http://dx.doi.org/10.1016/S0380-1330(82)71982-3
- S. J. Bolsenga and C. E. Herdendorf, “Lake Erie and Lake Saint Clair handbook,” Wayne State University Press, 1993.
- A. M. Michalak, E. J. Anderson, D. Beletsky, et al., “Record-setting Algal Bloom in Lake Erie Caused by Agricultural and Meteorological Trends Consistent with Expected Future Conditions,” Proceedings of the National Academy of Sciences, 2013, Vol. 110, No. 16, pp. 6448- 6452. http://dx.doi.org/10.1073/pnas.1216006110
- D. B. Baker and R. P. Richards, “Phosphorus Budgets and Riverine Phosphorus Export in Northwestern Ohio Watersheds,” Journal of Environmental Quality, Vol. 31, No. 1, 2002, pp. 96-108. http://dx.doi.org/10.2134/jeq2002.0096
- H. Han, N. Bosch and J. D. Allan, “Spatial and Temporal Variation in Phosphorus Budgets for 24 Watersheds in the Lake Erie and Lake Michigan Basins,” Biogeochemistry, Vol. 102, 2011, pp. 45-58. http://dx.doi.org/10.1007/s10533-010-9420-y
- J. D. Chaffin, T. B. Bridgeman, S. A. Heckathorn and S. Mishra, “Assessment of Microcystis Growth Rate Potential and Nutrient Status Across a Trophic Gradient in Western Lake Erie,” Journal of Great Lakes Research, Vol. 37, No. 1, 2011, pp. 92-100. http://dx.doi.org/10.1016/j.jglr.2010.11.016
- W. M. Lewis, W. A. Wurtsbaugh and H. W. Paerl, “Rationale for Control of Anthropogenic Nitrogen and Phosphorus to Reduce Eutrophication of Inland Waters,” Environmental Science & Technology, Vol. 45, No. 24, 2011, pp. 10300-10305. http://dx.doi.org/10.1021/es202401p
- T. B. Bridgeman, J. D. Chaffin, D. D. Kane, J. D. Conroy, S. E. Panek and P. M. Armenio, “From River to Lake: Phosphorus Partitioning and Algal Community Compositional Changes in Western Lake Erie,” Journal of Great Lakes Research, Vol. 38, No. 1, 2012, pp. 90-97. http://dx.doi.org/10.1016/j.jglr.2011.09.010
- S. J. Guildford, R. E. Hecky, R. E. H. Smith, et al., “Phytoplankton Nutrient Status in Lake Erie in 1997,” Journal of Great Lakes Research, Vol. 31, Suppl. 2, 2005, pp. 72-88. http://dx.doi.org/10.1016/S0380-1330(05)70306-3
- R. P. Richards, D. B. Baker, J. P. Crumrine and A. M. Stearns, “Unusually Large Loads in 2007 from the Maumee and Sandusky Rivers, Tributaries to Lake Erie,” Journal of Soil and Water Conservation, Vol. 65, No. 6, 2010, pp. 450-462. http://dx.doi.org/10.2489/jswc.65.6.450
- R. G. Wetzel and G. E. Likens, “Limnological Analyses,” Springer Verlag, 2000.
- T. W. Davis, F. Koch, M. A. Marcoval, et al., “Mesozooplankton and Microzooplankton Grazing during Cyanobacterial Blooms in the Western Basin of Lake Erie,” Harmful Algae, Vol. 15, 2012, pp. 26 - 35. http://dx.doi.org/10.1016/j.hal.2011.11.002
- C. L. Schelske, “In Situ and Natural Phytoplankton Assemblage Bioassays,” In: L. E. Shubert, Ed., Algae as Ecolgocial Indicators, Academic Press, Cambridge, 1984, pp. 15-47.
- J. B. Moon and H. J. Carrick, “Seasonal Variation of Phytoplankton Nutrient Limitation in Lake Erie,” Aquatic Microbial Ecology, Vol. 48, No. 1, 2007, pp. 61-71. http://dx.doi.org/10.3354/ame048061
- M. Beutler, K. H. Wiltshire, B. Meyer, et al., “A Fluorometric Method for the Differentiation of Algal Populations In Vivo and in Situ,” Photosynthesis Research, Vol. 72, No. 1, 2002, pp. 39-53. http://dx.doi.org/10.1023/A:1016026607048
- M. R. Twiss, C. Ulrich, S. A. Kring, et al., “Plankton Dynamics along a 180 km Reach of the Saint Lawrence River from Its Headwaters in Lake Ontario,” Hydrobiologia, Vol. 647, No. 1, 2010, pp. 7-20. http://dx.doi.org/10.1007/s10750-010-0115-0
- J. D. Chaffin, T. B. Bridgeman, S. A. Heckathorn and A. E. Krause, “Role of Suspended Sediments and Mixing in Reducing Photoinhibition in the Bloom-Forming Cyanobacterium Microcystis,” Journal of Water Resource and Protection, Vol. 04, No. 12, 2012, pp. 1029-1041. http://dx.doi.org/10.4236/jwarp.2012.412119
- H. S. Kim, S. J. Hwang, J. K. Shin, et al., “Effects of Limiting Nutrients and N: P Ratios on the Phytoplankton Growth in a Shallow Hypertrophic Reservoir,” Hydrobiologia, Vol. 581, No. 1, 2007, pp. 255-267. http://dx.doi.org/10.1007/s10750-006-0501-9
- H. Xu, H. W. Paerl, B. Qin, et al., “Nitrogen and Phosphorus Inputs Control Phytoplankton Growth in Eutrophic Lake Taihu, China,” Limnology and Oceanography, Vol. 55, No. 1, 2010, pp. 420-432. http://dx.doi.org/10.4319/lo.2010.55.1.0420
- C. L. Schelske, E. F. Stoermer, G. L. Fahnenstiel and M. Haibach, “Phosphorus Enrichment, Silica Utilization, and Biogeochemical Silica Depletion in the Great Lakes,” Canadian Journal of Fisheries and Aquatic Sciences, Vol. 43, No. 2, 1986, pp. 407-415. http://dx.doi.org/10.1139/f86-051
- S. F. Baldia, A. D. Evangelista, E. V. Aralar and A. E. Santiago, “Nitrogen and Phosphorus Utilization in the Cyanobacterium microcystis aeruginosa Isolated from Laguna de Bay, Philippines,” Journal of Applied Phycology, Vol. 19, No. 6, 2007, pp. 607-613. http://dx.doi.org/10.1007/s10811-007-9209-0
- P. M. Vitousek, J. D. Aber, R. W. Howarth, G. E. Likens, P. A. Matson, D. W. Schindler, W. H. Schlesinger and D. G. Tilman, “Human Alteration of the Global Nitrogen Cycle: Sources and Consequences,” Ecological Applications, Vol. 7, No. 3, 1997, pp. 737-750.
- J. N. Galloway, F. J. Dentener, D. G. Capone, et al., “Nitrogen Cycles: Past, Present, and Future,” Biogeochemistry, Vol. 70, No. 2, 2004, pp. 153-226. http://dx.doi.org/10.1007/s10533-004-0370-0
- M. J. Paterson, D. W. Schindler, R. E. Hecky, et al., “Comment: Lake 227 Shows Clearly That Controlling Inputs of Nitrogen Will Not Reduce or Prevent Eutrophication of Lakes,” Limnology and Oceanography, Vol. 56, No. 4, 2011, pp. 1545-1547. http://dx.doi.org/10.4319/lo.2011.56.4.1545
- D. W. Schindler and R. E. Hecky, “Eutrophication: More Nitrogen Data Needed,” Science, Vol. 324, No. 5928, 2009, pp. 721-722. http://dx.doi.org/10.1126/science.324_721b
- D. W. Schindler, R. E. Hecky, D. L. Findlay, et al., “Eutrophication of Lakes Cannot Be Controlled by Reducing Nitrogen Input: Results of a 37-year Whole-Ecosystem Experiment,” Proceedings of the National Academy of Sciences of the United States of America, Vol. 105, No. 32, 2008, pp. 11254-11258. http://dx.doi.org/10.1073/pnas.0805108105
- J. T. Scott and M. J. McCarthy, “Response to Comment: Nitrogen Fixation Has Not Offset Declines in the Lake 227 Nitrogen Pool and Shows That Nitrogen Control Deserves Consideration in Aquatic Ecosystems,” Limnology and Oceanography, Vol. 56, No. 4, 2011, pp. 1548-1550. http://dx.doi.org/10.4319/lo.2011.56.4.1548
- E. Flores and A. Herrero, “Nitrogen Assimilation and Nitrogen Control in Cyanobacteria,” Biochemical Society Transactions, Vol. 33, No. 1, 2005, pp. 164-167. http://dx.doi.org/10.1042/BST0330164
- R. L. North, S. J. Guildford, R. E. H. Smith, et al., “Evidence for Phosphorus, Nitrogen, and Iron Colimitation of Phytoplankton Communities in Lake Erie,” Limnology and Oceanography, Vol. 52, No. 1, 2007, pp. 315-328. http://dx.doi.org/10.4319/lo.2007.52.1.0315
- S. M. Havens, C. S. Hassler, R. L. North, et al., “Iron Plays a Role in Nitrate Drawdown by Phytoplankton in Lake Erie Surface Waters as Observed in Lake-Wide Assessments,” Canadian Journal of Fisheries and Aquatic Sciences, Vol. 69, No. 2, 2012, pp. 369-381. http://dx.doi.org/10.1139/f2011-157
- J. D. Chaffin and T. B. Bridgeman, “Organic and Inorganic Utilization by Nitrogen-Stressed Cyanobacteria during Bloom Conditions,” Journal of Applied Phycology, accepted. http://dx.doi.org/10.1007/s10811-013-0118-0
- J. Huisman, J. Sharples, J. M. Stroom, et al., “Changes in Turbulent Mixing Shift Competition for Light Between Phytoplankton Species,” Ecology, Vol. 85, No. 11, 2004, pp. 2960-2970. http://dx.doi.org/10.1890/03-0763
- H. L. MacIntyre, T. M. Kana, T. Anning and R. J. Geider, “Photoacclimation of Photosynthesis Irradiance Response Curves and Photosynthetic Pigments in Microalgae and Cyanobacteria,” Journal of Phycology, Vol. 38, No. 1, 2002, pp. 17-38. http://dx.doi.org/10.1046/j.1529-8817.2002.00094.x
NOTES
*Corresponding author.