Open Journal of Medical Psychology
Vol.2 No.4(2013), Article ID:38261,7 pages DOI:10.4236/ojmp.2013.24023
Racial Provocation Induces Cortisol Responses in African-Americans*
1Center for the Study of Chronic Illness and Disability, George Mason University, Fairfax, USA
2Department of Military and Emergency Medicine, Uniformed Services University of the Health Sciences, Bethesda, USA
Email: aweinst2@gmu.edu
Copyright © 2013 Ali A. Weinstein et al. This is an open access article distributed under the Creative Commons Attribution License, which permits unrestricted use, distribution, and reproduction in any medium, provided the original work is properly cited.
Received June 21, 2013; revised July 21, 2013; accepted July 28, 2013
Keywords: Mental Stress; Racial Stressors; Ethnicity; Cardiovascular Disease
ABSTRACT
Purpose: To examine salivary cortisol responses to a racially-charged stimulus in a group of African-American individuals. Methods: A nonrandom sample of 245 (age: 43.8 ± 11.1 years; 64% female) African-American individuals was recruited by advertisements. Specifically, salivary cortisol was assessed prior to and after being exposed to a racially-charged movie clip. In addition, the salivary cortisol was assessed in the morning and evening of the day following exposure to the racially-charged movie clip. Results: A statistically significant increase in cortisol was found (P < 0.005) in the whole sample. High cortisol responders (highest tertile) and low cortisol responders (lowest tertile) were compared. The high cortisol responders had an elevated cortisol level the following morning (P < 0.05) that abated by the evening sample (P > 0.20). In addition, the high cortisol responders who were younger, had lower waist to hip ratios, and experienced less lifetime discrimination than the low cortisol responders (P’s < 0.05). Conclusions: The findings of an increase in cortisol in response to a racial provocation may provide a potential explanatory factor for the increased rates of cardiovascular disease in African-American individuals.
1. Introduction
In the United States, major disparities in the prevalence and incidence of cardiovascular disease exist among racial and ethnic groups [1-4]. Specifically, AfricanAmerican individuals suffer from cardiovascular disease more often than non-Hispanic Euro-American individuals [5]. This health disparity challenges researchers to discern differences in the genesis and perpetuation of the disease between the ethnicities/races.
A growing body of research implicates psychosocial risk factors (i.e., hostility, depression, social isolation, stress, and low socioeconomic status) in the etiology, pathogenesis and course of cardiovascular disease [6]. An enhanced hypothalamic-pituitary-adrenal (HPA) axis response to stress is prominent among the mechanisms regularly cited as potential mediators for the healthdamaging effects of psychosocial risk factors. One of the end products of the HPA axis is cortisol release.
For example, high levels of hostility have been associated with increased cortisol responses to anger-inducing interpersonal challenges [7]. Increased stress in daily life is associated with a higher cortisol awakening response and higher mean day and evening cortisol levels [8]. Increased HPA activation by stress has been implicated in the pathogenesis of the metabolic syndrome [9], and elevated cortisol levels have been shown to mediate the association between depressive symptoms and elevated blood glucose levels [10]. Recent prospective studies provide direct evidence for a causal role, so that glucocorticoid excess predicts increased cardiovascular disease (CVD) incidence [11,12].
However, these investigations do not provide an explanation for the increased rate of cardiovascular disease in African-American individuals, unless there is a differential rate of these factors. A relationship between socioeconomic status and race has been demonstrated, but it does not wholly explain the cardiovascular disease disparity [13]. The literature does not seem to show significant differences in hostility, depression, social isolation, and stress when comparing African-American individuals and non-African-American individuals [14].
Another psychosocial factor that could potentially be an explanatory factor is exposure to racism. Racism has been reported to prevail as a primary stressor facing African-American individuals [15]. Recent studies have suggested that exposure to the chronic stress of racism, prejudice, and discrimination may contribute to the disproportionately high rates of cardiovascular disease among African-American individuals [16-18]. However, the relationship between exposure to racism and cortisol reactivity has not been thoroughly investigated.
Given that laboratory-induced stressors may characterize cortisol reactivity that predicts future cardiovascular disease [19-21], the present study investigated Salivary cortisol reactivity to a racial provocation (raciallycharged movie clip). We hypothesized that AfricanAmerican individuals would have an increase in cortisol in response to this stimulus. In addition, we hypothesized that the highest cortisol responders would have higher levels of cardiovascular disease risk factors than the lowest cortisol responders. If these hypotheses were supported, this would be a first step in implicating the combination of racial stress and cortisol as important potential mechanisms to partially explain the disproportionately high rate of cardiovascular disease (CVD) in African-American individuals.
2. Methods
2.1. Participants
African-American males and females between the ages of 18 and 60 were recruited from the Washington DC metropolitan area community. The participants selfidentified as African-American during the screening process for the research study. Participants were excluded from participation if they were pregnant. These participants were recruited using advertisements in local newspapers, flyers posted in the community, and website-based recruiting sites (such as Craig’s List). Participants were completely informed as to the nature of the study and signed an informed consent document if they wished to participate. The research was reviewed and approved by the Institutional Review Board of the Uniformed Services University of the Health Sciences. A total sample of 245 participants was recruited for this investigation.
2.2. Procedures
After arriving at the testing location, participants completed a medical history and demographic information questionnaire (ethnicity, education, income), as well as various other questionnaires (discussed in detail below). In addition, participant assessments consisted of anthropometric measures (weight, height, waist and hip circumferences, and percent body fat), blood pressure, and blood draws for fasting lipid profiles (total cholesterol, triglycerides, high density cholesterol (HDL)), and blood glucose level. After adjusting to the laboratory setting, participants individually watched a 15-minute clip of the movie Amistad. The particular portion of the movie that was viewed involved the capture of Africans who were then taken to America by European white individuals as slaves: the clip challenges the concept of freedom and racial prejudice. Saliva samples were collected prior to and at the completion of viewing the movie. In addition, participants were sent home with saliva collection tubes and were asked to provide additional saliva samples as soon as they woke up the next day (or by 8:00 am, whichever came first) and between 5 - 6 pm in the evening on the following day. The saliva samples were analyzed for cortisol and dehydroepiandrosterone sulfate (DHEAS).
2.3. Assessments
2.3.1. Saliva Parameters
Cortisol and DHEAS were assessed from saliva samples. Before giving a saliva sample, participants rinsed their mouths with cold water and placed a cotton roll under their tongues for 5 - 7 minutes. The at-home samples were returned to investigators via mailed pre-stamped envelopes. Samples were frozen at −80˚C freezer. Vials were sent to Diagnos-Tech Inc. (Tukwila, WA, USA) for analyses by enzyme linked immunoassay (EIA) procedures.
2.3.2. Blood Parameters
Fasting blood was collected between 0800 and 0900 hr. The participants were asked to avoid eating after midnight the night before the session. A trained technician collected samples in anti-coagulant tubes for the lipid profiles. Plasma was extracted and stored in a −80˚C freezer. Lipid profiles were determined at the National Institutes of Health (NIH) Department of Laboratory Medicine by using a LX-20 analyzer (Beckman, San Diego, California). Blood glucose concentration was measured with the OneTouch Ultra by Life Scan, Inc (Milpitas, CA).
2.3.3. Blood Pressure
One hour resting blood pressure and heart rate were taken in the supine position with the Criticare Systems automatic blood pressure machine (model 506N3; Waukesha, WI, USA). Blood pressure was immediately re-assessed at the conclusion of the racial provocation. Mean arterial pressure (MAP) was calculated from the systolic and diastolic blood pressure measurements [22].
2.3.4. Anthropometric Measures
Body-mass index (BMI) was calculated from the anthropometric measures as weight in kilograms as divided by height in squared in meters. Weight and height were taken with participants in light clothing using the Cardinal Detecto Physician’s Scale. Percent body fat was calculated from bioelectric impedance (RJL Systems portable body composition analyzer) by using the National Health and Nutrition Examination Survey formula [23].
2.3.5. Questionnaires
Paffenbarger Physical Activity Questionnaire (PPAQ) The PPAQ is a questionnaire consisting of eight questions that enables calculation of the level of physical activity during the previous six months [24]. On the basis of the answers, it is possible to calculate the individuals’ energy expenditure (in kcal). In addition, using the intensity of activities, METS per week can also be calculated. This is a reliable questionnaire, with Cronbach’s α ranging from 0.70 - 0.73 [25].
General Ethnic Discrimination Scale (GED) The GED is a 19-item measure of perceived ethnic discrimination. The scale has three subscales: recent, lifetime, and appraised discrimination. The Cronbach’s α for the subscales range from 0.93 - 0.95 for African-Americans [26].
Beck Depression Inventory-II (BDI-II) The BDI-II is a self-report tool used to assess severity of depression. This inventory consists of 21 items and has demonstrated excellent reliability (Cronbach’s α = 0.92 - 0.93) [27]. Items on the BDI-II are rated on a 4-point scale ranging from 0 to 3 and therefore the maximum total score is 63. BDI-II scores exceeding 14 are considered indicative of the potential presence of depression.
Pittsburgh Sleep Quality Index (PSQI) The PSQI was developed to measure sleep quality during the previous month and to discriminate between good and poor sleepers [28]. The PSQI is composed of 19 questions. The self-administered scale contains 15 multiple-choice items that inquire about frequency of sleep disturbances and subjective sleep quality and four write-in items that inquire about typical bedtime, wake-up time, sleep latency, and sleep duration. A PSQI score > 5 is considered suggestive of significant sleep problems. Internal consistency is 0.83 (Cronbach’s alpha) for the score [28]. Test-retest reliability (average interval of 28 days) is 0.85 for the score [29].
Perceived Stress Scale (PSS) The PSS is a 4-item self-report questionnaire that measures persons’ evaluation of the stressfulness of the situations in the past week of their lives [30]. Each question on the PSS is scored on a five-point scale from 0 (never) to 4 (very often) and scores can range from 0 to 16, with higher scores indicating greater stress. The reliability of the PSS has been found to be acceptable (Cronbach’s α = 0.84 - 0.86) [30].
2.4. Statistical Analyses
Data were analyzed using the Statistical Package for the Social Sciences (SPSS for Windows, version 18.0, SPSS Inc., Chicago, IL, USA). A paired sample t-test was used to compare cortisol reactivity before and after viewing the racially-charged movie clip. In order to differentiate the highest cortisol responders from the lowest cortisol responders, investigators computed tertiles on the change from pre-movie cortisol to post-movie cortisol. High responders scored in the highest tertile whereas low responders scored in the lowest tertile for cortisol reactivity. Since equivalent scores occurred for a number of individuals, approximately 40% of individuals were in the highest and lowest “tertiles”. Chi-square and independent t-tests were used to determine differences between high and low cortisol responders.
3. Results
Participant characteristics are presented in Tables 1 and 2. Participants, on average, were female (79%), single/never married (56%), and had completed at least a high school diploma (96%).
Statistically significant increases in cortisol (P = 0.006) and MAP (P = 0.001) were noted in response to the racially-charged movie clip (Table 3).
High and low cortisol responders (top tertile compared to the bottom tertile) were compared on various characteristics that have previously been associated with CVD. Low responders were significantly older than high responders (P = 0.044), had a higher waist-hip ratio (P = 0.012) and reported more lifetime discrimination (P = 0.016) than high responders (Table 2). Participant characteristics did not differ between high and low responders in terms of gender, marital status, family income, education, job status, daily physical activity, and number of cigarettes smoked (Table 1).
Baseline cortisol levels did not differ between high and low responders. However, high responders experienced significantly higher cortisol levels than low responders upon waking the next morning (P = 0.042). Evening cortisol levels the next day did not differ between groups (Figure 1).
4. Discussion
Cardiovascular disease occurs at a higher rate in African-Americans compared to other ethnicities. However, the mechanisms of this association are not well-understood. One potential factor that may help to explain the
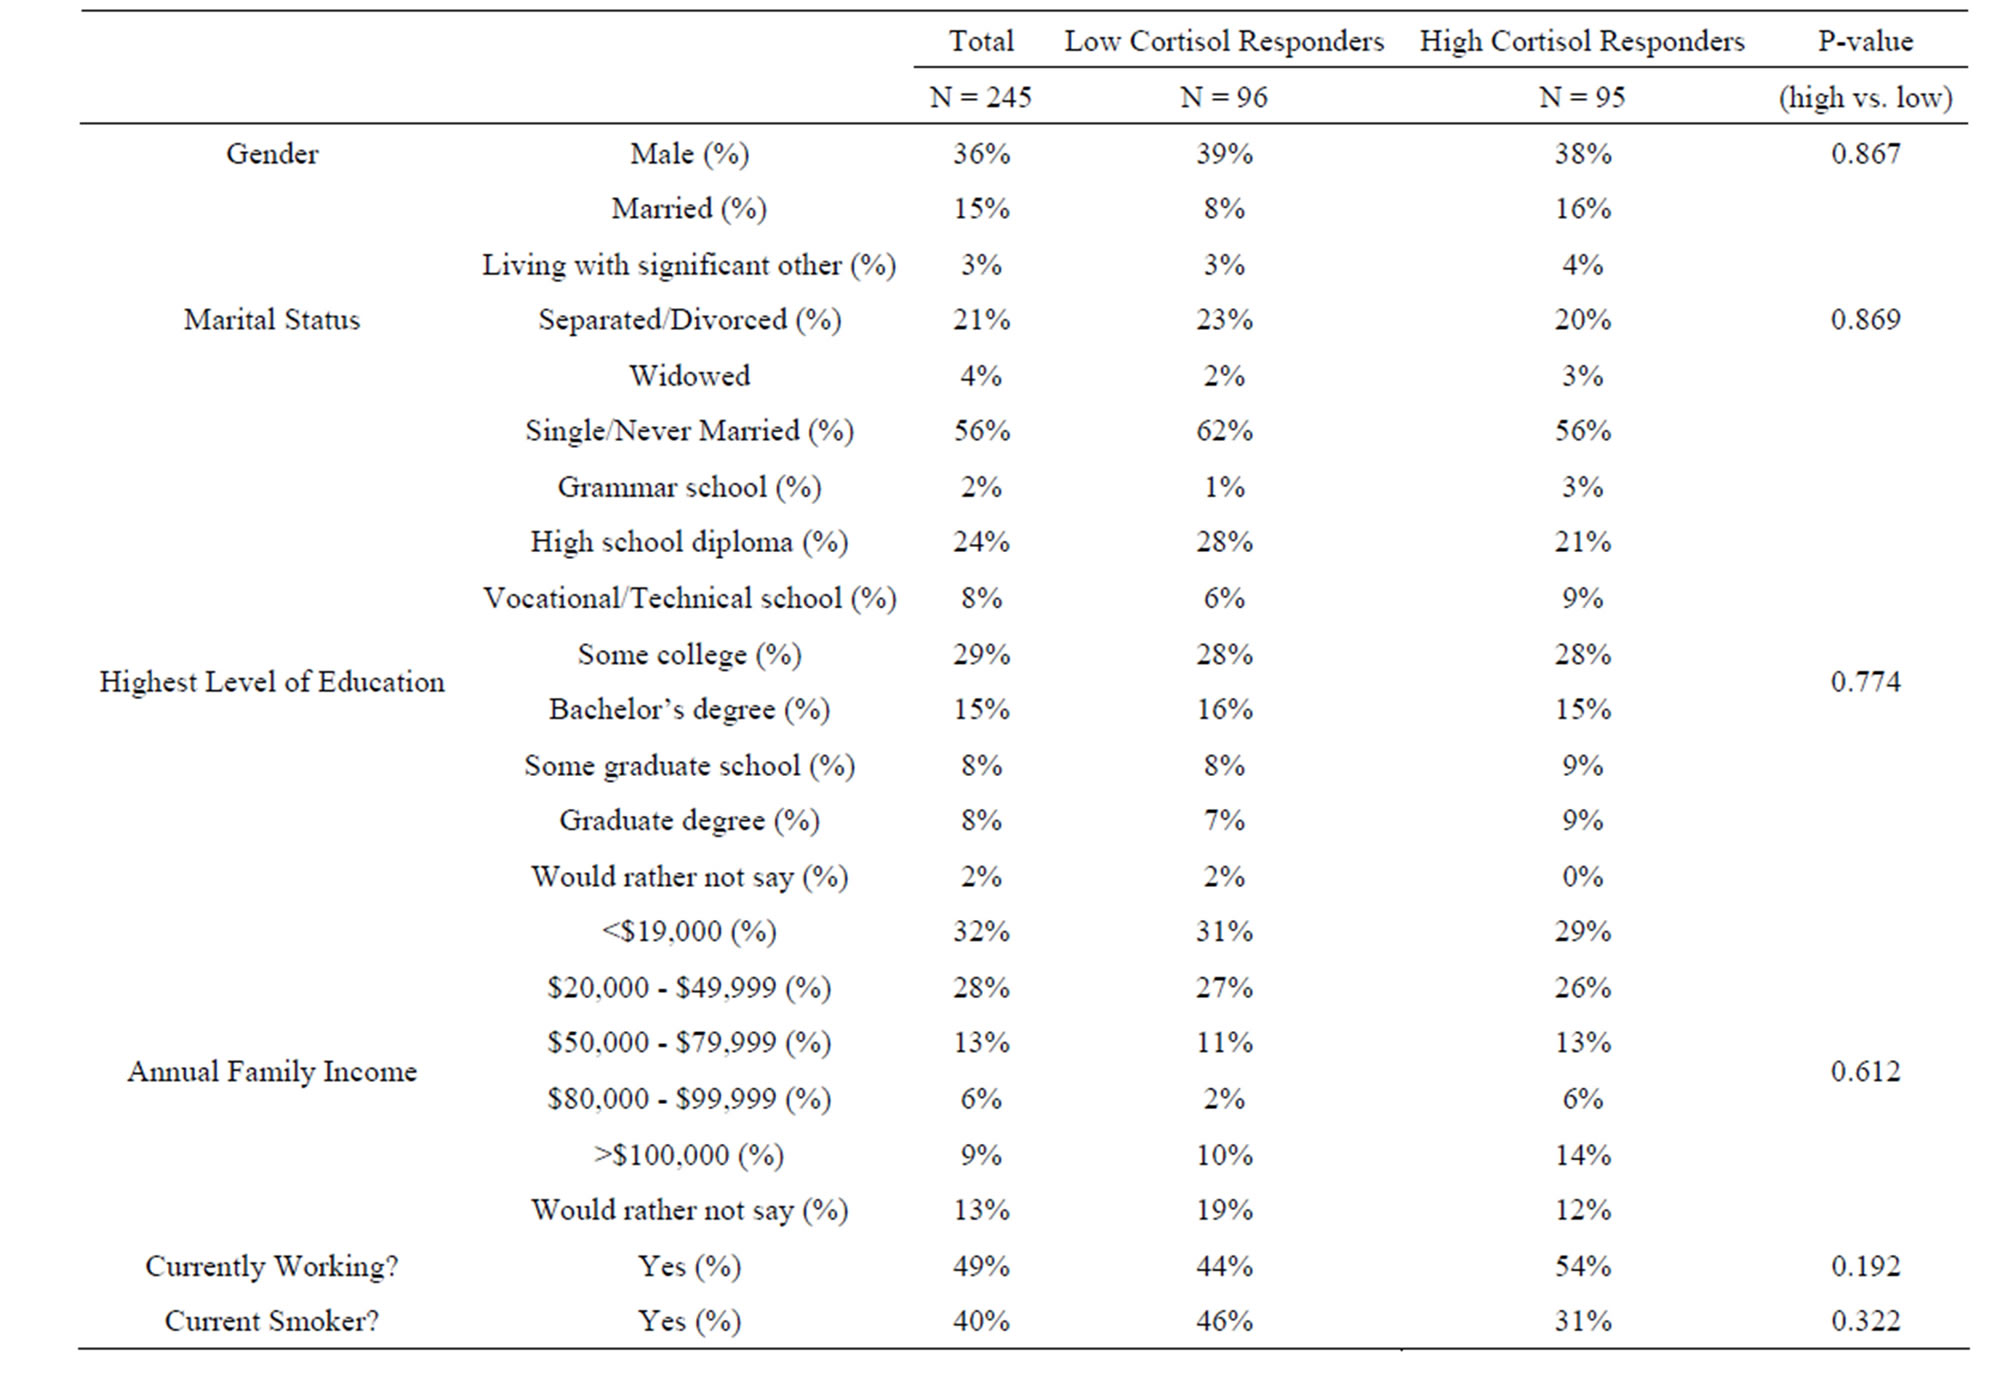
Table 1. Participant characteristics (Categorical variables).
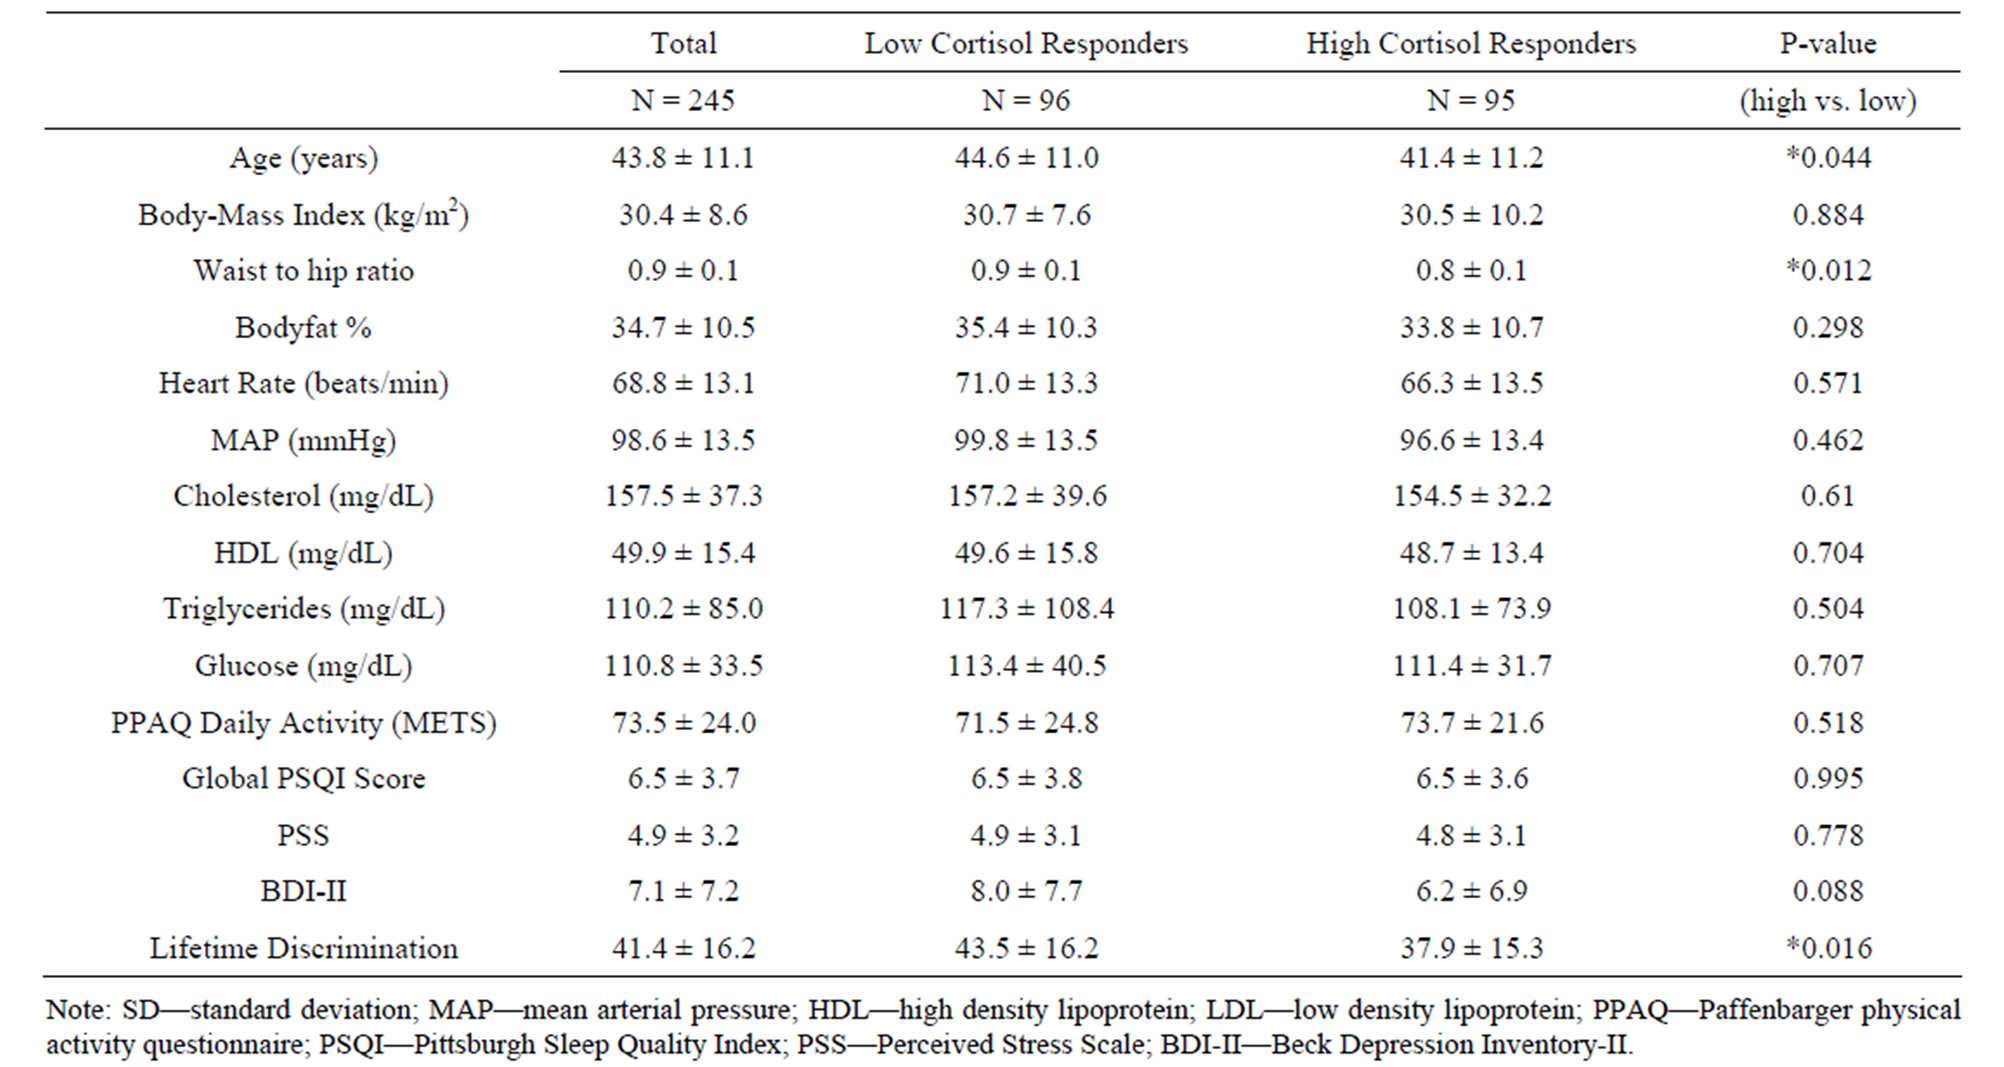
Table 2. Participant characteristics (continuous variables) (Mean ± SD).
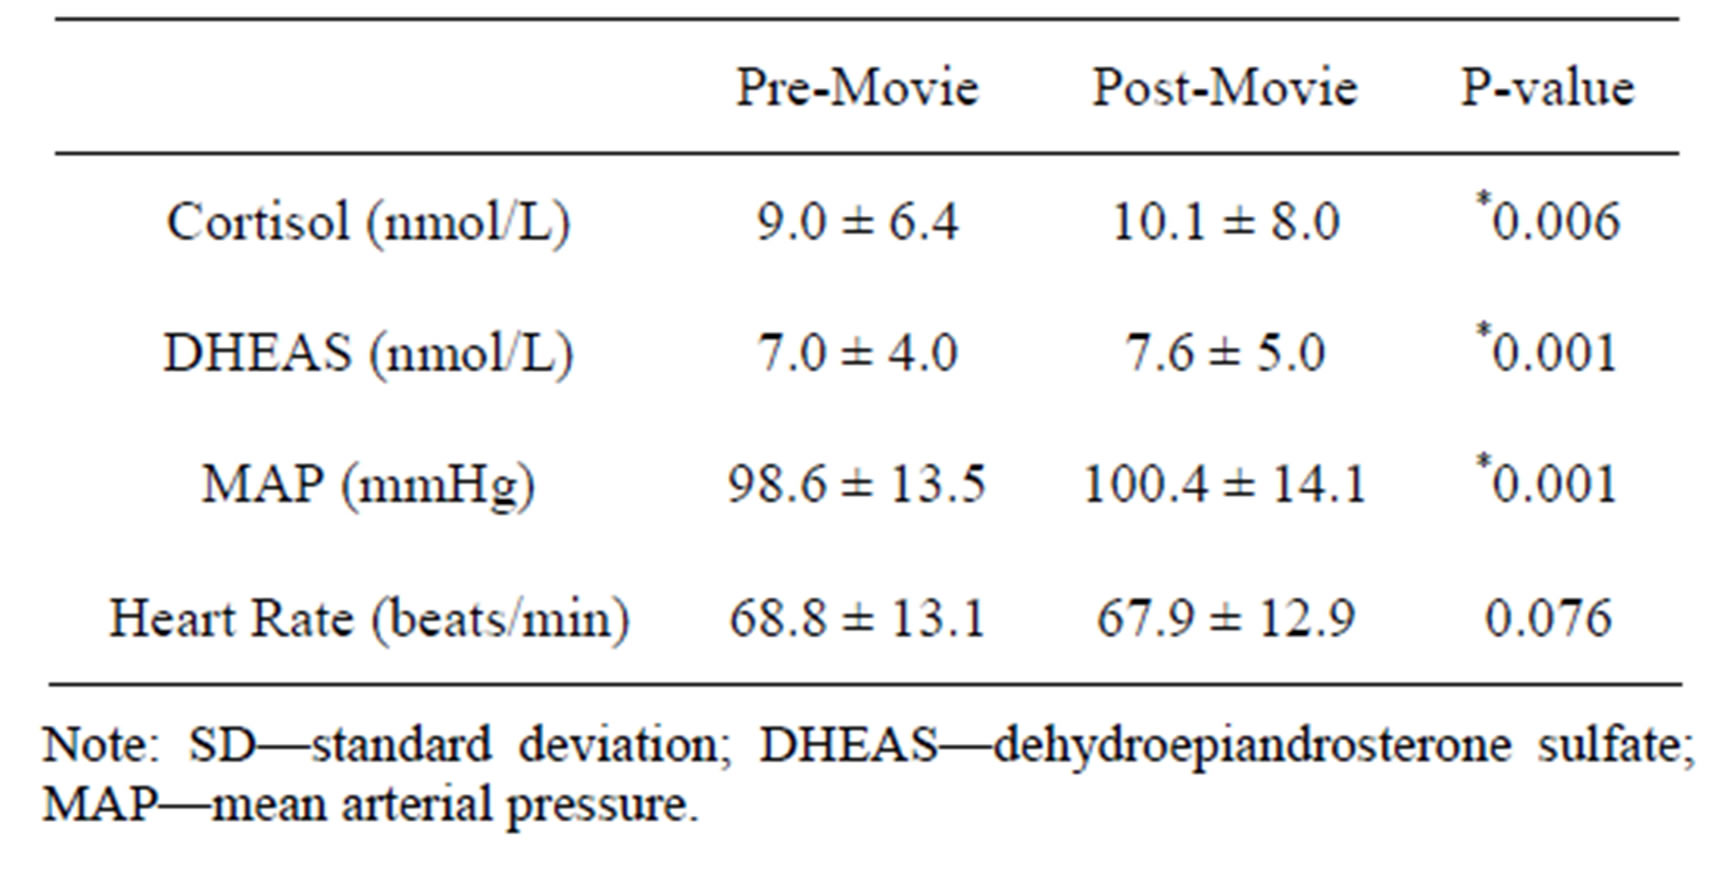
Table 3. Responses (±SD) to a racially charged movie clip (N = 245).
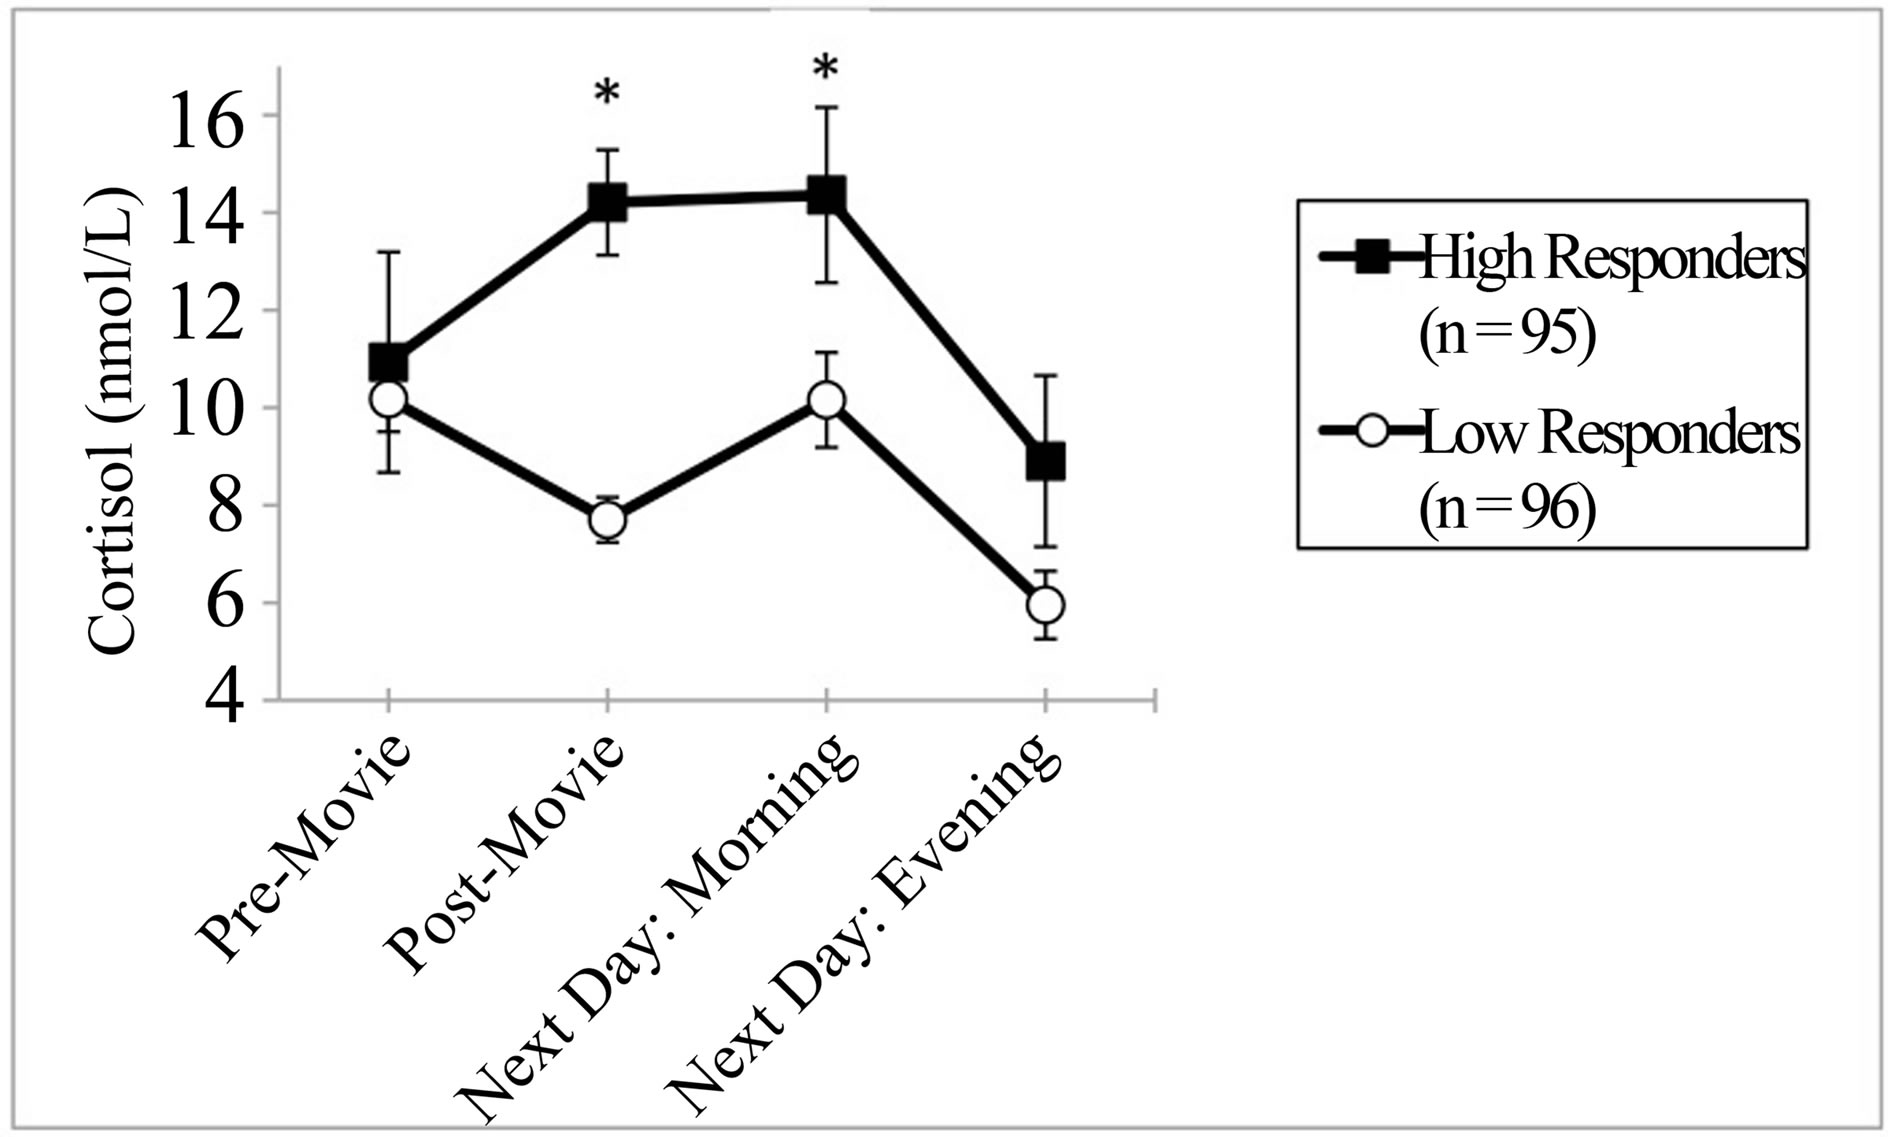
Figure 1. Mean cortisol response (±SEM) to a raciallycharged movie clip in high as compared to low responders. Cortisol levels the day following the stress exposure is also presented. *=P < 0.05 high versus low responder.
relationship is reactivity to stress and specifically stress associated with racial discrimination, as those who are African-American are more likely to experience this type of stress [31]. We focused on cortisol responses to racial stress, since it is a marker of HPA axis responses and HPA axis overactivation predicts increased risk of CVD [11,12]. In the current investigation, an overall increase in cortisol was observed in response to a racial provocation.
In addition, we found that for high cortisol responders, the effect of the racially-charged movie clip, which was only 15 minutes long, endured through the next morning. By the evening of the next day, the cortisol levels in both groups were statistically equivalent. These findings are consistent with previous research showing that prior days’ negative feelings were associated with a higher cortisol awakening response, but not for cortisol levels later in the following day [32]. Cortisol is generally higher in the mornings than at night, and this is reflected by increased cortisol for low responders the next morning. However, the high responders still had a statistically significantly elevated level of cortisol compared to the low responders at this time point.
We found significant differences between high and low responders on several CVD risk factors. Low responders were older than high responders, had a higher waist-hip ratio and had more experience with discrimination over a lifetime. These findings were unexpected and counterintuitive to our hypotheses. We hypothesized that high responders would have higher values on CVD risk factors, not the low responders. However, there may be an explanation for these results. The older participants have had more opportunity to experience discrimination. Perhaps, the participants have come to “expect” discrimination in some way; therefore a movie clip depicting racism would have little effect on these individuals. Individuals who are older and have more lifetime experiences with discrimination are relatively unaffected by the movie. In contrast, younger individuals, who had experienced relatively less discrimination found the movie clip quite disturbing and upsetting. It has been shown in previous research that a lack of exposure to discrimination was associated with elevated blood pressure in response to a racial stress provocation [33]. The higher waist-hip ratio in low responders may be partly explained by age, waist-hip ratio has been shown to increase over time as a function of age [34].
In order to link our findings to CVD outcomes, a longitudinal study would need to be conducted to compare the incidence of CVD in high versus low cortisol responders. This would enhance the clinical significance of identifying high and low responder profiles. Longitudinal methodology may also address developmental pathways that can mediate the relationship between racial stress and CVD (i.e. perceived discrimination, coping style, social status).
A major limitation of this study is the lack of a control group. Without a control group, we are unable to determine whether increased cortisol responses were influenced specifically by the racially-charged movie clip or by changes over time. However, since we found differential responses to the movie clip in our sample, this may not have compromised the integrity of the data. Future research should compare cortisol levels of participants who receive a racial provocation to participants who do not. Another limitation of this study is that the entire sample was African-American. Future research would benefit from comparing cortisol reactivity in AfricanAmericans to individuals of other ethnicities. The sample was limited to African-Americans since the stressor that was used depicted racism directed specifically at African-Americans.
In conclusion, findings from this study may help to explain the higher incidence of CVD in African-Americans, with responses to racial stress as a potential mechanism. Additional research is needed in the area of racial stress and cortisol reactivity, especially with regard to ethnic comparisons and longitudinal methodology.
5. Acknowledgements
This work was supported by a Grant from the National Center on Minority Health and Health Disparities (USA): RFA-MD-07-001.
REFERENCES
- M. Cushman, R. A. Cantrell, L. A. McClure, G. Howard, R. J. Prineas, C. S. Moy, E. M. Temple and V. J. Howard, “Estimated 10-Year Stroke Risk by Region and Race in the United States: Geographic and Racial Differences in Stroke Risk,” Annals of Neurology, Vol. 64, No. 5, 2008, pp. 507-513. http://dx.doi.org/10.1002/ana.21493
- K. Fiscella and K. Holt, “Racial Disparity in Hypertension Control: Tallying the Death Toll,” The Annals of Family Medicine, Vol. 6, No. 6, 2008, pp. 497-502. http://dx.doi.org/10.1370/afm.873
- K. A. Jamerson, “The Disproportionate Impact of Hypertensive Cardiovascular Disease in African Americans: Getting to the Heart of the Issue,” The Journal of Clinical Hypertension, Vol. 6, No. 4, 2004, pp. 4-10.
- A. K. Jha, P. D. Varosy, A. M. Kanaya, D. B. Hunninghake, M. A. Hlatky, D. D. Waters, C. D. Furberg and M. G. Shlipak, “Differences in Medical Care and Disease Outcomes among Black and White Women with Heart Disease,” Circulation, Vol. 108, No. 9, 2003, pp. 1089- 1094. http://dx.doi.org/10.1161/01.CIR.0000085994.38132.E5
- A. Bernstein, D. Makuc and L. Bilheimer, “Health, United States 2006,” National Center for Health Statistics, 2007.
- R. B. Williams, “Psychosocial and Biobehavioral Factors and Their Interplay in Coronary Heart Disease,” Annual Review of Clinical Psychology, Vol. 4, 2008, pp. 349-365. http://dx.doi.org/10.1146/annurev.clinpsy.4.022007.141237
- E. C. Suarez, C. M. Kuhn, S. M. Schanberg, R. B. Williams Jr. and E. A. Zimmermann, “Neuroendocrine, Cardiovascular and Emotional Responses of Hostile Men: The Role of Interpersonal Challenge,” Psychosomatic Medicine, Vol. 60, No. 1, 1998, pp. 78-88.
- M. Kumari, E. Badrick, A. Sacker, C. Kirschbaum, M. Marmot and T. Chandola, “Identifying Patterns in Cortisol Secretion in an Older Population. Findings from the Whitehall II Study,” Psychoneuroendocrinology, Vol. 35, No. 7, 2010, pp. 1091-1099. http://dx.doi.org/10.1016/j.psyneuen.2010.01.010
- R. Rosmond, “Role of Stress in the Pathogenesis of the Metabolic Syndrome,” Psychoneuroendocrinology, Vol. 30, No. 1, 2005, pp. 1-10. http://dx.doi.org/10.1016/j.psyneuen.2004.05.007
- S. H. Boyle, R. S. Surwit, A. Georgiades, B. H. Brummett, M. J. Helms, R. B. Williams and J. C. Barefoot, “Depressive Symptoms, Race and Glucose Concentrations: The Role of Cortisol as Mediator,” Diabetes Care, Vol. 30, No. 10, 2007, pp. 2484-2488. http://dx.doi.org/10.2337/dc07-0258
- R. Rosmond, S. Wallerius, P. Wanger, L. Martin, G. Holm and P. Björntorp, “A 5-Year Follow-Up Study of Disease Incidence in Men with an Abnormal Hormone Pattern,” Journal of Internal Medicine, Vol. 254, No. 4, 2003, pp. 386-390. http://dx.doi.org/10.1046/j.1365-2796.2003.01205.x
- G. D. Smith, Y. Ben-Shlomo, A. Beswick, J. Yarnell, S. Lightman and P. Elwood, “Cortisol, Testosterone and Coronary Heart Disease: Prospective Evidence from the Caerphilly Study,” Circulation, Vol. 112, No. 3, 2005, pp. 332-340. http://dx.doi.org/10.1161/CIRCULATIONAHA.104.489088
- K. A. Matthews, J. E. Schwartz and S. Cohen, “Indices of Socioeconomic Position across the Life Course as Predictors of Coronary Calcification in Black and White Men and Women: Coronary Artery Risk Development in Young Adults Study,” Social Science & Medicine, Vol. 73, No. 5, 2011, pp. 768-774.
- J. Collins-McNeil, “Psychosocial Characteristics and Cardiovascular Risk in African Americans with Diabetes,” Archives of Psychiatric Nursing, Vol. 20, No. 5, 2006, pp. 226-233. http://dx.doi.org/10.1016/j.apnu.2006.04.005
- W. E. Cross, “Shades of Black: Diversity in AfricanAmerican Identity,” Temple University Press, Philadelphia, 1991.
- V. R. Clark, “The Perilous Effects of Racism on Blacks,” Ethnicity & Disease, Vol. 11, No. 4, 2001, pp. 769-772.
- L. S. Richman, G. G. Bennett, J. Pek, I. Siegler and R. B. Williams Jr., “Discrimination, Dispositions and Cardiovascular Responses to Stress,” Health Psychology, Vol. 26, No. 6, 2007, pp. 675-683.
- S. B. Wyatt, D. R. Williams, R. Calvin, F. C. Henderson, E. R. Walker and K. Winters, “Racism and Cardiovascular Disease in African Americans,” The American Journal of the Medical Sciences, Vol. 325, No. 6, 2003, pp. 315-331. http://dx.doi.org/10.1097/00000441-200306000-00003
- S. A. Everson, J. W. Lynch, G. A. Kaplan, T. A. Lakka, J. Sivenius and J. T. Salonen, “Stress-Induced Blood Pressure Reactivity and Incident Stroke in Middle-Aged Men,” Stroke A Journal of Cerebral Circulation, Vol. 32, No. 6, 2001, pp. 1263-1270. http://dx.doi.org/10.1161/01.STR.32.6.1263
- M. Hamer and A. Steptoe, “Cortisol Responses to Mental Stress and Incident Hypertension in Healthy Men and Women,” The Journal of Clinical Endocrinology & Metabolism, Vol. 97, No. 1, 2012, pp. E29-34. http://dx.doi.org/10.1210/jc.2011-2132
- T. W. Kamarck, J. R. Jennings, T. T. Debski, E. Glickman-Weiss, P. S. Johnson, M. J. Eddy and S. B. Manuck, “Reliable Measures of Behaviorally-Evoked Cardiovascular Reactivity from a PC-Based Test Battery: Results from Student and Community Samples,” Psychophysiology, Vol. 29, No. 1, 1992, pp. 17-28. http://dx.doi.org/10.1111/j.1469-8986.1992.tb02006.x
- R. Klabunde, “Cardiovascular Physiology Concepts,” 2nd Edition, Lippincott Williams & Wilkins, 2011.
- W. C. Chumlea, S. S. Guo, R. J. Kuczmarski, K. M. Flegal, C. L. Johnson, S. B. Heymsfield, H. C. Lukaski, K. Friedl and V. S. Hubbard, “Body Composition Estimates from NHANES III Bioelectrical Impedance Data,” International Journal of Obesity and Related Metabolic Disorders, Vol. 26, No. 12, 2002, pp. 1596-1609. http://dx.doi.org/10.1038/sj.ijo.0802167
- R. S. Paffenbarger Jr., S. N. Blair, I. M. Lee and R. T. Hyde, “Measurement of Physical Activity to Assess Health Effects in Free-Living Populations,” Medicine & Science in Sports & Exercise, Vol. 25, No. 1, 1993, pp. 60- 70. http://dx.doi.org/10.1249/00005768-199301000-00010
- M. A. Pereira, S. J. FitzerGerald, E. W. Gregg, M. L. Joswiak, W. J. Ryan, R. R. Suminski, A. C. Utter and J. M. Zmuda, “A Collection of Physical Activity Questionnaires for Health-Related Research,” Medicine & Science in Sports & Exercise, Vol. 29, No. 6, 1997, pp. S1- 205.
- H. Landrine, E. A. Klonoff, I. Corral, S. Fernandez and S. Roesch, “Conceptualizing and Measuring Ethnic Discrimination in Health Research,” Journal of Behavioral Medicine, Vol. 29, No. 1, 2006, pp. 79-94. http://dx.doi.org/10.1007/s10865-005-9029-0
- A. T. Beck, R. A. Steer and G. K. Brown, “BDI-II, Beck Depression Inventory: Manual,” Psychological Corporation, 1996.
- D. J. Buysse, C. F. Reynolds 3rd, T. H. Monk, S. R. Berman and D. J. Kupfer, “The Pittsburgh Sleep Quality Index: A New Instrument for Psychiatric Practice and Research,” Psychiatry Research, Vol. 28, No. 2, 1989, pp. 193-213. http://dx.doi.org/10.1016/0165-1781(89)90047-4
- A. Gentili, D. K. Weiner, M. Kuchibhatla and J. D. Edinger, “Test-Retest Reliability of the Pittsburgh Sleep Quality Index in Nursing Home Residents,” Journal of the American Geriatrics Society, Vol. 43, No. 11, 1995, pp. 1317-1318.
- S. Cohen, T. Kamarck and R. Mermelstein, “A Global Measure of Perceived Stress,” Journal of Health and Social Behavior, Vol. 24, No. 4, 1983, pp. 385-396. http://dx.doi.org/10.2307/2136404
- R. Clark, N. B. Anderson, V. R. Clark and D. R. Williams, “Racism as a Stressor for African Americans. A Biopsychosocial Model,” American Psychologist, Vol. 54, No. 10, 1999, pp. 805-816. http://dx.doi.org/10.1037/0003-066X.54.10.805
- E. K. Adam, L. C. Hawkley, B. M. Kudielka and J. T. Cacioppo, “Day-to-Day Dynamics of Experience—Cortisol Associations in a Population-Based Sample of Older Adults,” Proceedings of the National Academy of Sciences, Vol. 103, No. 45, 2006, pp. 17058-17063. http://dx.doi.org/10.1073/pnas.0605053103
- D. R. Williams, H. W. Neighbors and J. S. Jackson, “Racial/Ethnic Discrimination and Health: Findings from Community Studies,” American Journal of Public Health, Vol. 93, No. 2, 2003, pp. 200-208. http://dx.doi.org/10.2105/AJPH.93.2.200
- J. Stevens, E. G. Katz and R. R. Huxley, “Associations between Gender, Age and Waist Circumference,” European Journal of Clinical Nutrition, Vol. 64, No. 1, 2010, pp. 6-15. http://dx.doi.org/10.1038/ejcn.2009.101
NOTES
*The opinions and assertions expressed herein are those of the authors and should not be construed as reflecting those of the Uniformed Services University of the Health Sciences (USUHS) or the Department of Defense.