American Journal of Analytical Chemistry
Vol.08 No.11(2017), Article ID:80206,18 pages
10.4236/ajac.2017.811052
Trace Determination of Duloxetine HCl in Formulation and Spiked Human Serum at a Carbon Paste Electrode
Amira M. Hassanein, Youssef I. Moharram*, Naglaa F. Oraiby, Sherif E. Ebied
Analytical and Electrochemistry Research Unit, Department of Chemistry, Faculty of Science, Tanta University, Tanta, Egypt
![]()
Copyright © 2017 by authors and Scientific Research Publishing Inc.
This work is licensed under the Creative Commons Attribution International License (CC BY 4.0).
http://creativecommons.org/licenses/by/4.0/


Received: August 8, 2017; Accepted: November 6, 2017*; Published: November 9, 2017
ABSTRACT
The electrochemical behavior of duloxetine HCl (DXT.HCl) at a carbon paste electrode (CPE) was achieved by cyclic voltammetry and a mechanism of its oxidation was reported and illustrated. A sensitive linear sweep and square-wave adsorptive anodic stripping voltammetry methods were described for trace determination of DXT.HCl. Introduction: DXT.HCl, N-methyl-3-(nap-thalen-1- yloxy)-3-(thiophene-2-yl) propan-1-amine hydrochloride is a selective serotonin-norepinephrine reuptake inhibitor (SNRI) originally developed as an antidepressant and is currently recommended for maintenance treatment of major depressive disorder. Methods: Electrochemical behavior was studied using cyclic voltammetric method, and the analytical application was studied using linear sweep and square wave voltammetric methods. Solution pH has been measured by pH meter. Results: The process on the surface of carbon paste electrode was found to be irreversible and diffusion-controlled. The number of proton and electron transferred were calculated. Possible reaction mechanism taking place on the surface of electrode was proposed. Calibration plot constructed using square wave voltammetric technique was used for quantitative analysis in pharmaceutical and human serum samples. Limit of detection (LOD) and limit of quantification (LOQ) were calculated. Conclusions: In the present work, we described the electrochemical behavior of DXT.HCl drug. Two precise linear sweep and square wave adsorptive anodic stripping voltammetry methods have been described for its trace quantitation in pharmaceutical formulation and human serum. The method shows the development of a sensor for selective and sensitive determination of DXT.HCl.
Graphical Abstract (GA)
Keywords:
Square Wave, Linear Sweep, Cyclic Voltammetry, Cymbalta® Tablets, Human Serum

1. Introduction
DXT.HCl, N-methyl-3-(napthalen-1-yloxy)-3-(thiophene-2-yl) propan-1-amine hydrochloride (Scheme 1) is a selective serotonin-norepinephrine reuptake inhibitor (SNRI) originally developed as an antidepressant and is currently recommended for maintenance treatment of major depressive disorder [1] . The drug is approved by the US Food and Drug administration for the treatment of diabetic polyneuropathy and is recommended as a first line treatment for this purpose [2] . Other indications include management of generalized anxiety disorder [3] fibromyalgia [4] , and most recently, stress urinary incontinence [5] [6] .
Currently, there is no official analytical procedure for DXT.HCl in any pharmacopoeia. There are several reports in literature based on the application of reverse phase chromatographic methods [7] - [12] or potentiometric methods [13] for the determination of DXT.HCl (LOD = 3.0 × 10⁻⁷ and LOQ = 1.0 × 10⁻⁶ mol L−1).

Scheme 1. Chemical structure of DXT.HCl.
Spectrophotometric methods have also been investigated and these include the application of more sensitive derivative spectrophotometry as well [14] [15] [16] (LOD = 9.0 × 10⁻⁶ and LOQ = 1.0 × 10⁻⁵ mol L−1). A spectrofluorimetric method has been reported for DXT.HCl based on enhancement effect of cationic surfactants on the native fluorescence intensity in an alkaline medium [17] . This method involves the quantification of DXT.HCl in bulk as well as in capsule or tablet dosage forms. All these methods are not sensitive, complicated, expensive, but require sample pretreatment and time consuming liquid-liquid or solid phase extraction steps prior to the analysis. Furthermore, some of these chromatographic methods have high strength ionic buffered mobile phases that are hazardous for column efficiency and need prolonged time for column saturation and washing. On the other side, electro-analytical techniques are efficient and simple for determining pharmaceutical compounds in different matrices, due to their fast response, high sensitivity and low cost [18] . Sample extraction prior to analysis is not required, and it has so far not been applied to the determination of DXT.HCl, thus persuaded us to carry out a study on electro-oxidation of this drug on the surface of CPE and develop a method for its determination. So, this work aimed to study the electrochemical behavior of DXT.HCl at a CPE and to develop a much sensitive square-wave, linear sweep adsorptive stripping voltammetric methods for its determination in commercial formulation and human serum. The developed methods were applied for determination of DXT.HCl in bulk form with a limit of detection LOD = 3.0 × 10⁻⁹ and LOQ = 1.0 × 10⁻⁸ mol L−1, LOD = 1.5 × 10⁻⁸ and LOQ = 5.0 × 10⁻⁸ mol L−1 for SWV and LSV respectively.
2. Methods
2.1. Apparatus and Chemicals
Computer-controlled Potentiostat Models 263A and 273A-PAR (Princeton Applied Research, Oak Ridge, TN, USA) with the software 270/250-PAR were used for the voltammetric measurements. A micro-electrolysis cell consisting of C-2 stand with an electrode body (BASi Model MF-2010), an Ag/AgCl/3M KCl reference electrode (BASi Model MF-2079), and a platinum wire counter electrode were used. A magnetic stirrer with a Teflon-coated magnet was used to provide the convective transport during the preconcentration step. An Eppendorf centrifuge (Model 5417 C, Hamburg, Germany) was used for separation of precipitated proteins from human serum and plasma samples prior to the assay. A micropipette (Eppendorf-MultipetteÒ plus) was used for transferring the analyte solutions throughout the experimental work. De-ionized water (6.0 × 10⁶ Ω) was used throughout the present work.
2.2. Materials and Sample Preparation
Distilled water (AR Grade, S. D. Fine Chemicals Ltd., Mumbai, India) and Whatman filter paper no. 41 (Whatman International Ltd., England) were used in the study. A stock standard solution of 1.0 × 10⁻³ mol L−1 bulk DXT.HCl was prepared in distilled water and then stored at 4˚C. Working solutions DXT.HCl (1.0 × 10⁻⁸ to 1.0 × 10⁻⁴ mol L−1) were prepared daily by appropriate dilution with distilled water just before use. Cymbalta® tablets (obtained from a local pharmacy) labeled to contain 30 mg DXT.HCl per tablet were quantitatively weighed and the average mass per tablet was determined. The tablets were then grounded (20 tablet) in a mortar to a homogeneous fine powder. A quantity of this powder equivalent to the weight of one tablet was accurately transferred into a 100 mL volume calibrated flask containing 70 mL distilled water. The content of the flask was sonicated for about 10 min and then filled up with distilled water. The solution was then filtered through a 0.45 μm Mille-pore filter (Gelman, Germany). The desired concentrations of the DXT.HCl were obtained by accurate dilution with distilled water. Six serum samples of three healthy subjects (two samples from each subject) were stored frozen until assay. Into each of 10 centrifugation tubes containing a certain concentration of DXT.HCl (1.0 × 10⁻⁸ to 1.0 × 10⁻⁴ mol L−1), 1 mL-volume of the human serum was transferred, and then mixed well with 1 mL of ethanol to denature and precipitate proteins. The solutions were centrifuged for 3.0 min at 14,000 rpm to separate out the precipitated proteins. The clear supernatant layers of the solutions were filtered through 0.45 μm Mille-pore filters to produce protein-free human serum samples spiked with various concentrations of DXT.HCl (1.0 × 10⁻⁸ to 1.0 × 10⁻⁴ mol L−1). An aliquot of this solution (0.01 - 0.1 ml) was diluted to 10 ml with Britton-Robinson universal buffer or phosphate buffer, and then transferred into a dark voltammetric cell.
2.3. Buffer Solutions
A series of phosphate buffers of pH values 6.2 to 7.5 and universal buffers of pH values 2 to 12 were prepared and used as a supporting electrolyte. A pH-meter (Crison, Barcelona, Spain) was used for the pH measurements. Deionized water was supplied from a Purite-Still Plus de-ionizer connected to an AquaMatic double-distillation water system (Hamilton Laboratory Glass LTD., Kent, UK).
2.4. Preparation of the Carbon Paste Electrode
The carbon paste (CP) was prepared by mixing an amount (5.0 g) of graphite powder (1 - 2 µm, Aldrich, Milwaukee, WI, USA) and 1.8 mL Nujol oil (Sigma, density = 0.84 g mL−1) uniformly by milling in a small agate mortar. The body of the electrode was a Teflon rod with an end cavity (BASi Model MF-2010, 3.0 mm diameter and 1.0 mm deep) bored at one end for paste filling. Contact was made with a copper wire through the center of the Teflon rod. An amount of the prepared CP was pressed into the end cavity of the electrode body and leveled off with a spatula. Surface of the constructed CPE was manually smoothed by polishing on clean paper before use.
Randles-Sevcik formula can be used to calculate the electro-active area of the electrode using cyclic voltammetric technique and 1.0 × 10⁻³ mol L−1 K3Fe (CN)6 as a probe at different scan rates in 0.1 mol L−1 KCl as supporting electrolyte. At T = 298 K and for a reversible process, the Equation (1) is as follows:
(1)
In Equation (1), for 1.0 × 10⁻³ mol L−1 K3Fe (CN)6 and 0.1 mol L−1 KCl as supporting electrolyte, Ip refers to the anodic peak current, n is the number of electron transferred during the electrode reaction equal to 1. A0 is the surface area of the electrode, DR is the diffusion coefficient equal to 7.6 × 10⁻⁶ cm2 s−1, υ is the scan rate, and C0 is the concentration of K3Fe(CN)6. From the slope of the plot of Ip vs. υ1/2, the area of the electrode surface was calculated to be 0.032 ± 0.0018 cm2.
3. Results and Discussion
3.1. Cyclic Voltammetric Studies
The electrochemical behavior of 1.0 × 10⁻⁴ mol L−1 DXT.HCl at a CPE was studied by cyclic voltammetry at a 100 to 500 mVs−1 in the B-R universal buffer of various pH values (2 - 12), Figure 1.
The oxidation process of DXT.HCl involved mainly its secondary amino group oxidation from the molecule structure. The peak potential Ep of the main peak shifted to less positive values with the increase of pH, which denotes that the protons are involved in the electrode reaction process and the proton-transfer reaction precedes the electron transfer process [19] . A linear relationship of the peak potential (Ep) vs. (pH) was obtained; via the corresponding regression equation: Ep (V) = −0.069 pH + 1.537, (r = 0.989 and n = 5). Its slope value equals 69 mV = {(59/α). ( } [20] , where na and are the numbers of electrons
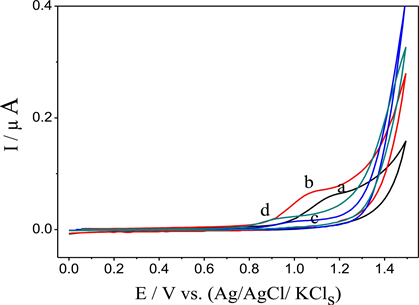
Figure 1. Cyclic voltammograms of 1.0 × 10⁻⁴ mol L−1 DXT.HCl at a CPE in B-R universal buffers of pH values: 6 (a), 7 (b), 8 (c) and 9 (d) at a scan rate of 300 mV s−1.
and protons involved in the rate determining step, respectively, and α is the symmetry transfer coefficient. It is well know that two electrons (na = 2) and one proton ( = 1) are involved in the rate-determining step of the electro-oxidation process of secondary amino group, i.e., the ratio ( ) = 1/2. Accordingly, α- value of 0.42 was estimated from slope value (69 mV/pH) of the (Ep) vs. (pH) plot, indicating the irreversible nature of the electrode process of DXT.HCl at a CPE [19] .
Also, the irreversible nature of the electrode reaction was also identified from the shift of peak potential Ep to less positive values upon the increase of scan rate v (100 - 500 mV s−1) at different pH values [21] [22] [23] [24] , as shown in Equation (2)
(2)
Values of αna (product of symmetry transfer coefficient α and number of electrons na transferred in the rate-determining step) of 0.027 - 0.42 were estimated from slope values of the obtained (Ep) vs. (lnv) plots according to following equations of the totally irreversible electrode reaction [21] [22] [23] [24] , Equation (3)
(3)
The most probable values of transfer coefficient α (0.34 - 0.47) were estimated at various pH values, for the number of electrons (na equals 2) transferred in the rate-determining step for the electro-oxidation of the secondary amino group of the analyte [19] , this is confirmed again the irreversible nature of the electrode reaction of DXT.HCl at a CPE.
3.2. Electrode Reaction Mechanism of Duloxetine HCl at a CPE
On the basis of the above results, a mechanism can be described. In the first step, a protonation-deprotonation equilibrium step, followed by a slow step in which 2e− and H+ are involved in the electro-oxidation of the secondary amino group. Foramation of formaldehyde has been confirmed and developed for precise quantification of formaldehyde in aqueous samples at trace levels by using TLC method. The analytical method of formaldehyde analysis based on the quantitative spot test technique. The violet-red spots of formaldehyde with chromotropic acid were developed on TLC. Chromotropic acid has been widely used as an analytical reagent in organic as well as in biological chemistry after the discovery of violet spots with formaldehyde in 1937 [25] [26] . The color densities of the spots were measured with simple software by taking the image of spotty TLC in computer subsequent to scanning. TLC plate (Merck, Aluminum sheet, Silica gel 60F254, 3 × 5 cm) was used to develop spots since paper could not be employed (burnt because of concentrated sulfuric acid). One micro-liter drop of each, chromotropic acid, sulfuric acid and formaldehyde solution taken from voltammetric cell was employed with micropipette (Pipettman) one over the other. The order of application of reagents and formaldehyde solution was altered to check the effect on color density of the spot. Later, the TLC was placed in an oven for 2 - 20 min at 60˚C to notice the effect of time. Violet color spots intensifying on cooling were obtained. This indicates the formation of formaldehyde and removal of methyl group in voltammetric cell is shown in Scheme 2.
3.3. Interfacial Adsorptive Behavior of Duloxetine HCl onto a CPE Surface
The interfacial adsorptive affinity of DXT.HCl onto a CPE surface was also designated by recording the cyclic voltammograms of 2.0 × 10⁻⁵ mol L−1 DXT.HCl at 200 mV s−1 in the phosphate buffer of pH 6.8 following its preconcentration by adsorptive accumulation onto a CPE, under open circuit conditions (Figure 2,
![]()
Scheme 2. Electrode reaction mechanism of the oxidation process of DXT.HCl at a CPE.
![]()
Figure 2. Cyclic voltammograms of 2.0 × 10⁻⁵ mol L−1 DXT.HCl in the phosphate buffer of pH 6.8 at a scan rate of 200 mV s−1: following its preconcentration onto a CPE by adsorptive accumulation at open circuit conditions (a) then at 0 V for 10 s [1st cycle (b) and 2nd cycle (c)].
curve a), and then at preconcentration potential (Eacc) of 0 V (vs. Ag/AgCl/KCls) for 10 s (Figure 2, 1st cycle, curve b and 2nd cycle, curve c). As shown in Figure 2, an enhanced peak current magnitude was observed following preconcentration of the analyte by adsorptive accumulation onto a CPE (1st cycle, curve b) compared to that recorded following accumulation of the drug at open circuit (curve a) confirmed the interfacial adsorptive character of DXT.HCl onto a CPE. Whereas, in the 2nd cycle (curve c) the voltammogram exhibited a very small peak current compared to that of the 1st cycle (curve b), which may be attributed to desorption of DXT.HCl from the CP electrode surface. Furthermore, the electrode surface coverage (Γo (mol cm−2)) of DXT.HCl in the phosphate buffer of pH 6.8 was estimated using the Equation (4) [21] .
(4)
where Q (C) is the charge consumed by the surface process which estimated by the integration of the area under the peak corrected to the residual current, n is the total number of electrons consumed in the oxidation process (n = 2), F is the Faraday constant (96,487 C) and A is the surface area of the working electrode (0.032 cm2). On dividing the amount of charge (Q) consumed by the surface process, 29.97 × 10⁻⁶ C, by the conversion factor nFA (6175.168 C mol−1 cm2), a monolayer surface coverage of 4.85 × 10⁻⁹ mol cm−2 was estimated. Each adsorbed DXT.HCl molecule thus occupied an area of 0.0342 nm2. Furthermore, the logarithm of the peak current (ip) vs. logarithm of scan rates (ν) (100 to 500 mV s−1) was a linear relationship following the regression equation: logip = 0.81 logν + −1.43 (r = 0.980 and n = 5). The slope value of 0.81 is very close to the expected theoretical value of 1.0 for an ideal reaction of surface species [22] .
3.4. Stripping Voltammetric Studies
Stripping voltammetric methods were optimized for trace determination of DXT.HCl applying linear sweep and square wave potential-waveforms. Stripping voltammograms of bulk DXT.HCl in the phosphate buffer (pH 6.2 to 7.5) recorded by linear sweep and square wave voltammetry following its preconcentration onto a CPE by adsorptive accumulation for 20 s exhibited a well-defined single irreversible anodic peak with a better enhanced peak current magnitude at pH 6.8. Therefore, a phosphate buffer of pH 6.8 was chosen as a supporting electrolyte in the rest of study.
3.4.1. Linear Sweep Stripping Voltammetry Method
The optimum operational conditions for determination of DXT.HCl applying linear sweep adsorptive anodic stripping voltammetry (LS-AdASV) at a CPE in the phosphate buffer of pH 6.8 were identified. This was carried out by studying the effect of each of scan rate ν (100 to 500 mV s−1) and preconcentration potential Eacc (−0.3 to 1.4 V) on the peak current magnitude of 5.0 × 10⁻⁷ mol L−1 bulk DXT.HCl. A better enhanced peak current magnitude was achieved at optimum operational conditions of scan rate v = 200 mV s−1, and Eacc = 0.1 V (vs. Ag/AgCl/KCls), Figure 3.
![]()
Figure 3. Plot of LS-AdAS voltammetry peak current (ip) vs. preconcentration potential (Eacc) of 5.0 × 10⁻⁷ mol L−1 bulk DXT.HCl following its preconcentration onto a CPE for 20 s in the phosphate buffer of pH 6.8 at a scan rate of 200 mV s−1. Inset: The same study using SW-AdASV; f = 60 Hz, a = 15 mV and ΔEs = 20 mV.
![]()
Figure 4. Plots of LS-AdAS voltammetry peak current (ip) vs. preconcentration time (tacc) of (a) 5.0 × 10⁻⁷ (b) 1.0 × 10⁻⁷ mol L−1 bulk DXT.HCl following preconcentration onto a CPE at 0.1 V in the phosphate buffer of pH 6.8 at a scan rate of 200 mV s−1. Inset: The same study using SW-AdAS voltammetry; f = 60 Hz, a = 15 mV and ΔEs = 20 mV.
On the other hand, the dependence of LS-AdASV peak current magnitudes of (5.0 × 10⁻⁷, and 1.0 × 10⁻⁷ mol L−1 DXT.HCl), (Figure 4) on the preconcentration time (tacc) of the analyte at Eacc = 0.1 V was also studied. Figure 4 (curves a, b) show that the LS-AdASV response was linear up to 80 s for 5.0 × 10⁻⁷, 1.0 × 10⁻⁷ mol L−1 DXT.HCl then leveled off. This indicates that the adsorptive equilibrium onto the carbon electrode surface was achieved [27] . The observed subsequence decrease in the peak current magnitude with preconcentration times probably owing to an inhibition of the voltammetric process occurring after saturation of carbon [27] or interactions among the molecules in the adsorbed state become noticeable [28] . This could be explained by the release of an amount of the adsorbed molecules due to possible repulsive interaction between the adsorbed species when coverage of the electrode has been reached [28] . However, for 1.0 × 10⁻⁷ mol L−1 DXT.HCl as the preconcentration time was increased, linearity was prevailed over the tested preconcentration time, (Figure 4, curve b). Thus, the preconcentration time (80 s) of choice will be dictated by the sensitivity needed. LS-AdAS voltammograms of various concentrations of DXT.HCl were recorded under the optimized operational conditions. A linear variation of the peak current (ip) with concentration (C) of bulk DXT.HCl was obtained within the concentration range of 5.0 × 10⁻⁸ to 1.0 × 10⁻⁶ mol L−1 bulk DXT.HCl following the regression equation: ip (μA) = 4.65 C (µmol L−1) + 0.178 (r = 0.990 and n = 7). A limit of detection (LOD) of 1.5 × 10⁻⁸ mol L−1 and a limit of quantitation (LOQ) of 5.0 × 10⁻⁸ mol L−1 bulk DXT.HCl were estimated using the expression: k.SD/b [29] , where k = 3 and 10 in case of LOD and LOQ, respectively. SD is the standard deviation of the intercept of calibration curves (or the blank) and b is the slope of the calibration curve.
3.4.2. Square Wave Stripping Voltammetry Method
Optimum operational conditions of both preconcentration and pulse-parameters for determination of bulk DXT.HCl applying square wave adsorptive anodic stripping voltammetry (SW-AdASV) were identified. These were carried out by studying the effect of changing of each of preconcentration potential Eacc (−0.2 to 0.4 V), pulse-height a (5 to 50 mV), frequency f (10 to 120 Hz) and scan increment ΔEs (2 to 20 mV) on peak current magnitude of 5.0 × 10⁻⁷ mol L−1 bulk DXT.HCl in the phosphate buffer of pH 6.8. The results revealed that the optimal operational conditions which generated a better enhanced current magnitude were: Eacc = 0.1 V (vs. Ag/AgCl/KCls) (Figure 3, Inset), a = 15 mV, f = 60 Hz and ΔEs = 20 mV. On the other side, the effect of preconcentration time (tacc) at 0.1 V on the SW-AdAS votammetric peak current magnitude of various concentrations of bulk DXT.HCl (5.0 × 10⁻⁷, and 1.0 × 10⁻⁷ mol L−1) under the optimized operational conditions was evaluated (Figure 4, inset) and the preconcentration time (80 s) of choice will be dictated by the sensitivity needed.
SW-AdAS voltammograms of various concentrations of DXT.HCl were recorded under the optimal operational conditions. A linear variation of the peak current (ip) with concentration (C) of bulk DXT.HCl was obtained within the concentration range of 1.0 × 10⁻⁸ to 1.0 × 10⁻⁶ mol L−1 following the regression equation: ip (μA) = 11.022 C (μM) + 0.722 (r = 0.970 and n = 9). A LOD of 3.0 × 10⁻⁹ mol L−1 and a LOQ of 1 × 10⁻⁸ mol L−1 bulk DXT.HCl were achieved [29] applying the described SW-AdASV method.
3.4.3. Methods Validation
Validation schemes of the analytical methods for the determination of various analytes are defined in ICH guidelines and some Pharmacopoeias, such as United States (USP) or European (EP) Pharmacopoeias. Most of the validation scheme described in ICH guidelines [30] and USP [31] was applied in the present work for validation (via linearity, repeatability, reproducibility, precision, accuracy, selectivity and robustness [30] [31] of the described stripping voltammetry methods for assay of bulk DXT.HCl.
Repeatability (intra-day assay), reproducibility (inter-day assay), precision and accuracy [30] [31] of the described LS-AdASV and SW-AdASV methods were evaluated by performing four replicate measurements for various concentrations of bulk DXT.HCl over 1 day (intra-day assay) and for 3 days (inter-day assay). Insignificant differences were observed between the amounts of DXT.HCl taken and found. Satisfactory mean recoveries, relative standard deviations and relative errors were achieved indicating the repeatability, reproducibility, precision and accuracy of the described methods for assay of DXT.HCl. As shown in Table 1.
The robustness [30] [31] of the developed stripping voltammetric methods was examined by studying the effect of variation of some of the neck operational conditions such as pH (6.6 to 7), preconcentration potential (0 to 0.2 V) and preconcentration time (75 to 85 s) on mean percentage recovery (% R) and relative standard deviation (% RSD) of different concentrations of bulk DXT.HCl (Table 2). The obtained mean percentage recoveries (% R) and relative standard deviation (% RSD) based on four replicate measurements of 1.0 × 10⁻⁷ mol L−1 of bulk DXT.HCl using LS-AdAS and SW-AdAS voltammetry, respectively (Table 2). Since the mean percentage recoveries and relative standard deviations obtained within the studied range of variation of the operational conditions were insignificantly affected, the developed adsorptive stripping voltammetric methods are reliable for quantitation of DXT.HCl and could be considered robust.
The inter-laboratory precision [30] [31] was also examined for analysis of 1.0 × 10⁻⁷ mol L−1 of bulk DXT.HCl by means of the described LS-AdASV and SW-AdASV methods using two Potentiostats (PAR) Models 273A (Lab 1) and 263A (Lab 2) at different elapsed time by two different analysts (Table 2). The obtained results (Table 2) were found reproducible, since there was no significant difference in the mean percentage recoveries or the relative standard deviations. Thus the described stripping voltammetric methods are reliable for assay of DXT.HCl and could

Table 1. Analytical precision and accuracy of determination of 5.0 × 10⁻⁷ mol L−1 bulk DXT.HCl by the described voltammetric methods in the phosphate buffer of pH 6.8 (number of replicated measurements = 4).
Table 2. Validation studies for the direct determination of 1.0 × 10⁻⁷ mol L−1 bulk DXT.HCl by means of the described SW-AdAS voltammetric method (number of replicated measurements = 4).
be considered rugged.
The selectivity [30] [31] of the described stripping voltammetric methods was identified through possible interferences from excipients usually present in the formulations. The commercial formulation; “Cymbalta® tablets” contains the active substance (DXT.HCl 30 mg per tablet) and other inactive ingredients. So, the effect of the excipients associated with DXT.HCl in its formulation was tested using the developed methods. This was carried out by recording voltammograms of various concentrations of standard solutions of bulk DXT.HCl (excipients are absent) and of the tested commercial formulation “Cymbalta® tablets”; containing such excipients. The voltammograms of all the tested solutions were similar and showed no any voltammetric peaks due to any of the frequently encountered excipients over the applied potential range (−0.2 to 0.8 V versus Ag/AgCl/3M KCl). Furthermore, insignificant differences in the percentage recoveries and relative standard deviations (R % ± RSD) were achieved in the absence (99. 73 ± 0.97 to 102.02 ± 1.48) and in the presence of such excipients (97.85 ± 2.24 to 98.59 ± 1.16). This indicates that the proposed methods do not suffer any interference from such commonly associated inactive additives in the level found in the preparation of tablet under consideration and consequently, they are highly selective towards DXT.HCl under the optimized experimental conditions.
4. Applications
4.1. Assay of Duloxetine HCl in “Cymbalta® Tablets”
The described LS-AdASV and SW-AdASV methods were successfully applied to
Table 3. Assay of DXT.HCl in its formulation (Cymbalta® tablets) by means of the described stripping voltammetric and a reported potentiometric method [13] .
(A) Using the calibration curve method and (B) Using the standard addition method. The theoretical values of F and t-test at 95% confidence limit for n1 = 5 and n2 = 5 (n = Number of replicated measurements) are 6.39 and 2.3, respectively.
direct determination of DXT.HCl in the commercial “Cymbalta® tablets” (as labeling to contain 30 mg DXT.HCl per tablet as an individual drug) without the necessity for samples pretreatment and/or time-consuming extraction steps prior to the analysis. The mean percentage recoveries of DXT.HCl, based on the average of five replicate measurements using the described methods are reported and statistically compared with those obtained by reported potentiometric method (Table 3) [13] . Since the calculated F-value did not exceed the theoretical values, which means that there was no significant difference between the proposed and reported methods with respect to the reproducibility [32] . Also, no significant differences were noticed between the proposed and reported methods regarding accuracy and precision as revealed by t-test [32] .
4.2. Assay of Duloxetine HCl in Human Serum
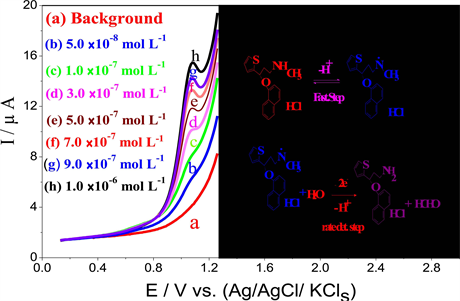
A quantitative assay of DXT.HCl spiked in human serum was carried out by the described LS-AdASV and SW-AdASV methods without the necessity for sample pretreatment and/or time consuming extraction or evaporation steps prior to the analysis. Representative SW-AdAS voltammograms of DXT.HCl spiked in human serum following preconcentration onto a CPE by adsorptive preconcentration are shown in Figure 5. As shown in Figure 5 (curve a), no interfering peaks were observed in the blank human serum within the studied potential range. The peak current (ip) of SW-AdASV method showed a linear dependence on the concentrations of DXT.HCl over the range 7.0 × 10⁻⁸ to 1.0 × 10⁻⁶ mol L−1 DXT.HCl (Figure 5), depending on the preconcentration time, following the regression equation: (ip (µA) = 5.055 C (µmol L−1) + 1.19; r = 0.980 and n = 6). Detection limit of 2.1 × 10⁻⁸ mol L−1 and quantitation limit of 7.0 × 10⁻⁸ mol L−1 DXT.HCl was achieved by the described SW-AdASV method. A similar behavior was recorded in case of LS-AdASV method, the peak current (ip) of LS-AdASV method showed a linear dependence on the concentrations of DXT.HCl over the range 2.0 × 10⁻⁷ to 5.0 × 10⁻⁶ mol L−1 DXT.HCl, depending on the preconcentration time, following the regression equation: (ip (µA) = 1.368 C (µmol L−1) + 0.514; r = 0.940 and n = 7). Detection limit of 6.0 × 10⁻⁸ mol L−1 and quantitation limit of 2.0 × 10⁻⁷ mol L−1 DXT.HCl was achieved by the described LS-AdASV method.
![]()
Figure 5. SW-AdAS voltammograms of various concentrations of DXT.HCl spiked in human serum. Inset: calibration curve: (a) Background; (b) 7.0 × 10⁻⁸; (c) 1.0 × 10⁻⁷; (d) 3.0 × 10⁻⁷; (e) 5.0 × 10⁻⁷; (f) 7.0 × 10⁻⁷ mol L−1; (g) 9.0 × 10⁻⁷ mol L−1; (h) 1.0 × 10⁻⁶ mol L−1, following preconcentration onto a CPE at Eacc = 0.1 V for 80 s in the phosphate buffer of pH 6.8; f = 60 Hz; a = 15 mV and ΔEs = 20 mV.
The obtained mean percentage recoveries and relative standard deviations by means of described LS-AdASV and SW-AdASV methods were 98.12 ± 2.23 and 98.64 ± 1.74, respectively. The results indicated that the described voltammetric methods are sensitive enough for assay of DXT.HCl in spiked human serum. Moreover, effects of various foreign species that are likely to be in biological samples on analysis of DXT.HCl spiked in human serum were also evaluated. This was performed by analysis of standard solutions of 5 × 10⁻⁶ mol L−1 DXT.HCl spiked with various excess amounts of some foreign species such as some common metal ions, excipients, and co-administrated drugs (e.g., Na+, K+, Ca2+, Mg2+, Zn2+, Cu2+, Fe3+, uric acid, glucose, sucrose, starch, gelatin, lactose, hypromellose, hydroxypropyl methylcellulose acetate succinate and sodium lauryl sulfate) under the optimum operational conditions (Table 4). The tolerance limit for foreign species was taken as the largest amount yielding a signal error of 5% for determination of DXT.HCl. The results in (Table 4) are good evidence for no competition between DXT.HCl species and added metal ions for surface sites indicating that the accumulation of the drug by adsorption at the electrode surface is the favor process. It was also found that the interferences from the other foreign species to the determination of DXT.HCl under the optimized experimental conditions were negligible indicating again the reliability of the optimized methods for the trace assay of DXT.HCl in spiked human serum.
Characteristics of the calibration curves and the achieved limits of detection (LOD) and quantitation (LOQ) by means of the developed stripping voltammetric methods are reported in Table 5.
Table 4. Interferences from foreign species on analysis of 5.0 × 10⁻⁶ mol L−1 DXT.HCl by the described SW-AdAS voltammetric method.
*For 5% signal error.
Table 5. Characteristics of the calibration curves of LS-AdAS and SW-AdAS voltammetric determination of DXT.HCl in bulk form and in spiked human serum in phosphate buffer of pH 6.8; tacc. = 80 s, Eacc = 0.1 V, at 25°C.
4.3. Applicability for Future Studies
One of the strengths of the present study is that it reports a novel square wave, linear sweep and cyclic voltammetric methods that are quick, sensitive, accurate, precise and in expensive compared to most of the reported methods as potentiometric methods for the quantitation of DXT.Hcl in human plasma of real samples and for pharmacokinetic studies. One shortcoming of the present study may be noted as the method was qualified and validated. However, a full validation was not the aim of the current pilot study, but to qualify the method and apply it for pharmacokinetic studies in human serum. The significance of the current study is that the method qualification results obtained may provide useful information to assess the feasibility of expanding the process to larger studies in the future where the method is fully validated by using modifier carbon paste electrodes as carbon nanotubes.
5. Conclusion
DXT.HCl has been oxidized at a CPE via 2-electron due to oxidation of its secondary amino group. The strong adsorption phenomenon of DXT.HCl can be used as an effective preconcentration step prior to the actual voltammetric quantification of the analyte. Two precise linear sweep and square wave adsorptive anodic stripping voltammetry methods have been described for its trace quantitation in pharmaceutical formulation and human serum. The methods were simple, rapid, and in expensive and sophisticated apparatus or expensive solvents, in comparison with other methods used previously for the study of DXT.HCl. So the proposed method can be used for the routine analysis of DXT.HCl, either alone or in its pharmaceutical formulations. However, the proposed SW-AdASV method has a better detection limit in spiked human serum (LOD = 2.1 × 10⁻⁸ mol L−1), therefore it is sensitive enough for assay of DXT.HCl in human plasma of real samples and for pharmacokinetic studies. It can be also recommended for its quantification in quality control and clinical laboratories.
Acknowledgements
The author wish to express his gratefulness to Professor Mohamed M. Ghoneim and all his lab members specially Dr. Mohamed Mubark for collaborative research assistance.
Cite this paper
Hassanein, A.M., Moharram, Y.I., Oraiby, N.F. and Ebied, S.E. (2017) Trace Determination of Duloxetine HCl in Formulation and Spiked Human Serum at a Carbon Paste Electrode. American Journal of Analytical Chemistry, 8, 708-725. https://doi.org/10.4236/ajac.2017.811052
References
- 1. Freeman, M.P., Hirschberg, A.M., Wang, B., Petrillo, L.F., Connors, S., Regan, S., Joffe, H. and Cohen, L.S. (2013) Duloxetine for Major Depressive Disorder and Daytime and Nighttime Hot Flashes Associated with the Menopausal Transition. Maturitas, 75, 4-170. https://doi.org/10.1016/j.maturitas.2013.03.007
- 2. Sultan, A., Gaskell, H., Derry, S. and Moore, R.A. (2008) Duloxetine for Painful Diabetic Neuropathy and Fibromyalgia Pain: Systematic Review of Randomised Trials. BMC Neurology, 8, 29. https://doi.org/10.1186/1471-2377-8-29
- 3. Ball, S., Marangell, L.B., Lipsius, S. and Russell, J.M. (2013) Brain-Derived Neurotrophic Factor in Generalized Anxiety Disorder: Results from a Duloxetine Clinical Trial. Progress in Neuro-Psychopharmacology & Biological Psychiatry, 43, 21-217.https://doi.org/10.1016/j.pnpbp.2013.01.002
- 4. Bennett, R., Russell, I.J., Choy, E., Spaeth, M., Mease, P., Kajdasj, D., Walker, D., Wang, F. and Chappell, A. (2012) Evaluation of Patient-Rated Stiffness Associated with Fibromyalgia: A Post-Hoc Analysis of 4 Pooled, Randomized Clinical Trials of Duloxetine. Clinical Therapeutics, 34, 37-824. https://doi.org/10.1016/j.clinthera.2012.02.013
- 5. Leewen, J.H.S., Lange, R.R., Jonasson, A.F., Chen, W.J. and Viktrup, L. (2008) Efficacy and Safety of Duloxetine in Elderly Women with Stress Urinary Incontinence or Stress-Predominant Mixed Urinary Incontinenc. Maturitas, 60, 47-138.
- 6. Mihaylova, B., Pitman, R., Tincello, D., Vaart, H., Tunn, R., Timlin, L., Quail, D., Johns, A. and Sculpher, M. (2010) Cost-Effectiveness of Duloxetine: The Stress Urinary Incontinence Treatment (SUIT) Study. Value Health, 13, 72-565. https://doi.org/10.1111/j.1524-4733.2010.00729.x
- 7. Mercolini, L., Mandrioli, R., Cazzolla, R., Amoreb, M. and Raggi, M.A. (2007) HPLC Analysis of the Novel Antidepressant Duloxetine in Human Plasma after an Original Solid-Phase Extraction Procedure. Journal of Chromatography B, 856, 7-81.
- 8. Patel, S.K., Patel, N.J., Patel, K.M., Patel, P.U. and Patel, B.H. (2008) Estimation of Duloxetine Hydrochloride in Pharmaceutical Formulations by RP-HPLC Method. Indian Journal of Pharmaceutical Sciences, 70, 825-827. https://doi.org/10.4103/0250-474X.49136
- 9. Bhimanadhuni, C.N., Garikapati, D.R. and Srinivas, C. (2012) Development and Validation of RP-HPLC Method for Determination of Duloxetine Hydrochloride in Bulk and Dosage Form. International Current Pharmaceutical Journal, 5, 98-102.
- 10. Boopathy, D., Jawarkar, R.D., Prakash, M., Mathew, B. and Perumal, P. (2010) New RP-HPLC Method Development and Validation Determination for Estimation of Duloxetine hcl in Enteric Coated Capsules. International Journal of ChemTech Research, 2, 239-241.
- 11. Raman, N.V., Harikrishna, K.A., Reddy, K.R., Prasad, A.V. and Ramakrishna, K. (2010) Determination of Duloxetine Hydrochloride in the Presence of Process and Degradation Impurities by a Validated Stability-Indicating RP-LC Method. Journal of Pharmaceutical and Biomedical Analysis, 51, 7-994.
- 12. Reddy, P.B. (2009) Validation and Stability Indicating Reverse Phase-High Performance Liquid Chromatography for the Determination of Duloxetine in Tablets. International Journal of ChemTech Research, 3, 5-602.
- 13. Alarfaj, N.A., Ammar, R.A. and El-Tohamy, M.F. (2012) Disposable Screen-Printed Sensors for Determination of Duloxetine Hydrochloride. Chemistry Central Journal, 6, 6. https://doi.org/10.1186/1752-153X-6-6
- 14. Yunoos, M., Sankar, D.G., Kumar, B.P., Hameed, S. and Hussain, A. (2010) Simple UV Spectrophotometric Determination of Duloxetine Hydrochloride in Bulk and in Pharmaceutical Formulations. European Journal of Chemistry, 7, 785-788. https://doi.org/10.1155/2010/709176
- 15. Amirtha, R.V., Ramesh, T. and Phani, K.A. (2011) A Validated UV Spectrophotometric Determination of an Antidepressant Drug-Duloxetine Hydrochloride from Capsule Formulations. International Journal of Pharma and Bio Sciences, 2, 717.
- 16. Chadha, R. and Bali, A. (2015) Development and Validation of Stability Indicating Derivative Spectrophotometric Methods for Determination of Duloxetine Hydrochloride. British Journal of Pharmaceutical Research, 6, 414. https://doi.org/10.9734/BJPR/2015/17814
- 17. Alarfaj, N.A., Ammar, R.A. and El-Tohamy, M.F. (2013) Stability Indicating Spectrofluorimetric Method for Determination of Duloxetine Hydrochloride in Bulk and in Dosage Form. Asian Journal of Chemistry, 25, 6416.
- 18. Wang, J. (2000) Analytical Electrochemistry. 2nd Edition, Wiley-VCH, New York. https://doi.org/10.1002/0471228230
- 19. Zuman, P. (1969) The Elucidation of Organic Electrode Processes. Academic Press, New York.
- 20. Meits, L. (1965) Polarographic Techniques. 2nd Edition, Interscience Publishers, New York, 248.
- 21. Webber, A., Shah, M. and Osteryoung, J. (1984) A Theoretical and Experimental Study of a Two-Step Quasireversible Surface Redox Reaction by Square-Wave Voltammetry. Analytica Chimica Acta, 157, 1-16.
- 22. Laviron, E., Roullier, L. and Degrand, C. (1980) A Multilayer Model for the Study of Space Distributed Redox Modified Electrodes: Part II. Theory and Application of Linear Potential Sweep Voltammetry for a Simple Reaction. Journal of Electro-analytical Chemistry, 112, 11-23.
- 23. Nicholson, R.S. and Shain, I. (1964) Theory of Stationary Electrode Polarography. Single Scan and Cyclic Methods Applied to Reversible, Irreversible, and Kinetic Systems. Analytical Chemistry, 36, 706-723. https://doi.org/10.1021/ac60210a007
- 24. Greef, R., Peat, R., Peter, L.M., Pletcher, D. and Robinson, J. (1985) Instrumental Methods in Electrochemistry. Ellis Horwood Limited, John Willy & Sons, New York.
- 25. Boyd, M.J. and Logan, M.A. (1942) Colorimetric Determination of Serine. The Journal of Biological Chemistry, 146, 279-287.
- 26. Eegriwe, E. (1937) Reaktionen und Reagenzien zum Nachweis organischer Verbindungen IV. Formaldehyd. [Reactions and Reagents for the Detection of Organic Compounds IV. Formaldehyd.] Fresenius’ Journal of Analytical Chemistry, 110, 22-25. https://doi.org/10.1007/BF01392026
- 27. Kalvoda, R. (1984) Adsorptive Stripping Voltammetry of Electroactive Organic Compounds. Analytica Chimica Acta, 162, 197-205.
- 28. Nigovic, B., Komorsky-Lovric, S. and Simunic, B. (2005) Electroanalytical Studies of Biologically Active Azosalicylic Acid at a Hanging Mercury Drop Electrode. Electroanalysis, 17, 839. https://doi.org/10.1002/elan.200403160
- 29. Miller, J.C. and Miller, J.N. (1993) Statistics for Analytical Chemistry. 3rd Edition, Ellis Harwood Series, Prentice Hall, New York.
- 30. ICH Guideline Q2A (R1) (2005) Validation of Analytical Procedures. Text and Methodology.
- 31. United States Pharmacopoeia Convention (2003) The United States Pharmacopoeia: The National Formulary. 26th Edition, Convention Inc.
- 32. Christian, G.D. (1994) Analytical Chemistry. 5th Edition, John Wiley & Sons Inc.