American Journal of Analytical Chemistry
Vol. 4 No. 2 (2013) , Article ID: 28175 , 7 pages DOI:10.4236/ajac.2013.42011
Humidity Sensitive Characteristics of Porous Li-Mg-Ti-O-F Ceramic Materials
1Laboratory of Materials, Catalysis, Environment and Analytical Methods (MCEMA/CHAMSI), Doctoral School of Sciences and Technology (EDST), Faculty of Agricultural Engineering and Veterinary Medicine and Faculty of Sciences, Lebanese University, Beirut, Lebanon
2LUSAC (EA4253), Site Universitaire, Cherbourg-Octeville, France
3Faculty of Engineering, Lebanese University, Beirut, Lebanon
Email: *tayssir.hamieh@ul.edu.lb, a.kassas.mcema@ul.edu.lb
Received November 27, 2012; revised December 28, 2012; accepted January 5, 2013
Keywords: Ceramic Humidity Sensor; Magnesium Titanate; Li2MgTiO4; Capacitance; Resistance
ABSTRACT
Ceramic porous MgTiO3 materials have been prepared by classical solid-state route. The sintered pellets of MgTiO3 with different LiF contents were characterized for humidity-sensing application. The sintered disks of these mixtures were subjected to capacitance measurements at 20˚C as function of the relative humidity from which revealed that the Mixture MgTiO3 + 2% LiF (w/w) has the better characteristics. The disks were subjected to DC resistance measurements as a function of relative humidity in the range 15% - 95% RH. The selectivity of this material was discussed and compared to commercial sensor results. The response and recovery characteristics were assessed.
1. Introduction
The use of sensors is well established in process Industries, agriculture, medicine, and many other areas, the development of new sensing materials with high sensing capabilities is proceeding with high rate. Consequently, several materials have recently been developed for making the sensitive part of humidity sensors, such as polymeric materials, electrolytic materials and ceramic materials [1].
However, many kinds of ceramic materials such as MgCr2O4-TiO2 [2], ZnCr2O4-ZnO [3], La2O3-TiO2 [4]…, have been investigated for this application because they are sintered form improve physical, chemical and thermal stable properties [5].
The adsorption of water vapor enhances the surface electrical conductivity (impedance, capacitance, resistance) of ceramic metal oxides [6]. However, the humidity sensors normally exposed not only to water vapor, but to atmospheres containing various other components tend to lose their inherent humidity-sensitive properties during use due to several complicated physical and chemical processes between these components and various materials.
The problems of irreversible response due to chemisorbed water and deterioration due to adhesion of dust, dirt, oil, etc. remain unsolved, and make a new way of competition in material developing research. Whatever, the most promising approach seems to be to find a ceramic material with surface resistivity reversibly responsive to relative humidity (RH), which is not easily changed by repeated water vapor adsorption-desorption cycles and repeated heat-cleaning cycles at high temperatures, and selective to water vapor molecules.
Magnesium titanate MgTiO3 ilmenite structure, is known as a compound for type I ceramic capacitors [7,8], and which have important applications in microwave communication systems [9]. Nevertheless, sintered ceramic disks MgTiO3 with LiF additive have shown recently sensitivity to humidity [10]. A study of the sensitivity of MgTiO3-LiF porous ceramic materials is carried out in this paper.
2. Experimental Part
2.1. Experimental Procedure
MgTiO3 powder with stoechiometry Mg/Ti = 1.025 was synthesized by the classical solid-state route [11]. The starting powders (MgO Cerac 99%, TiO2 Prolabo 99%) were mixed together for one hour in demineralised water by attrition milling (Dyno Mill KDLA, BACHOFEN, Switzerland) using 0.8 mm diameter yttried stabilized zircon balls (YTZ grinding media TOSOH).
The powder mixture was then calcined in air at 1000˚C for one hour in order to form the ilmenite phase. The phase formation was noticed by X-ray diffraction. The diffraction patterns were collected using a SIEMENS D 5005 diffractometer with CuKα (λ = 1.5405Å), in the range 15˚ - 85˚ (2θ)).
After calcinations, LiF was added and the powders were milled in a planetary agitator (Pulverisette FRITCH with agate bawl and balls). Three compositions are prepared by mixing 1%, 2% and 5% LiF (w/w) with the prepared MgTiO3 (respectively called ML1, ML2 and ML5). The 1% by mass of lithium fluoride compound corresponds to 4.97% (as molar percentage).
The different compositions were pressed at 2000 kg∙cm−2 (at a pressure of 74 MPa) to obtain disks 25 mm in diameter and around 2 mm thick. Densification behavior was studied by dilatometric measurements performed in air on TMA92 SETARAM dilatometer, with 300˚C∙h−1 heating and 1200˚C∙h−1 cooling rates. The disks were fired in air at different temperatures, with 150˚C∙h−1 heating and cooling rates and one hour dwell time. Interconnected porosity was measured using MICROMERITICS AutoPore III mercury porosimeters.
2.2. Electrical and Dielectrical Measuring Instruments
After sintering, a design was screen printed (gold ink) on the surface of the samples in order to obtain the outline for the electrical and dielectrical measurements. The length of the electrodes is 16 mm for 1 mm width, with 0.5 mm space between two electrodes.
After screen-printing, the samples were calcined at 850˚C in air for 15 minutes with heating and cooling rates of 400˚C∙h−1. The dielectric and electrical properties of surfaces were characterized by measuring the dependence of capacitance and insulation resistance with the moisture rate in air.
An oven “hot-cold” controlled humidity in a range of 10% to 95% RH and a temperature controller between −50˚C to 100˚C was used (SECASI technologies SLH 100).
The components were characterized by measurements at various frequencies of their capacitance and their insulation resistance as well as by measuring the insulation resistance under continuous electric field.
To perform measurements under ac field, a multiplexer “Agilent Data Acquisition/Switch Unit 34970A” is used. The RLC bridge “AUTOMATIC PROGRAMMABLE FLUKE PM6306 RCL Meter”, shows the change in capacitance and resistance with a (ac/dc) current regulator whose frequency can be change between 60 Hz and 1 MHz.
The electrical properties measurement of the sample by the RLC bridge is based on the method of current and voltage. This method consists in measuring the voltage and current and converted them to binary values, used by the CPU to calculate the electric parameters of the sample. In the case of measurements with alternating voltage a cycle of seven individual measures are stored and evaluated by calculation. Using these values, the microprocessor calculates the first equivalent series resistance Rs, the series equivalent reactance Xs and the quality factor Q (Q = ±Xs/Rs) of the sample. The Q value and the polarity of Xs determine the choice of dominant component of the sample, inductive or capacitive respectively if Xs is positive or negative. In our case under ac field, Xs < 0 and the component is capacitive Cp = 1/w (1 + 1/Q2)(±Xs), w = 2πN, N is the frequency.
The resistance of the samples was measured under dc electric field with a Megohmeter “Sefelec M1500P” by applying a voltage gradient of 70 V∙mm−1 between the electrodes, for 10 minutes before each measurement allowing values to be stable.
The response time of a humidity sensor is the necessary time to give repeatable readings of RH in the atmosphere. The response times of existing sensors on the market range from a few minutes (sensors ceramics and polymers) to three hours (condensation hygrometers).
A device was developed by our team with the aim to measure the response time under ac field. They have two rooms, each with humidity and temperature sensors. In one room, a dry atmosphere of about 4% ± 2.5% RH is prepared and in the second room saturated environment of about 95% ± 2.5% is created. A cap equipped with a sample holder with wire connection to the bridge RLC controlled using a computer to measure the continuous capacitance values of the sample. Rotating cap allows the sample to pass from one room to another (wet to dry and vice versa too) while measuring directly the change in capacitance as a function of time.
3. Results and Discussions
When submitting a dielectric material to an electromagnetic field of very low frequency, atomic and ionic polarization mechanisms are activated, and dielectric constant can be significant. However, when the frequency is very high, only the electronic polarization mechanism is active, the others being characterized by inertia of motion of electric charges such that they are not more efficient. Beyond 1017 Hz, the mass of electrons is itself too large for they can follow the excitement: the material has a dielectric behavior similar to empty space [12].
At 50% and 80% RH, the capacitance change was measured by scanning the measurement frequency between 60 Hz and 1 MHz. Figure 1 presents the results measured for ML2 pellet sintered on a bed of powder for one hour at 1000˚C with a ramp 150˚C∙h−1. According to the curves, we can notice the importance of the effect of the measurement frequency increases with the percentage of moisture. As frequency increases more, the capacity
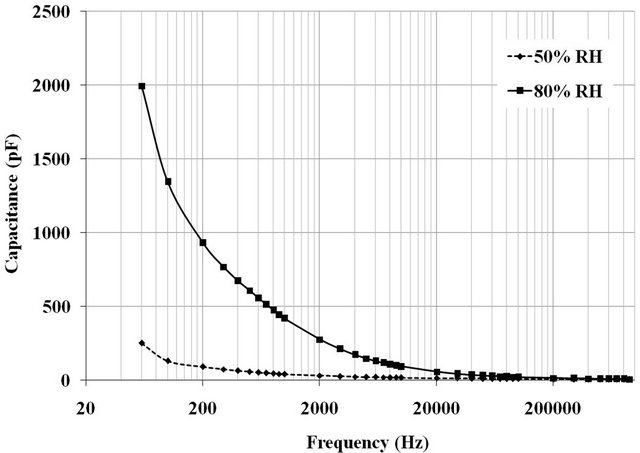
Figure 1. Variation in the capacitance of the ML2 pellet sintered at 1000˚C as a function of frequency measurement at 50% and 80% of relative humidity.
tends to low values. It is therefore advantageous to use a low frequency. Previous studies had determined that the optimal frequency was 100 Hz [13].
The relative change in capacitance as a function of the %RH on the surface of various sintered pellets for one hour at 1000˚C with a ramp 150˚C∙h−1 is shown on Figure 2.
Whatever the composition of the pellet, the sensitivity is in the same range, between 60% and 90% RH and there is no significant change of the capacitance was detected below 60% RH. The curves show that the ML1 is the most sensitive pellet and the lowest sensitivity is recorded for ML5 pellet.
According to the structural analysis of surfaces of the pellets sintered at 1000˚C shown in Figure 3, the pellets ML1 and ML2 have the same phases on the surface: the MgTiO3 and the face-centered cubic (FCC) phase isomorphous with Mg2TiO4, while the dominant phase in the surface of the pellet ML5 is the FCC phase Li2MgTiO4.
SEM analysis is made on the surface of transverse sections pellets. It can be seen on the SEM micrographs of pellets sections ML2 sintered for one hour at 900˚C, 1000˚C and 1100˚C (Figures 4 (a)-(c)), a change in the micro-structure at the upper surface. Precisely a surface layer with high porosity and rectangular grain form and grain size smaller than 10 µm are occurred at 900˚C. The grain size of ceramics at the pellet center does not exceed 5 μm. At higher sintering temperatures (1000˚C and 1100 ˚C), on pellet surface, the grains size respectively less than or equal to 15 µm and 10 µm are clearly highlighted. However, the samples sintering with high LiF content (5% w/w) causes on the surface (Figures 4 (d)-(f)), the formation of oriented grains layer (columnar structure). The grains sizes at the surface of ML5 pellets have vary between 20 and 50 µm when the sintering is carried out at 1000˚C and up to 60 µm at 1100˚C. Distinct morphologies types are present on the cross sections for each sintering temperatures. The structural, microstructural and the com-
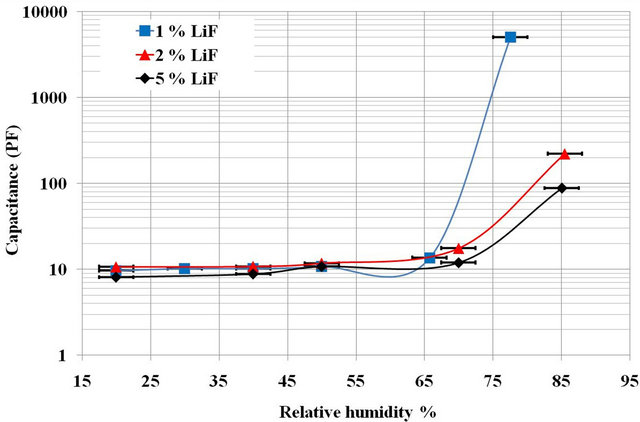
Figure 2. Capacitance variation as a function of relative humidity percentage for pellets prepared with different amount of LiF sintered at 1000˚C.
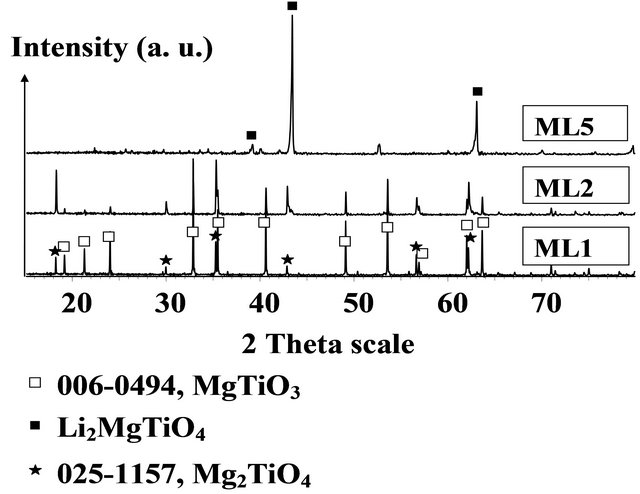
Figure 3. XRD diffractograms of the surfaces of pellets ML1, ML2 and ML5 sintered at 1000˚C.
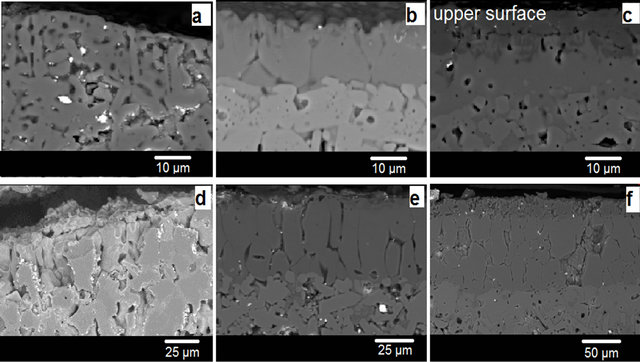
Figure 4. Scanning electron micrographs of ML2 surfaces cross-section (a), (b) and (c) sintered respectively at 900˚C, 1000˚C, 1100˚C. And the scanning electron micrographs of ML5 surfaces cross-section (d), (e) and (f) sintered respectively at 900˚C, 1000˚C, 1100˚C.
positions variation study of those samples as function of sintering temperature, were developed in details in a previous study [14].
On other hand, The volume percentage of total porosity is 19% ± 2% against 10% ± 2% respectively for ML1 and ML2 and 15% ± 2% for ML5 (Table 1) and the distribution of pore size shows that the pellet ML1 has a volume percentage of pores with diameters between 0.1 and 3 µm (16% ± 2%) greater than that of ML2 pellet (5% ± 2%) and than that of ML5 (9% ± 2%). It can be assumed that the surface sensitivity is greater when the phase surface is isomorphic to Mg2TiO4 and when the volume percentage of medium pore (0.1 to 3 µm) is important. Given these results, we chose the composition ML2 to study the variation of dielectric and electrical properties, because of its sintering temperature (Ts = 1050˚C) lower than ML1 (Ts > 1350˚C) [14] and its higher sensitivity compared to that of ML5.
The curves of the relative change in capacitance as a function of the %RH, for the pellets ML2 sintered in a powder bed for one hour at 800˚C, 900˚C, 1000˚C and 1100˚C with a ramp of 150˚C∙h−1 (Figure 5) show that the pellet sintered at 900˚C is the most sensitive. However, there is no variation detected of capacitance below 60% RH.
According to the structural study by X-ray diffraction on the surfaces of these pellets (Figure 6), the phases on surfaces of the pellets sintered at 800˚C and 900˚C are MgTiO3 and FCC phase Li2MgTiO4, while the phases on the surfaces of sintered pellets at 1000 and 1100˚C are MgTiO3 phase and FCC phase identified as that of
Table 1. Pore volume percentage (±2%) distribution as function of pore size distribution and total pore volume percentages (uncertainty: ±2%) for the pellets MLX (or X = 1, 2 and 5) sintered at 1000˚C.


Figure 5. Capacitance variation of the surface of ML2 pellets sintered at 800˚C, 900˚C, 1000˚C and 1100˚C as a function of the relative humidity.
Mg2TiO4.
The capacitance values of the ML2 sintered at 1100˚C are lower than capacitance values of the others pellets. However, the same phases are detected by XRD and the porosity values are very close. while, this phenomenon can be explained by the increasing of thick crust formed on the surface of ML2 sample when the sintering temperature increase [14] and this crust layer could distort the measurement of the porosity at 1000˚C and 1100˚C (Figure 4 (d)).
If we compare the distribution of the volume percentage of pores, according to pore size (Table 2), with the nature of the present phases, we see a correlation between the increasing of volume percentage of pores with small diameters less than 0.1 µm, and the presence of the FCC phase Li2MgTiO4 on surface.
Their presence leads to the increased sensitivity of the pellet. Indeed, the pellet sintered at 900˚C has the largest volume percentage of pores with small diameters (<0.1 µm) of around 14% ± 2%, the others volume percentage of the average pore diameters (0.1 - 3 µm) and (greater than 3 µm) are close to that of the pellets sintered at (1000 and
Table 2. Pore volume percentage (±2%) distribution as a function of pore size and total pore volume percentages (uncertainty: ±2%) for the pellets ML2 sintered at 800˚C, 900˚C, 1000˚C and 1100˚C.
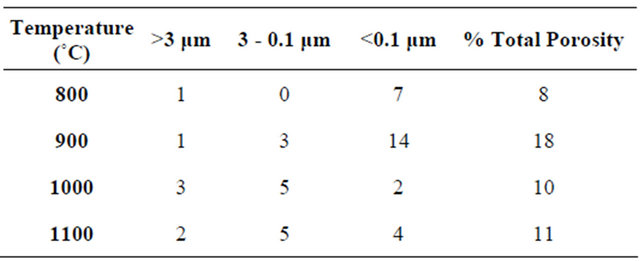
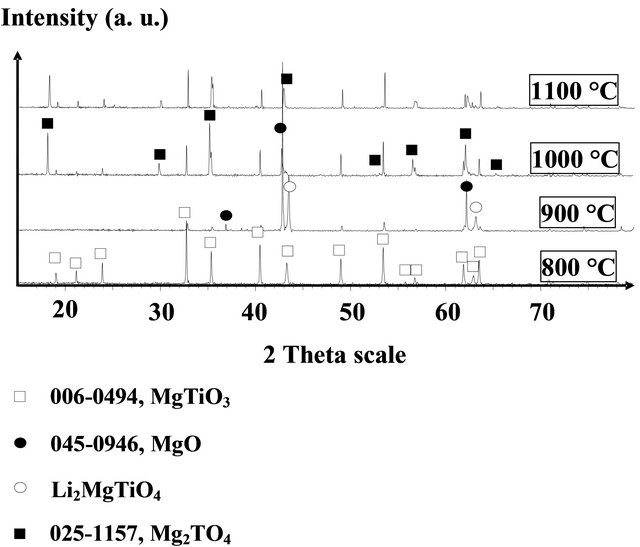
Figure 6. XRD diffractograms of the surfaces of pellets ML2 sintered at 800˚C, 900˚C, 1000˚C and 1100˚C.
1100˚C).
Measuring the variation of the capacitance surface presented marginally sensitivity between 60% and 90% RH and no sensitivity below 60% RH. It is interesting to found another dielectrical or electrical property, which allows increasing the margin of sensitivity to moisture and preferably ranging over the entire range of RH as possible between 20% and 90%.
The relative change in resistance measured with the insulation tester in a wide range of RH for the pellet ML2 sintered at 900˚C. The values range between 200 MΩ at 20% RH and 200 KΩ at 90% RH (Figure 7). The resistance measurement has a sensitivity of ceramics over the entire range from 20% to 90% RH, contrary to what was observed for the capacitive measurement that showed sensitivity between 60% and 90% RH.
This variation can be explained by the phenomenon of conduction in low relative humidity atmosphere, provided by the jump of a proton (H+) of a hydroxyl group to another adjacent group in the chemisorbed layer of water molecules [6]. The activation energy of the proton is very high that is why in a low RH, where a layer of chemisorbed water molecule is present, the resistance values are very high.
At high RH, physisorbed layers of water molecules are formed and the conduction in this case will be handled by the transfer of hydronium ions (H3O+) with activation energy lower than that of the H+ ion of hydroxyl groups. This leads to lower resistance values.
However, the study of the response of the pellets during an adsorption-desorption cycle showed a hysteresis in the range of sensitivity (Figure 7). This hysteresis is due to conservation or output delay of water molecules during desorption which is due to the porosity that hinders desorption of the water molecules.
The response time test performed for ML2 pellets sintered at different temperatures showed that the pellets
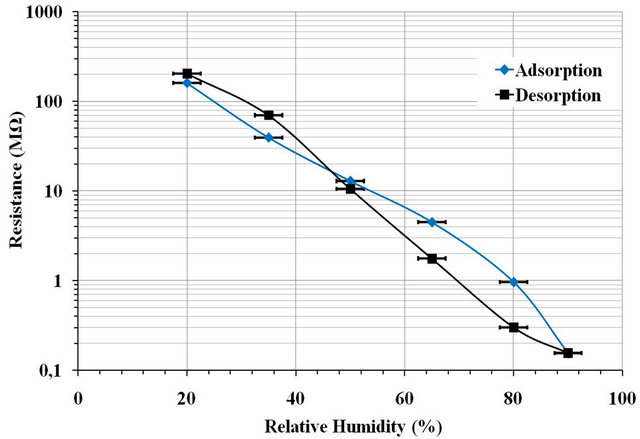
Figure 7. Resistance variation hysteresis of ML2 pellet sintered at 900˚C as a function of the relative humidity percentage at 70 V·mm−1 DC.
sintered at 1000˚C have the better rapid and reproducible response time, with an adsorption time of 150 seconds and desorption very fast, 20 seconds. The capacity ranges from 7600 pF at 95% ± 2.5% RH to 400 pF at 4% ± 2.5% RH. On the contrary, desorption still remains incomplete (Figure 8). However, the response time of the ML2 pellet sintered at 900˚C is slow 1000 seconds in adsorption and the desorption never reaches the initial value. We recall that the porosity in the sintered pellet at 1000˚C (10% ± 2%) is lower than that sintered at 900˚C (18% ± 2%), and small pores (<0.1 µm) have a percentage of 2% ± 2% in the first and 14% ± 2% in the sintered pellet to 900˚C.
The best response time shown by the pellet ML2 sintered at 1000˚C, is accompanied by a high sensitivity of the measurement of surface resistance between 20% and 80% RH in the range tested temperatures of the environment ranging from 20˚C to 60˚C.
In the hot-cold oven (described before), controlled by continuous measuring of the temperature and the relative humidity, the relative humidity is stabilized by pulverizetion of water vapor molecule automatically and our measurements were established when the humidity was stable. The curve at 20˚C (Figure 9) shows that the pellet has a resistance which decreases when the RH increases from 55 MΩ at 20% RH up to 20 kΩ at 80% RH. However, the measured resistance is lower when the atmosphere is warmer. Note that the resistance values are similar for both temperatures 40˚C and 60˚C.
The selectivity of the sensor is a very important property to quantify the actual RH in the air without being distorted by the presence of other gas molecules in the atmosphere of the measurement. Samples ML2 sintered at 1000˚C showed a signal of 7000 pF in an atmosphere saturated with water vapor (Figure 8) were tested in different gas atmospheres at 25˚C by using the same device developed in the laboratory for the measurement of sample response time under ac field.
As described before, this device has two rooms, each with a humidity and temperature sensors. However the
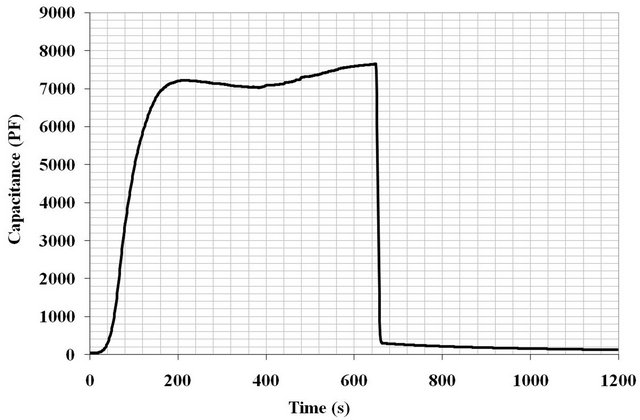
Figure 8. Response time of ML2 pellet sintered at 1000˚C and characterized under 100 Hz.
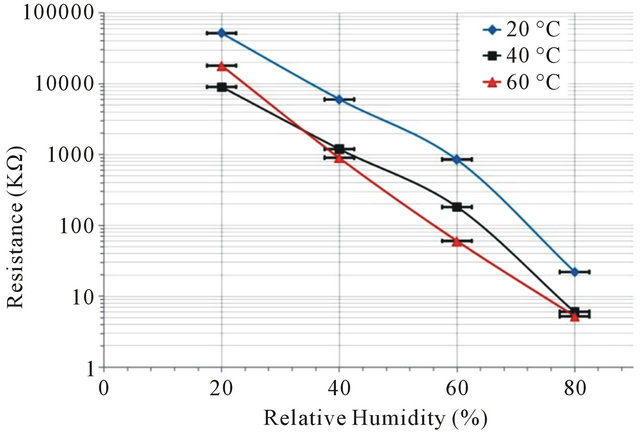
Figure 9. Resistive performance of ML2 pellets sintered at 1000˚C on environments at 20˚C, 40˚C and 60˚C, depending on the relative humidity percentage.
first room was saturated, each time, by one of the three different molecules (methanol vapor, ethanol vapor and cigarette smoke), and in the second room a dry atmosphere (about 4% ± 2.5% RH) is prepared. A cap equipped with a sample holder (where the ML2 samples are fixed) with wire connection to the bridge RLC controlled using a computer permits to measure the continuous capacitance values of the sample. Rotating cap allows the sample to pass from one room to another while measuring directly the change in capacitance as a function of time. When the ML2 sample was exposed to this three vapor-saturated atmosphere, the capacities measured did not exceed 5 pF after 10 min of exposure (Figure 10).
This shows that the material is not sensitive to methanol to ethanol and cigarette smoke. It presents a selective sensitivity to the water molecule and the presence of impurities in the atmosphere to control does not distort the measurement. These results were compared to those obtained with a commercial sensor-based polymer (SHT75, Sensirion®), used in our laboratory. The latter indicated RH equal to 100%, 62% and 91.5% successively in atmospheres saturated with molecules of methanol, ethanol and cigarette smoke. The resistive measurement of the samples is not possible until this moment by our device however it well be very important to measure it in these different saturated atmospheres.
4. Conclusion
Sintered pellet of MgTiO3 mixed with 2% LiF (w/w) showed higher sensitivity compared to the other compositions in a wide range of RH (20% - 90% RH) and a reliable response time (150 seconds) for a percentage change in RH from 5% to 95%. The best sintering temperature is verified 1000˚C. This compound gave a short and repeatable response time. It is important to note that this sensitivity is observed in the case of surface resistance measurements, while measurements of surface ca-

Figure 10. Selectivity test of ML2 pellet sintered at 1000˚C.
pacitance do not show an exploitable behavior for measurement of humidity above 60% RH. In the ambient atmosphere between 10% and 90% RH the ML2 compound is sensitive and could be used as a ceramic humidity sensor. However the hysteresis problem remains unresolved and probably come from the porosity of our samples. This material shows as promising humidity sensitive part in the range 20% - 90% RH with selectivity properties to water molecules. The capacitance measurement in the response time test shows that this material does not need a heat-cleaning step to releases the adsorbed water molecules.
REFERENCES
- E. Traversa, “Ceramic Sensors for Humidity Detection: The State-of-the-Art and Future Developments,” Sensors and Actuators B: Chemical, Vol. B23, No. 2, 1995, pp. 135-156.
- T. Nitta, Z. Terada and S. Hayakawa, “Humidity-Sensitive Electrical Conduction of MgCr2O4-TiO2 Porous Ceramics,” Journal of the American Ceramic Society, Vol. 63, No. 5-6, 1980, pp. 295-300.
- S. Pokhrel, B. Jeyaraj and K. S. Nagaraja, “HumiditySensing Properties of ZnCr2O4-ZnO Composites,” Materials Letters, Vol. 57, No. 22-23, 2003, pp. 3543-3548. doi:10.1016/S0167-577X(03)00122-8
- Y. Shimizu, H. Okada and H. Arai, “Humidity-Sensitive Characteristics of Porous La-Ti-V-O Glass-Ceramics,” Journal of the American Ceramic Society, Vol. 72, No. 3, 1989, pp. 436-441.
- T. J. Hwang and G. M. Choi, “Humidity Response Characteristics of Barium Titanate,” Journal of the American Ceramic Society, Vol. 76, No. 3, 1993, pp. 766-768. doi:10.1111/j.1151-2916.1993.tb03675.x
- J. H. Anderson Jr. and G. A. Parks, “The Electrical Conductivity of Silica Gel in the Presence of Adsorbed Water,” Journal of Physical Chemistry, Vol. 72, No. 10, 1968, pp. 3662-3668. doi:10.1021/j100856a051
- Q.-L. Zhang, H. Yang and J.-X. Tong, “Low-Temperature Firing and Microwave Dielectric Properties of MgTiO3 Ceramics with Bi2O3-V2O5,” Materials Letters, Vol. 60, No. 9-10, 2006, pp. 1188-1191. doi:10.1016/j.matlet.2005.10.105
- J. Bernard, F. Belnou, D. Houivet and J.-M. Haussonne, “Low Sintering Temperature of MgTiO3 for Type I Capacitors,” Journal of the European Ceramic Society, Vol. 25, No. 12, 2005, pp. 2779-2783. doi:10.1016/j.jeurceramsoc.2005.03.139
- X. M. Chen, L. Li and X. Q. Liu, “Layered Complex Structures of MgTiO3 and CaTiO3 Dielectric Ceramics,” Materials Science and Engineering: B, Vol. 99, No. 1-3, 2003, pp. 255-258. doi:10.1016/S0921-5107(02)00493-2
- J. Bernard, D. Houivet, M. Hervieu and J.-M. Haussonne, “Evidence of the Formation of a New Rock-Salt Type Compound Li2MgTiO4 and of Its Role on the Properties of the Li Doped MgTiO3,” Solid State Sciences, Vol. 8, No. 6, 2006, pp. 598-605. doi:10.1016/j.solidstatesciences.2006.01.010
- C. Vigreux, B. Deneuve, J. El Fallah and J.-M. Haussonne, “Effect of Acceptor and Donor Additives on the Properties of MgTiO3 Ceramics Sintered under Reducing Atmosphere,” Journal of the European Ceramic Society, Vol. 21, No. 10-11, 2001, pp. 1681-1684. doi:10.1016/S0955-2219(01)00092-9
- J.-M. Haussonne, C. Carry, P. Bowen and J. Barton, “Céramiques et Verres Principes et Techniques D’élaboration: Vol. 16,” Traité des Matériaux, Presse Polytechniques et Universitaires Romandes, Lausanne, 2005.
- J. Bernard, D. Houivet, M. Hervieu and J.-M. Haussonne, “Evidence of the Formation of a New Rock-Salt Type Compound Li2MgTiO4 and Its Role on the Properties of the Li Doped MgTiO3,” Solid State Sciences, Vol. 8, No. 6, 2006, pp. 598-605. doi:10.1016/j.solidstatesciences.2006.01.010
- A. Kassas, J. Bernard, C. Lelievre, D. Houivet and T. Hamieh, “Sintering Study of Ceramic Material Based on Magnesium Titanate in Presence of Lithium Fluoride Additives,” Journal of Materials Science and Engineering (A & B), Vol. 2, No. 7, 2012, pp. 550-559.
NOTES
*Corresponding author.