Journal of Geoscience and Environment Protection
Vol.06 No.01(2018), Article ID:81797,19 pages
10.4236/gep.2018.61003
Assessing Weather Research and Forecasting (WRF) Model Parameterization Schemes Skill to Simulate Extreme Rainfall Events over Dar es Salaam on 21 December 2011
Triphonia Jacob Ngailo1*, Nyimvua Shaban1, Joachim Reuder2, Michel D. S. Mesquita3, Edwin Rutalebwa4, Isaac Mugume5, Chiku Sangalungembe6
1Department of Mathematics, University of Tanzania, Dar es Salaam, Tanzania
2Geophysical Institute, University of Bergen, Bergen, Norway
3Uni Research Climate, Bjerknes Centre for Climate Studies, University of Bergen, Bergen, Norway
4General studies Department, Dar es Salaam Institute of Technology, Dar es Salaam, Tanzania
5Department of Geography, Geoinformatics and Climate Sciences, Makerere University, Kampala, Uganda
6Modelling Section, Tanzania Meteorological Agency, Dar es Salaam, Tanzania

Copyright © 2018 by authors and Scientific Research Publishing Inc.
This work is licensed under the Creative Commons Attribution International License (CC BY 4.0).
http://creativecommons.org/licenses/by/4.0/


Received: October 16, 2017; Accepted: January 14, 2018; Published: January 17, 2018
ABSTRACT
This paper evaluates the skills of physical Parameterization schemes in simulating extreme rainfall events over Dar es Salaam Region, Tanzania using the Weather Research and Forecasting (WRF) model. The model skill is determined during the 21 December 2011 flooding event. Ten sensitivity experiments have been conducted using Cumulus, Convective and Planetary boundary layer schemes to find the best combination and optimize the WRF model for the study area for heavy rainfall events. Model simulation results were verified against observed data using standard statistical tests. The model simulations show encouraging and better statistical results with the combination of Kain-Fritsch cumulus parameterization scheme, Lin microphysics scheme and Asymmetric Convection Model 2 (ACM2) planetary boundary scheme than any other combinations of physical parameterization schemes over Dar es Salaam region.
Keywords:
WRF, Dar es Salaam, Extreme Rainfall Events, Physical Parameterization Schemes

1. Introduction
Extreme rainfall events are among the devastating weather phenomena since they are frequently followed by flash floods, landslide and sometimes accompanied by severe weather such as lightning, hail, strong surface winds and intense vertical wind shear [1] [2] . Tanzania has been impacted by extreme climatic conditions such as floods and droughts [3] [4] . These events have caused losses of life, property and destruction of environment [5] . Examples of the loss caused by floods in the region are the damage both to life and property experienced throughout the country during the 1997/1998 El-Nino associated with floods, and the 2011 floods that wrecked the coastal city of Dar es Salaam. Prediction of extreme rainfall events in Tanzania can therefore be of considerable economic value to various sectors such as agriculture, water resources, tourism, hydropower, industry and the community at large.
Extreme rainfall events that often occur in Dar es Salaam coastal city are influenced by variations of climate due to its physical topography, monsoon winds and ocean influences (Indian ocean) [6] [7] . About 8% of its land lies below 10 m above mean sea level and considering the low-lying nature of the coastal areas in the city, climate change and sea-level rise present additional flood major weather-related threats to the population, infrastructure and other scio-economic development in the coastal zone [8] [9] . The main objective of Numerical weather prediction is to describe better the behavior of the atmospheric physical processes that affect weather events and use them in the model to estimate the state of the atmosphere at some time in the future [10] [11] . These physical processes are called parameterization schemes.
There are five types of parameterization schemes used in numerical weather prediction models which are; radiation, land surface model, microphysics (MP), cumulus (CP) and Planetary Boundary Layer (PBL) [12] . These schemes play a dominant role in the initiation and development of weather systems such as convective rainfall events and storms, land-sea breezes, thermal boundaries and mountain valley circulations ( [13] [14] ). The skill of these parameterization schemes vary with specific events and regime. Thus, this study aims at determining the best CPSs, MPs and PBL parameterization schemes and their combination in simulating the extreme rainfall events over Dar es Salaam.
In Tanzania, the complex topographical landscape, numerous large inland water bodies, variation in vegetation types and land-ocean contrast present additional difficult to forecast heavy rainfall [6] [7] . Therefore, investigations are required to understand the physical properties of small scale meteorological processes which have a great influence on the precipitation simulated and also play an important role in determining the vertical structure of temperature and moisture fields of the atmosphere [15] .
The parameterization of smaller scale phenomena is a challenge in numerical modeling of weather and climate [16] . In the WRF model, users have the flexibility to select from different physical parameterization schemes [17] [18] such as land surface, boundary layer, convection, cloud microphysics, radiation schemes. However, this choice depend on the location of interest, type of application, spatial and temporal resolutions or the type of the prevailing weather phenomena of the region [18] . Selecting the right combination of the physical schemes, especially cumulus and microphysics schemes is essential for better performance of the model’s rainfall prediction which eventually improves the forecast skill of the model [19] .
In Tanzania, some studies have been conducted using WRF model such as Luhunga et al. [7] ; Kondowe et al. [20] and Mlonganile et al. [21] . Kondowe et al. considered six different cumulus schemes to study their impacts on quantitative rainfall forecast over Tanzania using WRF model; Mlonganile et al. considered WRF 4-dimensional Variational data assimilation with two cumulus scheme to simulate extreme rainfall event over Dar es Salaam. However, limited research on assessing the skills of existing cumulus, microphysical and planetary boundary layer schemes of the model has been carried out to accurately forecast an extreme rainfall event such as that of 21st December 2011 which resulted to significant flooding within Dar es Salaam coastal region.
This study investigated the most suitable combination of physical parameterization scheme of WRF model to simulate the Dar es Salaam extreme rainfall event of 21st December 2011 using high resolution model. The specific scientific questions addressed in this study are:
1) How extreme rainfall forecasting is sensitive to the physical parameterization schemes?
2) Which combination of physical parameterization schemes accurately simulated the extreme rainfall event?
Description of the domain as used in the study, experiment design, WRF model set-up and the physics parameterizations used is presented in Section 2 and the results in Section 3.
2. Materials and Methods
2.1. Study Region
The study was carried over Tanzania with Dar es Salaam as the case study (Figure 1). Dar es Salaam is located in the Eastern part of Tanzania mainland between latitude 6.36˚ and 7˚ South and longitudes 36˚ to 39˚ East and to her East is the Indian Ocean. Three domains (Figure 3) for the study with the first domain at horizontal resolution of 27 km to mesoscale processes which are downscaled using the second domain at a horizontal resolution of 9 km. The third domain contains Dar es Salaam at a horizontal resolution of 3 km and is suitable to understand physical processes over the coastal region of Tanzania especially the extreme rainfall that occurred on 21st December 2011 over Dar es Salaam.
2.2. The Extreme Rainfall Event of 21 December 2011
On 21st December 2011 extreme rainfall event occurred in Dar es Salaam (Figure 2), Tanzania and caused flooding of coastal areas. The flooding event caused

Figure 1. The map shows some key weather stations in Tanzania. Dar es Salaam is the main study area.

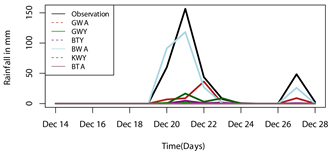
Figure 2. The bar chart showing total rainfall observed over Tanzania stations on 21st Dec. 2011.
significant negative impacts to the country’s economy. About 43 people were reported dead; hundreds of people made homeless; caused severe destruction of infrastructure e.g. houses, roads and bridges. The 3-day (i.e. 20th-22nd December 2011) accumulated rainfall was recorded as 260:2 mm at Julius Nyerere International Airport (JNIA) Station and the heaviest rainfall in 24hrs observed on 21st December 2011 was 156:4 mm which was well above 117:8 mm December monthly mean (TMA, 2011) as shown in Figure 1. According to the Tanzania Meteorological Agency (TMA) this amount of rainfall was record breaking in the 58 years since the establishment of the station in 1953.
2.3. Data
The daily observed rainfall data for the period 14 - 28th December 2011 for Dar es Salaam was obtained from Tanzania Meteorological Agency (TMA) along with rainfall data for other 14 stations (Figure 1) for spatial analysis. The initial and lateral boundary conditions to run the model were obtained from the National Centers for Environmental Prediction at a horizontal resolution of 1˚ × 1˚ degree [22] and it is updated every six hours.
2.4. The WRF Model
The study used the Advanced Research core of WRF model (WRFV3.7). The model is developed by the National Center for Atmospheric Research (NCAR), USA. WRF has both options of fully compressible non-hydrostatic and the hydrostatic option, primitive equation model and also multiple nesting options to increase resolution over the simulation area [23] [24] . The WRF model also has advanced dynamics, physics, and numeric schemes [25] and uses terrain-following hydrostatic pressure coordinate system with permitted vertical stretching. It uses the Arakawa C grid staggering for horizontal discretization.
The WRF model governing equations for water species as described in [23] is expressed as:
(1)
(2)
(3)
In the Equations (1)-(3) the 3D advection terms are defined as [23] ;
The sedimentation term is defined as:
where , and are the mixing rations of water species; v-water vapor; c- cloud water; r-rain water; i-cloud ice; s-snow; g-graupel; h-hail, is the surface moisture flux, is the air density, V is the 3-D wind vector, is the mass weighted terminal particle fall speed, , and are the source and sink terms.
2.5. Experiment Design
The study was conducted using the WRF model version 3.7.1 and used three domains (Figure 3). The simulation was from 14-28th December 2011 in order to ensure sufficient spin-up and model stability (i.e. prior 7 days and 7 days after the event) [25] . The tested performance of several combinations of physical parameterization schemes forming 10 experiments (Table 1). The parameterization schemes used included cumulus schemes (the Kain-Fritsch scheme [26] ; the Grell-Freitas scheme [27] and the Betts-Miller Janjic scheme [28] ); the microphysical schemes (the Lin scheme [29] ; the WRF Single-Moment 6-class scheme [30] and the New Thompson scheme [31] ) and the planetary boundary layer schemes (the Yonsei University scheme [32] ; the Mellor-Yamada-Janji’c scheme and the Asymmetric Convection Model II scheme [33] ) and the Noah Land Surface model as well as the rapid radiative transfer model (RRTM) [34] . The combinations of

Figure 3. The figure shows the model domain used. The first domain has a horizontal resolution of 27 km, the second 9 km and the third domain at 3 km.

Table 1. Sensitivity experiments using different combinations of physical parameterizations: CU is the cumulus scheme; MP is the microphysical scheme and PBL is the planetary boundary layer scheme.
parameterization schemes used in the study have been suggested by Mayor & Mesquita [12] ; Gilliland & Rowe [35] and Hasan et al. [15] and we used the Mercator map projection for projecting the nested domain (Figure 3) with the parent domain extending from 50 to 390. The model top was set at 50 hPa with 35 vertical layers.
2.5.1. Description of Selected Cumulus Schemes, Cu
• The Kain-Fritsch (KF) scheme is a one of the mass flux schemes that uses downdraft and CAPE (Convective Available Potential Energy) removal time scale and it includes cloud, rain, ice, and snow detrainment and cloud persistence over convective time scale. The scheme can account for the small-scale processes that lead to the development of convection [26] .
• The Betts-Miller-Janji’c (BMJ) is an adjustment type scheme that has deep and shallow profiles. It has no explicit updraft or downdraft and no cloud detrimental [28] .
• The Grell-Freitas (GF) scheme is a modification of the Grell-Devenyi [27] ensemble scheme and is a multiclosure, multiparameter ensemble method with typically 144 sub-grid members that tries to smooth the transition to cloud resolving scales. It has explicit updrafts and downdrafts and includes cloud and ice detrimental.
2.5.2. Description of Selected Microphysical Schemes, Mp
• The Lin et al. [29] scheme (Lin) includes ice, snow, and graupel processes, suitable for real-time high resolution simulations.
• The WRF Single-Moment 6-class scheme (WSM6) includes ice, snow and graupel formation processes [30] .
• The New Thompson et al. scheme (Thompson) includes ice, snow, and graupel processes suitable for high-resolution simulations; it also adds rain number concentration apart from the ice number calculations done in the model [36] .
2.5.3. Description of selected Planetary Boundary Layer Schemes, Pb
• Yonsei University (YSU): it is a first-order non-local scheme, with a counter gradient term in the eddy-diffusion equation that parameterizes the distribution of heat, moisture, and momentum in the part of the atmosphere directly influenced by the earth’s surface [32] .
• Mellor-Yamada-Janji’c: is a second-order, single point locally-closed scheme at which diffusion rates per layer are determined by the wind, moisture, and temperature conditions at a particular layer’s top and bottom interface [28] .
• Asymmetric Convection Model 2 (ACM2): explicitly treats the upward and downward transport of conserved atmospheric scalars with local eddy diffusion through a combination of both local and non-local closure methods [36] .
Every experiment will be called a combination of the Cumulus_Microphysics_ Planetary boundary layer options; for example K_L_A refers to the experiment that combined Kain-Frisch cumulus parameterization scheme, Lin et al. microphysics scheme with Asymmetric Convection model planetary boundary layer scheme. Our study includes all 10 possible combinations of the parameterizations (see Table 1).
Parameterization schemes are important because they strongly influence model forecasts and interact with each other indirectly through their changes to the model variables. A wet ground surface can lead to strong latent heat flux during the daytime and the development of a shallow and moist planetary boundary layer. Furthermore, at the top of the boundary layer cumulus clouds form and a few of these could eventually grow into rain.
The interactions between physical process parameterizations in WRF are presented in Figure 4.
2.6. Analysis Methods
The study mainly used parametric performance measures namely the root mean square error (RMSE), the mean absolute error (MAE) and bias (or mean error) as described by Mugume et al. [38] and the Pearson moment product correlation to analyze the association between observed and simulated rainfall. Yang et al. [39] defined the bias, MAE, RMSE and CORR in (Equations (4)-(6)) respectively as the degree of correspondence between the mean predicted (P) and mean observed rainfall (O). The smaller the magnitude of bias the better is the model performance. Negative values of bias indicates that the model is under predicting while positive values of bias indicate that the model is over-predicting.
(4)

Figure 4. Interactions between physical parameterizations in WRF model. Source: [37] .
is the ith data point and N is the total number of corresponding paired data points of predicted (P) and observed (O). The MAE is the arithmetic mean of the error magnitudes between the predicted and observed. It is given mathematically by Equation (5)
(5)
The RMSE is the square of arithmetic mean squared error between the predicted and observed and is the good overall measure of the model performance because of the weighing of predicted to its observed rainfall by its square which tends to inflate RMSE, especially when we have extreme values. For a perfect model, the RMSE must approach zero.
(6)
The Pearson’s correlation coefficient (CORR), is a measure of linear correlation between the observations (O) and simulation (prediction) (P)
(7)
3. Results and Discussions
3.1. Overview of Extreme Rainfall Event
The accumulated rainfall over Tanzania during the period 20th-22nd December 2011 is presented using Figure 5. The period 20th-22nd December 2011 was
 (a)
(a)
 (b)
(b)
Figure 5. (a) Shows the total rainfall amount observed over Tanzania on 21st Dec. 2011; and (b) Shows the total 3 day rainfall amount observed over Tanzania.
generally a wet period that lead to flooding over many parts of Tanzania especially Dar es Salaam. Julius Nyerere International Airport Station in Dar es Salaam recorded the highest rainfall amount on 21st December 2011 of 156.4 mm. The heavy rainfall event of 21st December 2011 that resulted into flooding event over Dar es Salaam was due to convergence of moist northeasterly winds from Indian Ocean and the southerlies which changed to westerly winds from south of Indian Ocean in Mozambique Channel near Dar es Salaam and led to instability. This instability enhanced westerly flow disturbance and lead to heavy rainfall. There was lee trough in vicinity of Madagascar which was a temporary synoptic feature in wettest day and seasonal trough in north of Indian Ocean which also influenced the convergence near Dar es Salaam further enhancing the heavy rainfall.
3.2. Performance of Parameterization Schemes
The performance of the selected parameterization schemes is presented using Figure 7 and Figure 8 and additional analysis illustrated using Figure 10. In Figure 7, results for KLA experiment show that by 0000UTC, the precipitation tendency of more than 50 mm covered the coast including Dar es Salaam which spread off coast to Indian Ocean by 0600UTC. By 1200UTC the rainfall had spread in-land north of Morogoro and by 1800UTC the nearly the entire eastern part of Tanzania had been covered by precipitation tendency of more than 50 mm.
The results for GTY experiment show that by 0000UTC precipitation tendency of more than 50 mm covered far in-land off the coast in areas of Iringa and Mahenge but for Dar es Salaam at the same time, 10 - 20 mm was simulated. By 0600UTC precipitation tendency of more than 50 mm had developed over coast and Mtwara region moving westwards and covering the southern part of Tanzania by 1200UTC. By 1800UTC, precipitation tendency had generally decreased over the study domain to about 5 - 20 mm. From the results presented by Figure 7 and Figure 8, we observed that using KLA combination, WRF model reasonably simulated excess rainfall over Dar es Salaam when compared with observed rainfall over JNIA (Figure 5) and in agreement with satellite images (Figure 6). The TGY combination scheme failed to locate the extreme rainfall and considered this combination to have a wide spatial rainfall displacement illustrated by the spatial bias (Figure 8).
The performance of other combinations is presented using time-series Figure 9 and summarized using Table 2. These results are in line with the KLA experiment and show that it compared reasonably well with observed rainfall. The KLA experiment had the smallest RMSE: 12.53; MAE: 5.80 and highest correlation coefficient of 0.96.
Additional analysis of results presented in Table 2 showed that the maximum values of root mean square error, and mean bias with minimum correlation coefficient are for Thompson, ACM2 and BMJ combination, while the minimum values of root mean square error and mean bias with the highest correlation coefficient are for Lin, ACM2 and KF combination. This means the WRF model has high-performance on extreme rainfall prediction for Lin, ACM2 and KF combination.
The results from Table 2 has been supported by Figure 9(a) and Figure 9(b) which shows the inter-comparison of output data simulated using the combination of physical parameterization schemes as shown in Table 2 and those observed from rain gauge station. The inter-comparison graph with the combination Lin, ACM2 and KF (KLA) is very close to observation data. Thus the WRF model shows good performance on prediction of extreme rainfall events over Dar es Salaam for KLA combination.

Figure 6. Visible satellite image for 0900UTC on 21 December 2011, Source: http//www.eumetsat.int.
 (a)
(a)
 (b)
(b)
 (c)
(c)
 (d)
(d)
Figure 7. Accumulated rainfall (mm) during December 21, 2011 over Dar es Salaam with (KF, Lin and ACM2) schemes over Dar es Salaam valid for 21 December 20115 at 0018 UTC.
3.3. Analysis of Dar es Salaam Extreme Rainfall
Lateral boundary condition (LBC) ERA interim reanalysis data were used to ensure that WRF model is forced with meteorological data that accurately describe the synoptic situation for the Dar es Salaam study. [37] stated that fluxes of heat, moisture, and momentum should be well defined in the initialization and LBCs, so that the limited-area model can treat all meteorological processes within the
 (a)
(a)
 (b)
(b)
 (c)
(c)
 (d)
(d)
Figure 8. Accumulated rainfall (mm) during December 21, 2011 over Dar es Salaam with (TH, GF and YSU (TGY)) schemes over Dar es Salaam valid for 21 December 20115 at 0018 UTC.
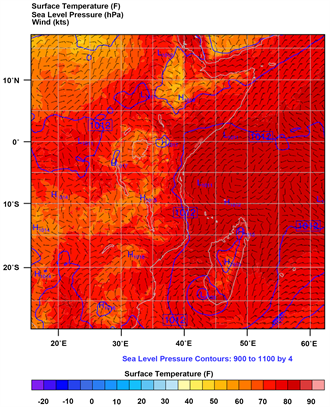
integration domain reasonably well. This also contributes to avoiding artificial dynamical feedbacks between grids that can cause instability in the model simulations [21] . The analysis of synoptic conditions for surface temperature, sea level pressure and wind field is presented using Figure 10. Results of Figures 10(a)-(d) generally showed that the Indian Ocean was comparatively warmer i.e. over 70˚F than the land masses over the study domain. A deep low developed over Madagascar whose effects spread towards Dar es Salaam coast bringing
 (a)
(a)  (b)
(b)
Figure 9. The inter-comparison of station observed and model simulated accumulated rainfall (mm) with different parameterization schemes (MPS, CPS and PBLSs) over Dar es Salaam valid for 21 December 2011 5 at 0000 UTC to 0018 UTC. (a) Parameterization combination using Lin microphyiscal scheme; (b) Parameterization combination using WRF6 microphyiscal scheme.
Table 2. Error index for extreme rainfall using different combinations of physical parameterizations.
heavy rainfall that led to flooding. The lateral boundary condition data (LBCs) used for the WRF simulation reasonably describe the synoptic condition depicted in our study. Consequently, the WRF model was able to reproduce well the deep low developed over the Madagscar Island where moisture and heat combined to produce extreme rainfall event over Dar es Salaam Region.
4. Conclusion
In this study, sensitivity experiments have been conducted with the WRF ARW model to evaluate the impact of parameterization schemes (cu, mp and pbl) on simulating heavy rainfall event that occurred over Dar es Salaam on 21 December 2011 and the model results have been validated with observations. A statistical analysis based on RMSE, MAE and CORR is performed for comparing the simulated and observed data with different parameterization schemes. In all experiments, the design was identical in terms of domain resolution, boundary data and simulation period. The WRF model was able to simulate the synoptic situation which invaded Dar es Salaam during December 21, 2011. The combination
 (a)
(a)
 (b)
(b)
 (c)
(c)
 (d)
(d)
Figure 10. The geopotential pressure, temperature and wind simulated (hPa, F, Knots) over Dar es Salaam valid for 21 December 20115 at 0000 UTC to 1800UTC.
of Lin, Kain-Fritsch and Asymmetric Convection Model 2 parameterization scheme performed better than other combinations. The model simulation of the synoptic situation was in agreement with the previous studies over Tanzania [17] who studied the Impacts of grid spacing and cumulus schemes on the quality of rainfall forecasts over Tanzania using different cumulus parameterization schemes and found KF scheme performs better than other schemes in simulating heavy rainfall events in Tanzania. A detailed study is however recommended for a longer period (e.g. a season) to generate a data-set that can have robust statistical tests. After analyzing the datasets, graphical comparison analysis it can be concluded that the WRF ARW model with Kain Frisch, Lin, ACM2 (KLA) parameterization schemes has well simulated the extreme rainfall event as compared to other convective combination parameterization schemes. The results of these analyses have demonstrated the capability of high resolution WRF ARW model in simulation of extreme events and found out the suitable parameterization schemes (MPS, CPS and PBLSs) for Dar es Salaam region.
Acknowledgements
The authors are grateful to the WIMEA-ICT project under NORHED for the support and to the reviewers for the constructive feedback. We are also grateful to TMA for the rainfall observational data used in the study.
Conflict of Interest
The authors declare that there is no conflict of interests regarding the publication of this paper.
Cite this paper
Ngailo, T.J., Shaban, N., Reuder, J., Mesquita, M.D.S., Rutalebwa, E., Mugume, I. and Sangalungembe, C. (2018) Assessing Weather Research and Forecasting (WRF) Model Parameterization Schemes Skill to Simulate Extreme Rainfall Events over Dar es Salaam on 21 December 2011. Journal of Geoscience and Environment Protection, 6, 36-54. https://doi.org/10.4236/gep.2018.61003
References
- 1. Southern Africa (2014) The 2013/2014 Southern Africa Flood Season. Humanitarian Bulletin, 15, 1-7.
- 2. Chu, L., McAleer, M. and Chang, C. (2013) Statistical Modelling of Extreme Rainfall Taiwan. Tinbergen Institute Discussion Papers, 15, 6536.
- 3. Tanzania: Floods (2007) International Federation of Red Cross and Red Crescent Societies, 0005.
- 4. Garcia-Aristizabal, A., Bucchignani, E., Palazzi, E., Onofrio, D., Gasparini, P. and Marzocchi, W. (2015) Analysis of Non-Stationary Climate-Related Extreme Events Considering Climate Change Scenarios: An Application for Multi-Hazard Assessment in the Dar es Salaam Region, Tanzania. Natural Hazards, 75, 289-320. https://doi.org/10.1007/s11069-014-1324-z
- 5. Kebede, S. and Nicholls, R.J. (2012) Exposure and Vulnerability to Climate Extremes: Population and Asset Exposure to Coastal Flooding in Dar es Salaam, Tanzania. Regional Environmental Change, 12, 81-94. https://doi.org/10.1007/s10113-011-0239-4
- 6. Kijazi, A. and Reason, C. (2009) Analysis of the 2006 Floods over Northern Tanzania. International Journal of Climatology, 29, 955-970. https://doi.org/10.1002/joc.1846
- 7. Luhunga, P. and Mutayoba, E. (2016) Moist Potential Vorticity Vector for Diagnosis of Heavy Rainfall Events in Tanzania. Journal of Geoscience and Environment Protection, 4, 128. https://doi.org/10.4236/gep.2016.49010
- 8. Casmiri, D. (2008) Vulnerability of Dar es Salaam City to Impacts of Climate Change. Environmental Protection Management System, Dar es Salaam.
- 9. Ngailo, T.J., Rutalebwa, E., Nyimvua, S., Reuder, J. and Mesquita, D.S. (2016) Modelling of Extreme Maximum Rainfall Using Extreme Value Theory for Tanzania. International Journal of Scientific and Innovative Mathematical Research, 4, 34-35.
- 10. Warner, T. (2010) Numerical Weather and Climate Prediction. Cambridge University Press, Cambridge. https://doi.org/10.1017/CBO9780511763243
- 11. Dasari, H.P., Salgado, R., Perdigao, J. and Challa, V.S. (2014) A Regional Climate Simulation Study Using WRF-ARW Model over Europe and Evaluation for Extreme Temperature Weather Events. International Journal of Atmospheric Sciences, 22, Article ID: 704079. https://doi.org/10.1155/2014/704079
- 12. Mayor, G. and Mesquita, D.S. (2015) Numerical Simulations of the 1 May 2012 Deep Convection Event over Cuba: Sensitivity to Cumulus and Microphysical Schemes in a High-Resolution Model. Advances in Meteorology, 2015, Article ID: 973151. https://doi.org/10.1155/2015/973151
- 13. Das, M., Chowdhury, M. and Das, S. (2015) Sensitivity Study with Physical Parameterization Schemes for Simulation of Mesoscale Convective Systems Associated with Squall Events. International Journal of Atmospheric Sciences, 2, 20-36.
- 14. Shrestha, D.L., Robertson, D.E., Wang, Q.J., Pagano, T.C. and Hapuarachchi, H.A.P. (2013) Evaluation of Numerical Weather Prediction Model Precipitation Forecasts for Short-Term Streamflow Forecasting Purpose. Hydrology and Earth System Sciences, 17, 1913-1931. https://doi.org/10.5194/hess-17-1913-2013
- 15. Hasan, M. (2014) Improvement of Forecasting Heavy Rainfall Events Using Weather Research and Forecasting (WRF) Model. Master Dissertation, Bangladesh University of Engineering and Technology, Dhaka.
- 16. Shrivastava, R., Dash, S.K., Oza, R.B. and Sharma, D.N. (2014) Evaluation of Parameterization Schemes in the wrf Model for Estimation of Mixing Height. International Journal of Atmospheric Sciences, 2014, Article ID: 451578.
- 17. Soni, M., Payra, S., Sinha, P. and Verma, S. (2014) A Performance Evaluation of wrf Model using Different Physical Parameterization Scheme during Winter Season over a Semi-Arid Region, India. International Journal of Earth and Atmospheric Science, 1, 104-114.
- 18. Mohan, M. and Bhati, S. (2011) Analysis of wrf Model Performance over Subtropical Region of Delhi, India. Advances in Meteorology, 2011, Article ID: 621235. https://doi.org/10.1155/2011/621235
- 19. Dudhi, J. (2004) WRF Modeling System Overview. 33.
- 20. Kondowe, A. (2014) Impact of Convective Parameterization Schemes on the Quality of Rainfall Forecast over Tanzania Using WRF-Model. 691-699.
- 21. Mlonganile, P. (2012) Improving Weather Forecast over East Africa through wrf-4dvar Data Assimilation Technique.
- 22. Kalnay, E., Kanamitsu, M., Kistler, R., Collins, W., Deaven, D., Gandin, L., Iredell, M., Saha, S., White, G., Woollen, J., et al. (1996) The ncep/ncar 40-Year Reanalysis Project. Bulletin of the American Meteorological Society, 77, 437-471. https://doi.org/10.1175/1520-0477(1996)077<0437:TNYRP>2.0.CO;2
- 23. Didier, N., Bob, A.O. and Ongoma, V. (2016) The Impacts of Topography on Spatial and Temporal Rainfall Distribution over Rwanda Based on wrf Model. Atmospheric and Climate Sciences, 6, 145-157. https://doi.org/10.4236/acs.2016.62013
- 24. Kumar, T.S. and Krishnamurti, T.N. (2006) High Resolution Numerical Weather Prediction over the Indian Subcontinent. Journal of Earth System Science, 115, 529-555.
- 25. Skamarock, W.C., Klemp, J.B., Dudhi, J., Gill, D.O., Barker, D.M., Duda, M.G., Huang, X.-Y., Wang, W. and Powers, J.G. (2008) A Description of the Advanced Research WRF Version 3. Technical Report, 113.
- 26. Kain, J.S. (2004) The kain-fritsch Convective Parameterization: An Update. Journal of Applied Meteorology, 43, 170-181. https://doi.org/10.1175/1520-0450(2004)043<0170:TKCPAU>2.0.CO;2
- 27. Grell, G.A. and Freitas, R.S. (2013) A Scale and Aerosol Aware Stochastic Convective Parameterization for Weather and Air Quality Modeling. Atmospheric Chemistry and Physics, 13, 23845-23893. https://doi.org/10.5194/acpd-13-23845-2013
- 28. Janjic, Z.I. (1994) The Step-Mountain Eta Coordinate Model: Further Developments of the Convection, Viscous Sublayer, and Turbulence Closure Schemes. Monthly Weather Review, 122, 927-945. https://doi.org/10.1175/1520-0493(1994)122<0927:TSMECM>2.0.CO;2
- 29. Lin, Y., Farley, R. and Orville, D. (1983) Bulk Parameterization of the Snow Field in a Cloud Model. Journal of Climate and Applied Meteorology, 22, 1065-1092. https://doi.org/10.1175/1520-0450(1983)022<1065:BPOTSF>2.0.CO;2
- 30. Hong, S.Y. and Lim, J.O. (2006) The wrf Single-Moment 6-Class Microphysics Scheme (wsm6). Journal of the Korean Meteorological Society, 42, 129-151.
- 31. Thompson, G., Field, P., Rasmussen, R. and Hall, W. (2008) Explicit Forecasts of Winter Precipitation using an Improved Bulk Microphysics Scheme. Part II: Implementation of a New Snow Parameterization. Monthly Weather Review, 136, 5095-5115. https://doi.org/10.1175/2008MWR2387.1
- 32. Hong, S.Y., Noh, Y. and Dudhia, J. (2006) A New Vertical Diffusion Package with an Explicit Treatment of Entrainment Processes. Monthly Weather Review, 134, 2318-2341. https://doi.org/10.1175/MWR3199.1
- 33. Pleim, J.E. and Chang, J.S. (1992) A Non-Local Closure Model for Vertical Mixing in the Convective Boundary Layer. Atmospheric Environment, Part A, General Topics, 26, 965-981. https://doi.org/10.1016/0960-1686(92)90028-J
- 34. Stensrud, D. (2009) Parameterization Schemes: Keys to Understanding Numerical Weather Prediction Models. Cambridge University Press, Cambridge.
- 35. Gilliland, E.K. and Rowe, C.M. (2004) A Comparison of Cumulus Parameterization Schemes in the WRF Model. (In Arakawa)
- 36. Pleim, J.E. (2007) A Combined Local and Nonlocal Closure Model for the Atmospheric Boundary Layer. Part I: Model Description and Testing. Journal of Applied Meteorology and Climatology, 46, 1383-1395. https://doi.org/10.1175/JAM2539.1
- 37. Zittis, G., Hadjinicolaou, P., Lelieveld, et al. (2014) Comparison of WRF Model Physics Parameterizations over the MENA-Cordex Domain. American Journal of Climate Change, 3, 490-511. https://doi.org/10.4236/ajcc.2014.35042
- 38. Mugume, I., Mesquita, D.S., Basalirwa, C., Bamutaze, Y., Reuder, J., Nimusiima, A., Waiswa, D., Mujuni, G., Tao, S. and Ngailo, T. (2016) Patterns of Dekadal Rainfall Variation over a Selected Region in Lake Victoria Basin, Uganda. Atmosphere, 7, 150. https://doi.org/10.3390/atmos7110150
- 39. Yang, J., Duan, K., Wu, J., Qin, X., Shi, P., Liu, H., Xie, X., Zhang, X. and Sun, J. (2015) Effect of Data Assimlation using wrf-3dvar for Heavy Rain Prediction on the Northeastern Edge of the Tibetan Plateau. Advances in Meteorology, 2015, Article ID: 294589.