American Journal of Industrial and Business Management
Vol. 2 No. 1 (2012) , Article ID: 17112 , 3 pages DOI:10.4236/ajibm.2012.21003
An Analysis on the Relative Efficiency of the Infrastructure Investment in the Liaoning Coastal Economic Belt Based on DEA Method
![]()
1School of Management, Shenyang Jianzhu University, Shenyang; 2Institute of Economics, Liaoing University, Shenyang
Email: xyhlrb@sohu.com
Received November 3rd, 2011; revised December 19th, 2011; accepted December 31st, 2011
Keywords: The Liaoning Coastal Economic Belt; DEA Method; Infrastructure Investment; Relative Efficiency
ABSTRACT
The infrastructure construction is playing an important role in the development of Liaoning Coastal Economic Belt, whereas a calculation and analysis on the relative efficiency of its 6 cities’ infrastructure investment will offer a useful reference to the decision on the future investment scale and structure of this area’s infrastructure. Based on DEA model and from the viewpoint of constant scale return and changing scale return, this paper calculates the comprehensive relative efficiency and scale relative efficiency of the infrastructure investment in Liaoning Coastal Economic Belt in 2000-2009, and draws the following conclusion: Infrastructure investments in Dalian, Jinzhou and Panjin are comprehensively relative efficient, while infrastructure investments in Dandong,Yingkou and Huhudao are comprehensively relative inefficient. Infrastructure investments in Yingkou and Huludao are technically efficient, but inefficient in the sense of scale, and are taking increasing scale returns, while the infrastructure investment in Dandon is inefficient from both the technology and scale senses, and is showing a decreasing scale return.
1. Introduction
The term of “infrastructure” was introduced to the field of economics in the 1940s, however, economists have much earlier realized the importance of public facilities such as the navigation, port, warehouse, and water conservancy project. With the rapid development of China’s economy and the increasing demand from urban and rural inhabitants for the quality of their livelihood and their surrounding environment, infrastructures role as the carrier of social and economical activities is paid more and more attention. Data Eivelopmeit Aialynin,DEA, raised by A. Charienis, W. W. Cooperan and E. Rhoden, is an effectiveness comprehensive assessment method with multi-index inputs and multi-index products, which is mainly used to assess the relative effectiveness of similar companies, therefore, it is also a method of appraising the relative efficiency of decision-making unit with multiinput and multi-product. Its basic idea is to spread the single-input and single-output engineering efficiency concept to the effectiveness assessment of decisionmaking unit with multi-input and multi-output, to apply the mathematics planning to assess the relative effectiveness of multi-input and multi-output “unit”. It decides whether the DMU is effective by the means of its observation data, essentially, it decides whether the DMU is located in the leading edge of production possible anthology. Based on DEA model and from the viewpoint of constant scale return and changing scale return, this paper aims to analyze the comprehensive relative efficiency and scale relative efficiency of the infrastructure investment in the Liaoning Coastal Economic Belt in 2000-2009.
2. Evaluation Model
2.1. C2R Model (Constant Scale Return)
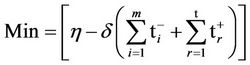
The C2R model which is used to evaluate the comprehensive relative efficiency of Liaoning Coastal Economic Belt is as the following:
 (1)
(1)
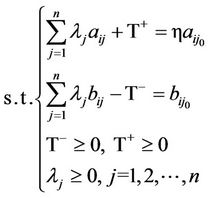
In the above formula, letter n indicates the quantity of DUM of the same kind; m and t respectively indicate the quantity of input index and output index;  and
and  indicate the ith input and the rth output of the j0th DUM; t – i and t + r are Slack variable; δ is normally 10-5; η indicates the comprehensive efficiency of the infrastructure investment in Liaoing Coastal Economic Belt.
2.2. BC2 Model (Changing Scale Return)
The template is used to format your paper and style the text. All margins, column widths, line spaces, and text fonts are prescribed; please do not alter them. You may note peculiarities. For example, the head margin in this template measures proportionately more than is customary. This measurement and others are deliberate, using specifications that anticipate your paper as one part of the entire proceedings, and not as an independent document. Please do not revise any of the current designations.
 (2)
(2)

At the beginning, we determine the comprehensive relative efficiency of each DUM by the application of C2R model. If a DUM is DEA efficient, in other words, both scale efficient and technically efficient, it supposes that the infrastructure investment structure of this DUM is sensible and that its capital efficiency is relative high; If a DUM is DEA inefficient, we should take one step ahead to determine whether it is technically efficient or not.
3. Samples Choosing and Data Processing
This paper regards the six cities of the Liaoning Coastal Economic Belt as the DUMs, including Dalian, Dandong, Jinzhou, Yingkou, Panjin and Huludao. All of adopted samples are selected from or calculate based on the official statistical data of this region in 2000-2009, which includes the input data the capital inventory of fixedasset and employee number, and output data-GDP.
All the adopted data are from the “Liaoning Statistical Yearbook” (2000-2009). In this paper, the total social fixed-asset investments in each city in 2000 and 2001 are derived from the ratio of each city’s total social fixedasset investment to the Liaoning Coastal Economy Belt total social fixed-asset investment multiplying the same year Liaoning Coastal Economic Belt total social fixedasset investment respectively; The quantities of employment of each city in 2000 and 2001 are derived from the average increasing speed of the quantities of employment in each city in 2002-2009.
The infrastructure fixed-asset inventory of each city in each year is calculated by the means of perpetual inventtory method. To eliminate the influence of the inflation, the infrastructure fixed-asset investment of each city in each year is converted by the fixed-asset investment price index into constant data; GDP data are converted by the means of GDP conversion index, regarding the year of 2000 as base period.
4. Calculation of the Relative Efficiency of Infrastructure Investment in Liaoning Coastal Economic Belt
4.1. The Comprehensive Efficiency Calculated Based on C2R Model
Table 1 reveals that in 2000-2009 the comprehensive efficiency values of infrastructure investment in Dalian, Jinzhou and Panjin are 1, which means DEA efficiency generally, including scale efficiency and technology efficiency. The comprehensive efficiency values of infrastructure investment in Dandong, Yingkou and Huludao are all lower than 1, which means DEA inefficiency generally. Briefly, infrastructure investments in Dalian, Jinzhou and Panjin are relatively efficient, while those in Dandong, Yingkou and Huludao are relatively inefficient.
4.2. The Scale Efficiency Calculated Based on BC2 Model
In spite of the DEA comprehensive inefficiency in Yingkou and Huludao, Table 2 indicates that the technology efficiency values in these two cities are all 1, which means
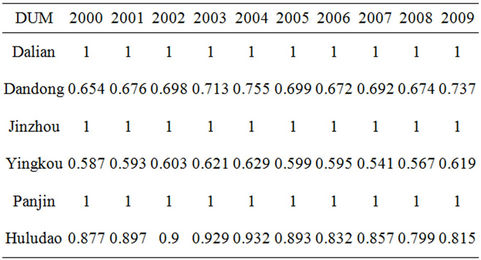
Table 1. Comprehensive efficiency of infrastructure investment in Liaoning Coastal Economic Belt in 2000-2009.
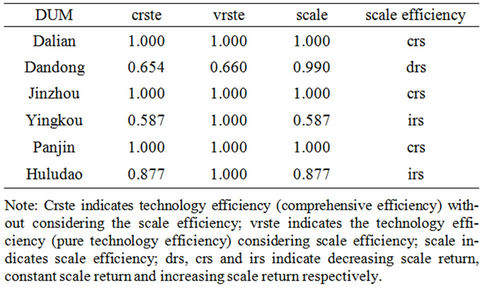
Table 2. Scale efficiency of infrastructure investment in Liaoning Coastal Economic Belt.
the infrastructure investment here are technologically efficient, but inefficient in the term of scale, since the scale efficiency values being 0.587and 0.877 respectively. On the same time, the infrastructure investment in Dandong is not only DEA comprehensive inefficient, but also technically inefficient and scale inefficient, since the technology efficiency value and scale efficiency value being 0.66 and 0.99 respectively. Among these three cities of Dandong, Yingkou and Huludao being inefficient in the term of scale, Dandong is taking on an decreasing scale return, possibly because the supporting facilities have not been set up here yet; Yingkou and Huludao are showing increasing scale return, possibly because scale effects have not been brought into full play in these two cities, and it is advisable to raise the infrastructure investment volume, innovate the financing model, and improve the investment system aw well as project management.
5. Conclusions
Generally, the comprehensive efficiencies of the infrastructure investments in Dalian, Jinzhou and Panjin are relatively high, while those in Dandong, Yingkou and Huludao are relatively low. Despite their comprehensive inefficiency, the infrastructure investments in Yingkou and Huludao are technically efficient, with an increasing scale return. In these two cities, it is advisable to increase the infrastructure investment efficiency and hence give an impetus to the economy development by the means of innovating the funding model, perfecting investment institution and project management as well as increasing the investment scale. The infrastructure investment in Dandong is neither technically efficient nor scale efficient, with a decreasing scale return, which means that the single-handed improvement of infrastructure investment level will not necessarily so bring a better efficiency in this city, and it is advisable to strengthen supporting facilities and realize the balanced development of its various economy sectors.
Through the foregoing calculation, it is discovered that the comprehensive relative efficiency values of infrastructure investment in Dalian, Jinzhou and Panjin are all 1, however, this result is not proving that the infrastructure investments in these three cities are at their best, and is just indicating that compared to other DUMs, these three cities’ infrastructure investments are relatively optimistic.
REFERENCES
- Department of Planning, Financing and Foreign Affairs Ministry of Housing and Urban-Rural Development, P.R. China, China Urban-Rural Construction Statistical Yearbook, 2008.
- Y. H. Xiang, “A Design for Derivative Model of Rural Infrastructure BOT,” Engineering and Business Management, Vol. 3, 2010, pp. 205-208.
- Y. H. Xiang and T. Wen, “A Comparative Study between the Investment in China’s Urban and Rural Public Infrastructure,” ISAEBD, 2011, pp. 142-148.
- Y. H. Xiang and T. Wen, “An Empirical Study on the Effect of the Investment in Rural Infrastructure,” Journal of Shenyang Jianzhu University, 2011.