International Journal of Clinical Medicine
Vol.3 No.7A(2012), Article ID:26338,5 pages DOI:10.4236/ijcm.2012.37A128
Prediction of Pretest Probability Scoring Systems in Pulmonary Embolism: Wells, Kline and Geneva*
![]()
1Emergency Department, Ankara Numune Training and Research Hospital, Ankara, Turkey; 2Emergency Department, Buca Medical Center, Buca, Turkey; 3Department of Emergency, Faculty of Medicine, Mersin University, Mersin, Turkey; 4Yenimahalle State Hospital, Ankara, Turkey.
Email: #mdengindeniz@yahoo.com, suveyda28@yahoo.com, cemkavalci@yahoo.com, eyranbozkurt@yahoo.com,
setam49@hotmail.com, evvahka@gmail.com, gkavalci@yahoo.com
Received September 26th, 2012; revised November 15th, 2012; accepted November 27th, 2012
Keywords: Pulmonary Embolism; Wells; Geneva, Kline; Emergency Department
ABSTRACT
Pulmonary embolism (PE) is a clinical entity with high mortality rate and therefore rapid diagnosis is necessary. For this purpose many diagnostic strategies have been developed for avoiding or necessitating further investigations. The hallmark of these strategies is assessing the pretest clinic probability of PE. In this study, the effectiveness of Wells, Geneva and Kline methods were investigated in a university hospital emergency department. 74 patients were enrolled in this study. The inter-group differences in scoring systems were significant for Wells and Kline but non-significant for Geneva method. The diagnosis of PE was correlated with Wells and Kline system but Geneva system lacked it. The receiver operating characteristic analyses was performed for comparing the pretest clinical probability scoring systems and the greatest area under the curve was found in Wells system. Wells method seems more useful compared to Geneva and Kline methods particularly in emergency department.
1. Introduction
Pulmonary embolism (PE) is one of the forms of venous thromboembolic diseases that have the highest mortality. It is characterized by occlusion of the pulmonary arterial system at various degree and different localization and usually results from embolization of thrombi originating from the deep calf veins. It has been reported that approximately 10% of newly diagnosed cases die within the first hour and the overall mortality is 2% - 10% with treatment [1], whereas the mortality rate rises up to 26% in untreated PE patients and also has the same recurrence rates [2]. Also, 36% of patients presenting to emergency department with pulseless electrical activity, had PE [3].
Clinical findings of PE are nonspecific and non-diagnostic. The gold standard in diagnosis is pulmonary angiography, although computerized tomography pulmonary angiography (CTPA) or ventilation/perfusion scintigraphy is more readily used. However, pretest probability of the disease is evaluated with various algorithms. For this purpose, many algorithms have been developed. Wells [4] and Geneva [5] scoring systems, by assigning points for various clinical variables, classify patients as low, moderate, or high probability. In general, a low probability together with a low d-dimer level excludes the disease, avoiding further examinations, while other probabilities are assessed by means of further imaging techniques [6,7]. Apart from these two, a scoring system developed by Kline et al. examines whether it is safe to exclude the disease in patients with a low d-dimer test [8]. We aimed to compare the three clinical probability levels with each other.
2. Materials and Method
2.1. Study Population and Data Collection
After obtaining approval of ethical committee, patients assessed for pulmonary embolism at the emergency department of a university hospital for a 6-month period were included. Demographic data, symptoms, vital signs, laboratory data, chest X-ray and CTPA findings, and results of other radiologic and scintigraphic examinations where available were recorded to detailed data sheets.
2.2. PE Diagnosis
A diagnostic algorithm was applied in patients with suspected diagnosis of PE. In algorithm all 3 scoring systems were employed. Patients with moderate or high probability in Wells or Geneva scoring systems or unsafe for Kline system were considered for further investtigation. In contrast, patients with low probability in Wells and Geneva scoring systems and safe for Kline system were evaluated with d-dimer levels. Subjects with “low probability” and “safe” and had low d-dimer levels were not considered for further examination whereas subjects who had high d-dimer levels were considered for further examination (Figure 1).
Cases were divided into PE (+) and PE (−) groups according to criteria given below:
Patients with a low d-dimer with a “low clinical probability” and “safe”, a non-diagnostic CTPA and an alternative diagnosis, a non-diagnostic CTPA or “normal” ventilation-perfusion scintigraphy and no sign of DVT in lower extremity venous doppler ultrasound (DUS) examination were followed for 3 months and those who did not develop venous thromboembolic events were considered PE-negative.
Those with a CTPA diagnostic for PE, a high probability scintigraphy result, DVT signs in lower extremity venous doppler ultrasonography, and with objectively demonstrated venous thromboembolic events in 3-month follow-up were diagnosed with PE.
To standardize PE diagnosis, CTPA examinations were assessed and DUS were performed by a radiologist and approved.
2.3. Statistical Analysis
Study data were analyzed with SPSS 18.00 software package. Demographic and clinic variables were expressed as frequency, mean ± standard deviation, and percent. Comparison of categorical variables was performed using “Receiver Operating Characteristic (ROC)” curves.
3. Results
A total of 74 patients were enrolled. The subjects were 19 - 95 years old. The mean age was 66.37 ± 16.70. Half of the patients were female. Thirty-one (42%) subjects were diagnosed with PE. Table 1 summarizes the criteria to rule in or out PE. Assessment of presenting symptoms of 74 patients revealed that those with PE and those without had similar symptoms. Those with PE had dyspnea and chest pain as the main symptoms. The proportions of patients and the frequencies of pulmonary embolism according to scoring systems were shown in Table 2. The inter-group differences in scoring systems were signifi-
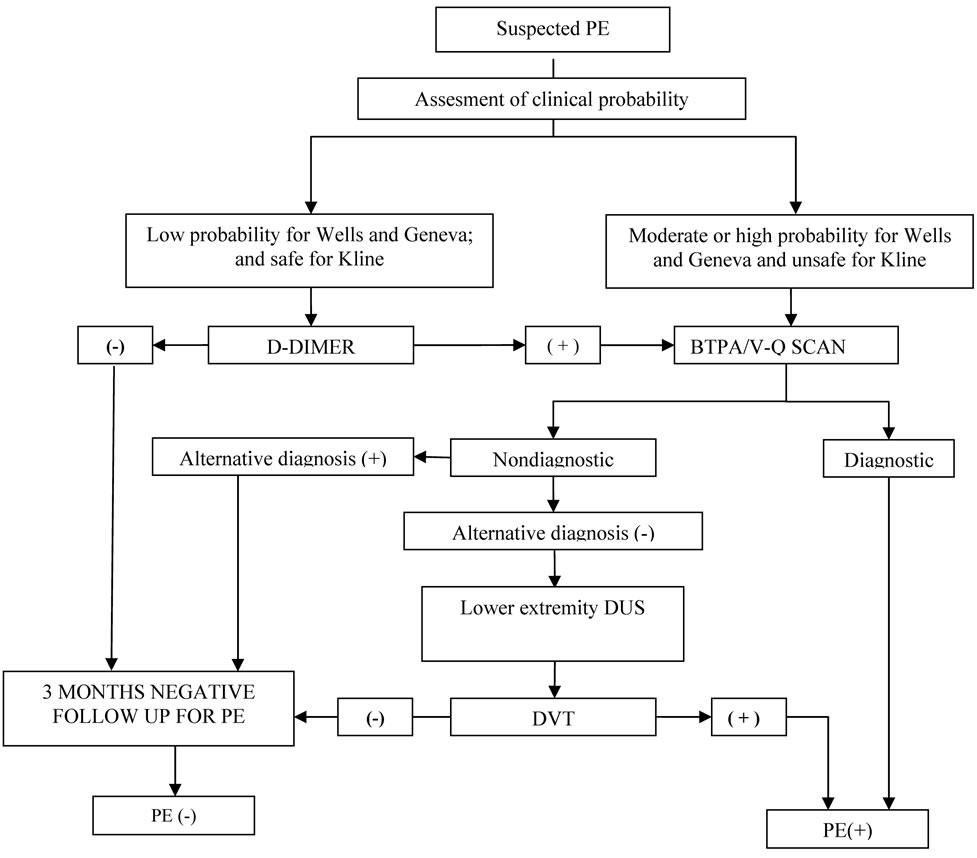
Figure 1. Diagnostic algorithm for PE.
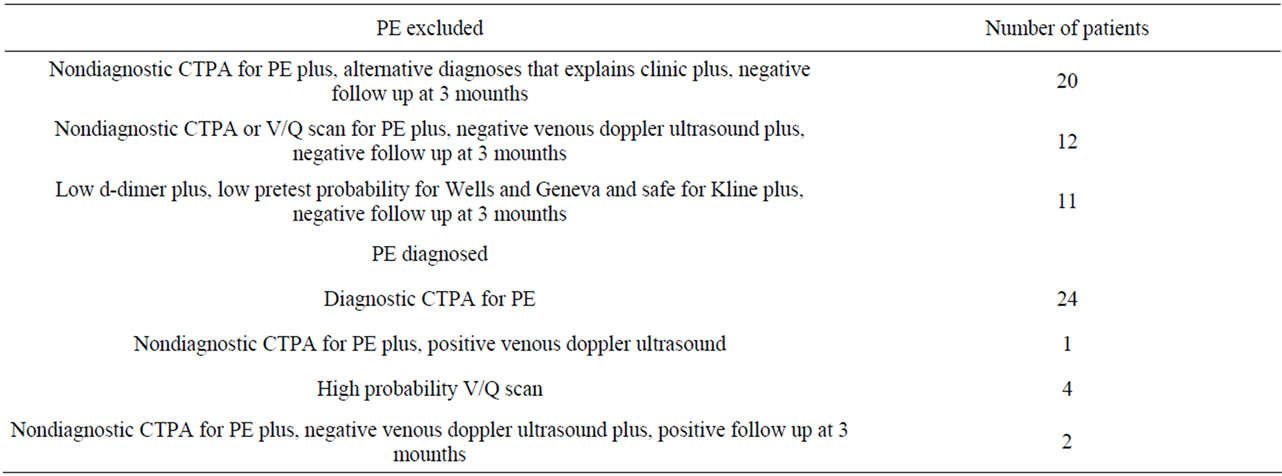
Table 1. Criterias used to diagnose or exclude PE.
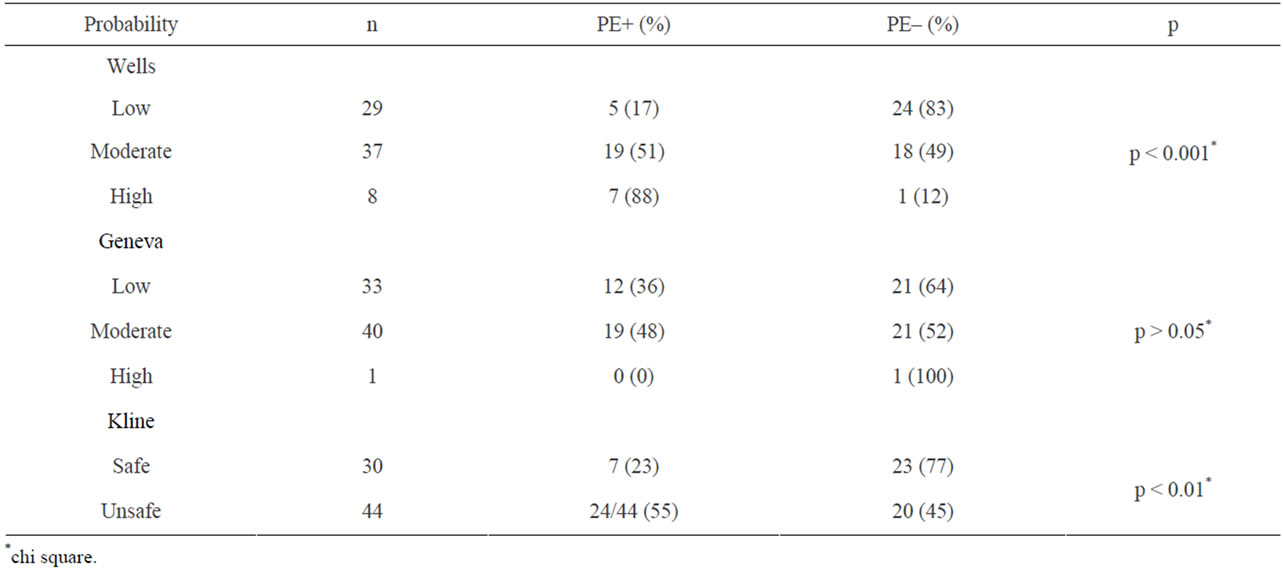
Table 2. Frequencies of pulmonary embolism according to scoring systems.
cant for Wells and Kline method, whereas non-signifi cant for Geneva method. There was a moderate but significant correlation between PE and Wells scoring system. This correlation was also present in Kline system, albeit to a lesser extent; however Geneva system lacked it. The correlation coefficients were 0.457 (p < 0.01), 0.311 (p > 0.05) and 0.074 (p > 0.05) for Wells, Kline and Geneva system respectively. Diagnostic values of Wells, Geneva, and Kline methods were compared using ROC curves (Figure 2). And the greatest area under curve was found in Wells scoring system. (AUC for Wells, Kline and Geneva were 0.75, 0.63 and 0.53, respectively).
4. Discussion
Diagnosis of PE is quite difficult owing to nonspecific clinical symptoms and laboratory data. Delays in diagnosis and treatment are known to increase morbidity and mortality. The main objective of diagnostic methods is to exclude the diagnosis. Sometimes, invasive, costly, and modalities that are difficult-to-reach should be performed. Thus, some pre-test scoring systems have been developed to determine if patients need further diagnostic work-up.
Wells et al. developed by assessing patients in terms of predisposing factors, symptoms, and clinical findings, classified subjects as having low, intermediate, and high probability and detected PE in 67% of those with a high probability, 21% of those with an intermediate probability, and 4% of those with a low probability [4]. We detected a somewhat higher rate of PE compared to Wells et al.; however, our results were consistent with those of Chagnos et al. [9]. When assessed with Wells score, distribution of subjects to groups with low, intermediate, and high probability and PE prevalence in the groups were comparable with other studies [10,11]. It was noted
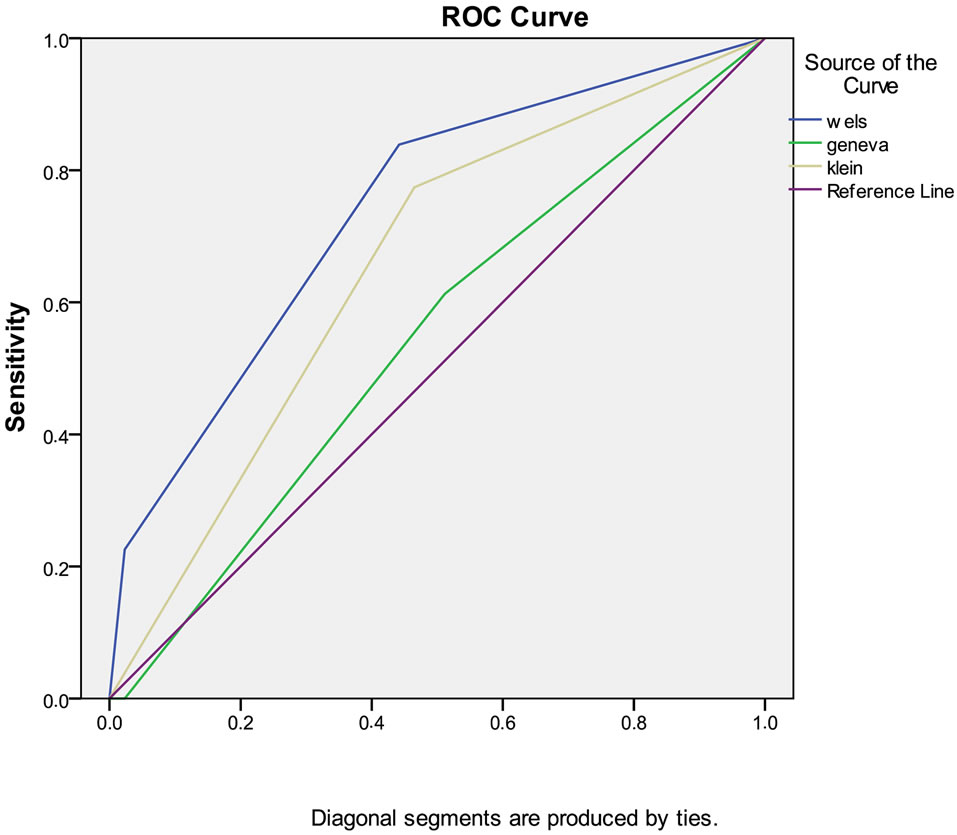
Figure 2. ROC analyses for wells, kline and Geneva scoring system.
that as the Wells score increases, the rise in the rate of PE diagnosis was significant.
Our results were consistent with Kline et al.’s results when assessed with Kline classification. The PE prevalence in unsafe group was significantly higher than safe group; nevertheless, there are not adequate trials for its evaluation and use.
When assessed with Geneva scoring system, patients distribution in low probability group was consistent with that in the study by Wicki et al. However, we had a greater number of patients diagnosed with PE in the low probability group. There was no significant correlation in terms of PE diagnosis between low and intermediate high probabilities. In this respect, our results were consistent with those of Moores et al. [10], while differrent from those of Chagnon et al. [9].
In a previous study, PE diagnosis was put in a rate of 20% in case PE was the most probable diagnosis [12]. Although the criterion of “pulmonary embolism as likely as or more likely than an alternative diagnosis” in Wells scoring system seems subjective that puts the patient directly into a moderate probability group by giving 3 points at the time and necessitates a further imaging molity, Wells scoring system seems to have broadly better predictive value in PE.
Geneva scoring system classified more patients with PE into low probability group; on the other hand, it classified patients without PE into moderate probability groups, falling picking up patients. Among criteria of Geneva score, previous DVT/PE, tachycardia, and previous surgery are also the components of Wells scoring system. However, lack of criteria of active DVT signs, hemoptysis, malignancy, and “pulmonary embolism as likely as or more likely than an alternative diagnosis” in Geneva criteria probably put the patients with PE into the lowprobability group as well as assigning a point to every hypoxic value in arterial blood gas irrespective of the etiology may have given the results in our study by including other clinical scenarios confused with PE in the high probability group. In a meta-analysis, 40% - 49% of patients were included in the low probability (less than a probability of 10%) group when assessed by Wells and Geneva systems. Six to seven percent of patients were deemed to have high-probability (greater than 65%), and the remaining half was considered intermediate-probability group (20% - 40% probability) [13]. Results of our study showed that Wells score is consistent with this metaanalysis whereas Geneva score is not.
Kargel and Reissig [14] reported that pathophysiologic manifestations are directly related to embolic size in patients with no previous cardiopulmonary disease, there is a linear relationship between angiographic obstruction and mean pulmonary artery pressure, right atrial pressure, partial oxygen pressure, and pulse pressure but this relationship is lost in patients with comorbid diseases, and no relation can be established between the above criteria and the size of embolic obstruction. The difference between studies by Chagnon [9], Moores [10], Miniati [11], and our study should be the result of presence or absence of comorbid diseases and population differences between the study groups. In patients with no comorbidities confused with PE, Geneva classification would likely give a more accurate result.
Wells score had the greatest area under curve in ROC analysis. Studies in literature comparing Wells and Geneva scores have given conflicting results [9,10,15]. Although Kline scoring system had a smaller AUC compared to Wells, it was more valuable than Geneva system. However, it may be a disadvantage to reducing the assessment of patients younger than 50 years having a stable clinical status only to d-dimer tests.
5. Conclusions
As a conclusion, various pretest scoring systems based on predisposing factors, symptoms, clinical, radiologic, and laboratory data are important to reach PE diagnosis and sometimes to obviate the need for unnecessary further diagnostic work-up.
Among these methods, Wells method seems more useful compared to Geneva and Kline methods particularly in emergency department.
REFERENCES
- C. N. Schoenfeld, “Pulmonary Embolism,” In: J. E. Tintinalli, G. D. Kelen and J. S. Stapczynski, Eds., Emergency Medicine: A Comprehensive Study Guide, 5th Edition, McGraw Hill, NewYork, 2000, pp. 396-401.
- J. H. Marieke, A. Kruip, et al., “Diagnostic Strategies for Excluding Pulmonary Embolism in Clinical Outcome Studies,” Annals of Internal Medicine, Vol. 138, No. 12, 2003, pp. 941-951.
- C. F. Fied, “Venous Thrombosis and Pulmonary Embolism,” In: P. Rosen and R. M. Barkin, Eds, Rosen’s Emergency Medicine Concepts and Clinical Practise, 5th Edition, MosbyYearbook Inc., Toronto, 2002. pp. 1210-1235.
- P. S. Wells, J. S. Ginsberg, D. R. Anderson, et al., “Use of a Clinical Model for Safe Management of Patients with Suspected Pulmonary Embolism,” Annals of Internal Medicine, Vol. 129, No. 12, 1998, pp. 997-1005.
- J. Wicki, T. V. Perneger and A. F. Junod, “Assessing Clinical Probability of Pulmonary Embolism in the Emergency Ward: A Simple Score,” Archives of Internal Medicine, Vol. 161, No. 1, 2001, pp. 92-97. doi:10.1001/archinte.161.1.92
- C. Kearon, “Diagnosis of Pulmonary Embolism,” Canadian Medical Association Journal, Vol. 168, No. 2, 2003, pp. 183-194.
- British Thoracic Society Standards of Care Committee Pulmonary Embolism Guideline Development Group, “British Thoracic Society Guidelines for the Management of Suspected Acute Pulmonary Embolism,” Thorax, Vol. 58, 2003, pp. 470-484. doi:10.1136/thorax.58.6.470
- J. A. Kline, R. D. Nelson, R. E. Jackson, et al., “Criteria for the Safe Use of D-Dimer Testing in Emergency Department Patients with Suspected Pulmonary Embolism: A Multicenter US Study,” Annals of Emergency Medicine, Vol. 39, No. 2, 2002, pp. 144-152. doi:10.1067/mem.2002.121398
- I. Chagnon, H. Bounameaux and D. Aujesky, “Comparison of Two Clinical Prediction Rules and İmplicit Assessment among Patients with Suspected Pulmonary Embolism,” American Journal of Medicine, Vol. 113, No. 4, 2002, pp. 269-275. doi:10.1016/S0002-9343(02)01212-3
- L. K. Moores, J. F. Collen, K. M. Woods, et al., “Practical Utility of Clinical Prediction Rules for Suspected Acute Pulmonary Embolism in a Large Academic Institution,” Thrombosis Research, Vol. 113, No. 1, 2004, pp. 1-6. doi:10.1016/j.thromres.2004.01.011
- M. Miniati, M. Bottai and S. Donti, “Comparison of 3 Clinical Models for Predicting the Probability of Pulmonary Embolism,” Medicine (Baltimore), Vol. 84, No. 2, 2005, pp. 107-114. doi:10.1097/01.md.0000158793.32512.37
- C. Kabrhel, A. T. McAfee and S. Z. Goldhaber, “The Probability of Pulmonary Embolism Is a Function Diagnoses Considered Most Likely before Testing,” Academic Emergency Medicine, Vol. 13, No. 4, 2006, pp. 471-474. doi:10.1111/j.1553-2712.2006.tb00332.x
- ACEP Clinical Policies Committee and the Clinical Policies Subcommittee on Suspected Pulmonary Embolism, “Clinical Policy: Critical Issues in the Evaluation and Management of Adult Patients Presenting with Suspected Pulmonary Embolism,” Annals of Emergency Medicine, Vol. 41, No. 2, 2003, pp. 257-270. doi:10.1067/mem.2003.40
- C. Kroegel and A. Reissig, “Principal Mechanisms Underlying Venous Thromboembolism: Epidemiology, Risk Factors, Pathophysiology and Pathogenesis,” Respiration, 2003, Vol. 70, No. 1, pp. 7-30. doi:10.1159/000068427
- C. T. Ulukavak, N. Köktürk, N. Demir, K. I. Oğuzülgen and N. Ekim, “Comparison of Three Clinical Prediction Rules among Patients with Suspected Pulmonary Embolism,” Tuberk Toraks, Vol. 53, No. 3, 2005, pp. 252-258.
NOTES
*Conflict interest: Authors decelerated no conflict of interest.
#Corresponding author.