Natural Resources
Vol.5 No.11(2014), Article
ID:48895,9
pages
DOI:10.4236/nr.2014.511053
Tidal Heights in Hyper-Synchronous Estuaries
Ian M. Kidd1, Shuhong Chai2, Andrew Fischer1*
1National Centre for Marine Conservation & Resource Sustainability, Australian Maritime College, University of Tasmania, Launceston, Australia
2National Centre for Maritime Engineering and Hydrodynamics, Australian Maritime College, University of Tasmania, Launceston, Australia
Email: *Andy.Fischer@utas.edu.au
Copyright © 2014 by authors and Scientific Research Publishing Inc.
This work is licensed under the Creative Commons Attribution International License (CC BY).
http://creativecommons.org/licenses/by/4.0/


Received 10 May 2014; revised 19 June 2014; accepted 8 July 2014
ABSTRACT
Inconsistencies between datasets are examined with reference to flood tidal elevations in the Tamar River estuary, Tasmania Australia. Errors in a 30-year-old commonly cited dataset have been perpetuated in subsequent publications and datasets, and a clarification is herein provided. Elevation of the flood tidal wave as it propagates the estuary is evident in mean tide level and mean sea level, although the analysis is compromised by the temporal differences of the datasets. As sea levels rise due to global warming, the importance of accurate on-going sea level data in any estuary will become more acute.
Keywords:Height Datum, Mean Sea Level, Mean Tide Level, Estuary, Digital Elevation Model, Global Warming, Sea Level Rise

1. Introduction
Expression of elevation on the surface of the Earth is not a trivial matter, and many countries develop their own systems. In Australia, the system used is the Australian Height Datum (AHD) which is an elevation relative to mean sea level (MSL), as measured at one of 30 reference stations around the Australian coast [1] . Tasmania has two such stations: Burnie and Hobart (Figure 1(A)). The geoid to which AHD refers is not a true spheroid but undulates due to variations in the sea surface, caused by ocean currents, the Coriolis force, and meteorological influences. 0 m AHD is therefore the MSL at any one of the 30 reference points around Australia, but may vary depending on which station is used as a reference. AHD in Tasmania has been estimated to be 12 - 26 cm offset

Figure 1. Location of the Tamar and North Esk Rivers estuary system. The North Esk estuary (C) is bounded by a system of flood levees at ~5 m AHD and tidal levees at ~2.5 m AHD. The Vermont tidal levee withstands spring tides in excess of 2.1 m AHD.
to that in Victoria [1] and suggestions have been made to improve the system [2] . In an estuarine environment, elevations using MSL as the datum can be problematic. Tidal forcing of the flood tide into an estuary may elevate the water body in the manner of a wave breaking on a beach; the kinetic energy of the wave is converted to potential energy as the water runs up the beach, and the maximum elevation attained by the water is higher than mean elevation of the wave. In a hyper-synchronous estuary such as the Tamar River (Figure 1(B) and Figure 1(C)), the initial kinetic energy is partly dissipated by friction, partly by conversion to potential energy as the tidal amplitude increases [3] , and partly by elevating the water body into the upper reaches. This should manifest as an increase in mean tide level (MTL) and MSL [4] . Further, the formation of the M4 and M6 tidal harmonics in the (shallower) upper estuary should produce a difference between MTL and MSL due mainly to M4 [5] . We hypothesized that tidal data for the Tamar River estuary ought to reflect this difference of the amplitude wave to some extent, but it is not apparent in all datasets. We will show that inconsistencies are evident in reports and published papers relating to the Tamar River estuary and also in official Tasmanian Government Digital Elevation Model (DEM) datasets; with some being in error by ~1 m whilst some less prominent sources are more accurate. Some of Launceston’s infrastructure is built on old tidal floodplains [6] [7] , and an assessment of the risk to these assets depends on an accurate tidal dataset, particularly as sea levels rise as a result of global warming. On a global scale, any inconsistencies between datasets have ramifications for mitigating the effects of climate change, flood control and planning in general.
2. Methods
Various datasets were analyzed for MSL and MTL for each of neap, mean and spring tides. The series analyzed are, Foster et al. 1986 [8] , BMT-WBM [9] , Bureau of Meteorology (BOM), Australian Hydrographic Service (AHO) [10] and a constituent dataset from the Australian Maritime College. The web site www.tide-forecast.com produces tide forecasts for Launceston and Georgetown, using tidal datum of Mean Lower Low Water applicable at each station. We compared one month of data (May 2014) for Launceston and Georgetown. The Australian Bureau of Meteorology (BOM) http://www.bom.gov.au/australia/tides/ produces tide tables for Low Head and predictions “based on limited observations” for Launceston. Where possible, MSL was calculated as the hourly average of tidal heights, and MTL was calculated as the average of maximum and minimum tidal heights over the relevant time span. Figures for neap and spring tides were calculated from the lowest and highest five consecutive days from each month of a dataset.
3. Results
3.1. Foster et al. (1986)
In the 1980s the Launceston City Council in collaboration with other entities, commissioned a report on the sedimentation occurring in the upper reaches [8] , excerpts of which were peer reviewed and published [11] . Tidal elevations and gradients from a two month sample from March and April 1985 are shown in Figure 2. The Launceston data used by Foster et al. [8] had a datum of Low Water Ordinary Spring Tide (LWOST) or −2.26 m AHD; 5.238 m below an existing bench mark on the City of Launceston’s Customs House, which is adjacent to the Charles St Bridge (Figure 1(c)). The datum at Georgetown is Lowest Astronomical Tide (LAT) which is 1.998 m below AHD 0 m.
3.2. BMT-WBM
In 2005 the findings of Foster et al. [8] were reviewed by the engineering, architecture and environmental consulting firm GHD, who employed BMT-WBM [9] to undertake the review and produce a 2D hydrodynamic model of the estuary. They produced a tidal model as an input to the hydrodynamic model which was calibrated against sampled data. Their Figure 4.1 is a duplicate of Foster’s with the vertical axis labelled “Tidal Level (m AHD)”, however their model calibration data conflicts with that of Foster et al. in that it shows a mean spring tide level of 0.48 m (AHD). MSL shows an elevation of 0.14m over that of Foster et al. [8] .
3.3. The Australian Bureau of Meteorology (BOM)
BOM hold hourly data for July and August 1969 for Launceston and a dataset for Low Head from 2003 to 2013 as plotted in Figure 3.
3.4. Australian Hydrographic Service
The Australian Hydrographic Service produces a navigation chart for the Tamar Estuary which includes a table of tidal data for Low Head and Launceston (Table 1).
3.5. The Land Information Service of Tasmania (theLIST)
The Tasmanian Government publishes data on www.theLIST.tas.gov.au. Figure 4 shows a survey control point layer and a LiDAR Digital Elevation Model (DEM) grid layer. Digital elevation data are available for each of the tiles and can be checked against the survey control points. The point on the Charles St Bridge (Figure 1(C)) has the added advantage of an adjacent tide gauge using AHD as the datum (Figure 5). These data are useful to gauge Highest Astronomical Tide (HAT) as the system of tidal levees in the upper estuary withstands all tides, and the elevation of these levees must be at least that of HAT.
3.6 Australian Maritime College (AMC) Tidal Constituents
The AMC dataset is a tidal constituent analysis (Figure 6) for Low Head, Bell Bay, Tamar St Bridge and Henry St Bridge and is useful for evaluation of Z0 which provides an accurate MSL relative to datum at each station.

Figure 2. Tidal gradients March/April 1985.
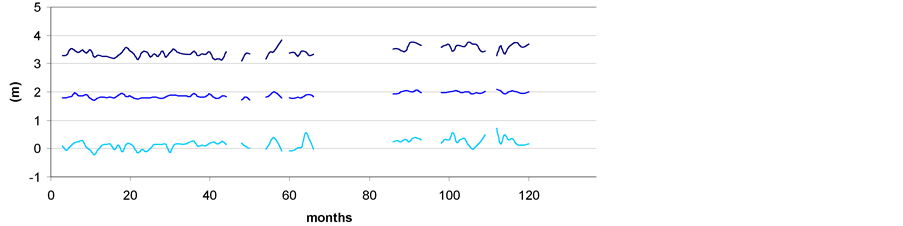
Figure 3. Graph from January 2003 to December 2012 of monthly MSL (middle series), maximum high water (top series) and minimum low water (lower series) at Low Head showing discontinuity and variability of the dataset (BOM).
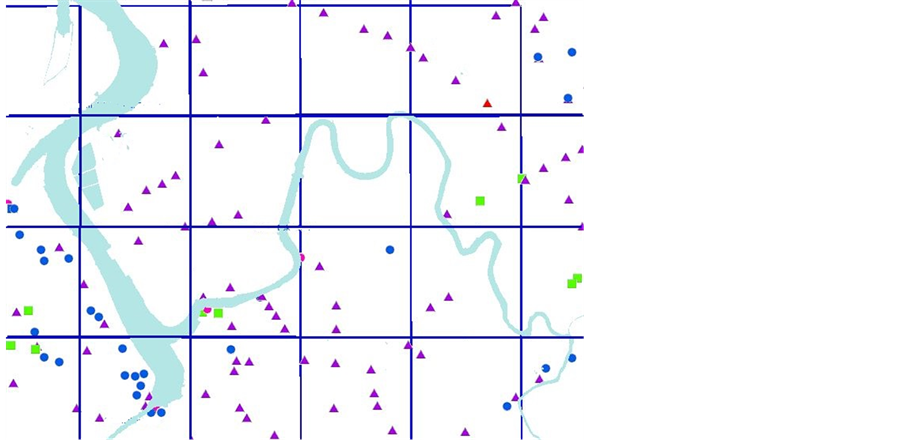
Figure 4. Data layers from www.theLIST.tas.gov.au showing survey control points and DEM grid files; accessed 27/Feb/2014. DEM files cover 1 km × 1 km at a resolution of 1 m.


Figure 5. (Left) Photo taken 10.30am (AEDST) 5/Jan/2014 showing tidal gauge calibrated to AHD on the Charles St Bridge and a tidal level of ~2.1 m AHD; and tidal gauge on Hobler’s Bridge (right) showing a water mark at ~2 m AHD.
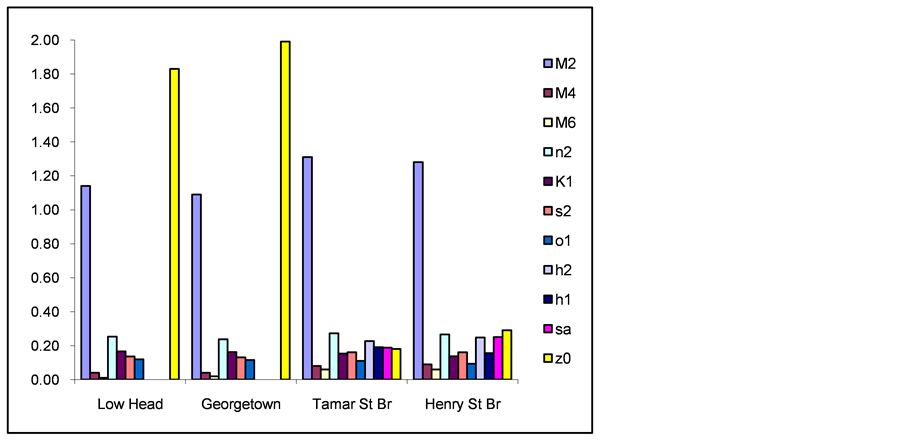
Figure 6. Major tidal constituents by station.

Table 1. Position and tidal data. With MSL at Low Head at ~2.0 m above the datum, then the conversion to AHD requires 2.0 m to be deducted from each height. This gives a MHWS for Launceston of 2.1 m AHD which is consistent with observation (Figure 5) but a MSL of ~0.6 m above the MTL of Foster et al.
The combined M4 and M6 components in Launceston are ~0.15 m. The data at each station are from differing time spans; Low Head has 46,224 records starting 24th March 2003; Georgetown has 354,912 records staring 7th July 1965; Tamar St Bridge has 8508 records starting 6th January 2009 and Henry St Bridge has 8872 records starting on the same date.
3.7. Tide Forecasts
The tide forecast data from www.tide-forecast.com and www.bom.gov.au/australia/tides/ are shown in Table 2, Figure 7 and Figure 8.
3.8. Other Data Sources
TasWater operates a tidal gauge on the Tamar St Bridge with readings every 3 to 5 minutes. Ellison and Sheehan [12] produced a single line graph of tidal range in the estuary (Figure 5) with a vertical axis of m AHD. The figure shows a gradual increase of tidal range from (0.2.5) to (703.25). Units are (km, m). The Launceston Flood Authority monitor silt accumulation levels in the upper estuary and produce graphics of the bathymetry. They claim a datum of AHD and show MHWS at 0 m AHD.
A further complication in the datasets is the use of Low Head, Georgetown or Bell Bay for the head of the estuary. Each has a unique datum. The constituent dataset shows significant differences between Low Head and Georgetown for Z0, M2 and other major constituents.
4. Discussion
Mean Tidal Level (MTL) is defined as the arithmetic mean of mean high water and mean low water and is distinct from MSL which is defined as the arithmetic mean of hourly heights [5] . AHD is defined by MSL at any of

Figure 7. Tidal elevation levels (m) from Low Head (or Georgetown) to Launceston.
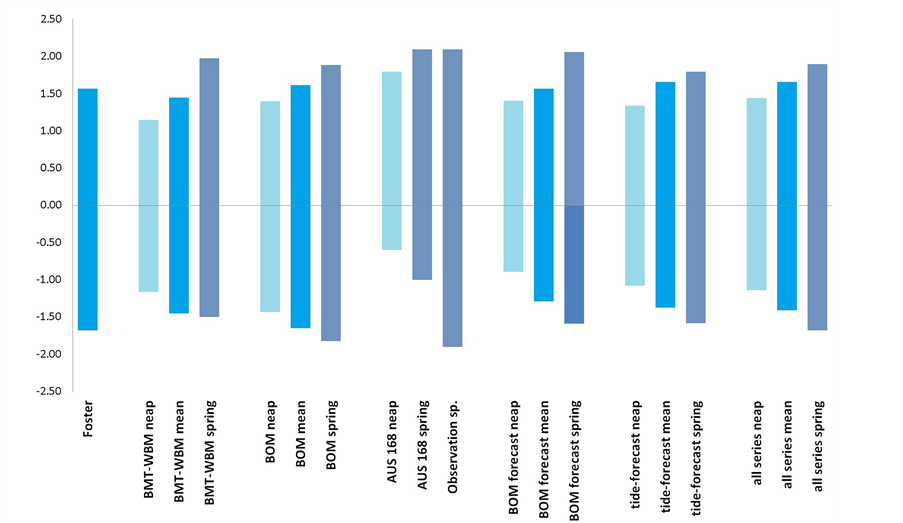
Figure 8. Launceston tidal ranges (m) relative to AHD according to various datasets.
the 30 designated tide stations, and assuming a level sea surface between Burnie and Low Head, then MSL at the mouth ought to be 0 m AHD. According to www.dpipwe.tas.gov.au the figure is −0.03 m AHD (Table 2). However the 9 year BOM dataset show this to be −0.14 m AHD with a datum of −2.0 m. This suggests an error in the datum because MSLs at Burnie and Low Head are −0.01 and −0.03 m respectively according to Table 3
Table 2. AHD tidal heights at mouth of the Tamar and Launceston according to various sources and elevations of MTL and/or MSL.
Table 3. AHD heights for Tasmanian tide stations (www.dpipwe.tas.gov.au accessed 30 April 2014).
and a datum of −1.89 m AHD is more likely and is used in the analysis.
Early cartographers believed that the tidal range was constant from Georgetown to Launceston with a range of 12 ½ ft. [13] , however the Foster et al. report [8] included a figure (Figure 2) showing how the tidal wave amplitude increases as the wave propagates up the estuary. The figure shows MTL at Low Head of 0 m AHD and the (Mean Water Levels (MWL) for high and low tides are scaled inside the vertical axis. However, the data are not supported by other datasets, indicating a problem with the datum or that the sample was too small. The vagaries of the data in Figure 3 indicate the latter is the case. The tidal wave is composed of hundreds of constituents (Figure 6) and it is possible that the constituents will combine such that low tide at Launceston will be lower than the corresponding tide at Low Head, but this is unlikely to be the case for the MTL or MSL. However, the Foster data and the BOM spring data show the opposite; indicating the problematic nature of comparisons using different temporal datasets. Table 3 gives a summary of sea levels in Launceston and Georgetown by data source and Figure 7 shows tidal ranges from Low Head to Launceston by data source. Elevations of MTLs from the mouth to Launceston are shown in Figure 8.
The LiDAR data from www.theLIST.tas.gov.au are inconsistent. Pixels close to survey control points appear to be accurate, whilst other areas appear to be lower than actual. A tidal levee to the north of Glebe Farm and protecting Vermont tidal flats (Figure 1(C)) withstands all tides and yet the elevation is given as 1.62 m AHD, which would just withstand a mean high tide according to the Foster et al. data. However, this is almost 0.5 m below the spring tide depicted in Figure 5, and allowing for 0.1 to 0.5 m clearance of the levee, this height could be in error by as much as 1.0 m. Similarly the flood levee between the Charles and Tamar St Bridges (Figure 1(C)) appears to dip from 5.1 m (confirmed by the survey marker and the tide gauge) to 4.69 m at the point approximately midway between the bridges. However, the DEM data confirm the accuracy of the gauge on the Charles St Bridge (Figure 5), and HWS of ~2.1 m AHD.
The AHD elevation of the Launceston datum used by Foster et al. [8] is −2.26 m AHD, which is also the datum used by BOM (P. Davill 2014, personal communication). The DEM level of the tidal levee at Vermont tidal flat, is roughly consistent with mean high water of Foster et al. and BMT-WBM, indicating that the Foster data may have been used for calibration in that area. For data where only HWS was observable, LWS was calculated from an assumed range of 4.0 m as per BOM and BMT-WBM datasets. MHWS from AUS 168 is consistent with all observational datasets; whilst MLWS appears too high. The other sources of data, including TasWater dataset, the LFA data and the Ellison and Sheehan graph did not provide information that was useful to this analysis, leaving the remaining datasets, each with their own accuracy at a particular level.
MSL was not available from all datasets as this calculation requires hourly readings. Of all datasets, Foster et al. [8] is the only one which does not show an elevation of the mean tide from Low Head to Launceston. This is unfortunate as it is the dataset most often cited. All other datasets show an elevation of MTL and MSL from the mouth to Launceston, which confirms our hypothesis that tides in the estuary undergo an elevation as well as amplification whilst propagating up the estuary. The BOM dataset confirms Pugh’s [5] assertion that the MTL and MSL difference ~equates to the amplitudes of the M4 and M6 tidal harmonics in the upper estuary (~0.15 m).
5. Conclusion
Our results confirm that the figure for tidal heights produced by Foster et al. is inconsistent with data from other sources. In particular, the mean water level is inconsistent with data from official navigation charts [10] , predictions from www.tide-forecast.com and BOM, elements of the DEM published on www.theLIST.tas.gov.au, historical data from BOM and our own observations. The Foster et al. figure correctly depicts relative water levels or MWLs and tidal ranges, and diagrams of this form are used in the literature [14] [15] . Other sources confirm our assertion that the water-body (manifest as MTL and MSL), is elevated as it is forced into the ever narrowing estuary. Historical data from BOM puts the elevation of MSL at 0.18m; allowing for an error in the datum confirmed by the constituent analysis. Spring tides do not necessarily produce a greater elevation than neap tides. This is due to a large variation in MTL at the mouth between neap and spring tides. Confusion between AHD, MTL, MWL and MSL (not to mention neap, mean and spring tides) is unfortunate and may explain errors in the calibration of a publicly available DEM. Parts of the model are consistent with survey control points while other points distant from the controls are low, with functioning tidal levees below known HWS level. In the absence of an official BOM tidal station in Launceston, caution should be observed when using any elevation or tidal dataset, as MSL cannot be assumed as ~0 m AHD. The dynamics and complexities of the estuarine environment, present challenges to accurate measurement of tidal height. The installation and maintenance of an official tide gauge in the upper estuary is essential for monitoring of on-going sea level rise, the rate of which can only increase as a result of global warming; and so that planning and mitigation can be implemented in a cost effective manner.
Acknowledgements
The authors thank and acknowledge the contribution of data and personal communication from Luciano Mason of AMC, LFA, TasWater, BOM, and tide-forecast.com.
References
- Featherstone, W. (2000) Towards the Unification of the Australian Height Datum between the Mainland and Tasmania Using GPS and AUSGeoid98. Geomatics Research Australasia, 33-54.
- Filmer, M. and Featherstone, W. (2012) Three Viable Options for a New Australian Vertical Datum. Journal of Spatial Science, 57, 19-36. http://dx.doi.org/10.1080/14498596.2012.679248
- Dyer, K. (1986) Coastal and Estuarine Sediment Dynamics. Wiley, Chichester.
- Pugh, D.T. (1996) Tides, Surges and Mean Sea-Level (Reprinted with Corrections). John Wiley & Sons Ltd., Hoboken.
- Pugh, D. (2004) Changing Sea Levels: Effects of Tides, Weather and Climate. Cambridge University Press, Cambridge.
- Atkins, B. and Vince, J. (2009) The Launceston Flood Policies: Levees and Beyond. The Australian Journal of Emergency Management, 24, 32-37.
- Davis, J. and Kidd, I. (2012) Identifying Major Stressors: The Essential Precursor to Restoring Cultural Ecosystem Services in a Degraded Estuary. Estuaries and Coasts, 35, 1007-1017. http://dx.doi.org/10.1007/s12237-012-9498-7
- Foster, D., Nittim, R. and Walker, J. (1986) Tamar River Siltation Study, in Report Prepared for the Tamar River Improvement Committee, University of New South Wales, Paddington.
- BMT_WBM (1986) Tamar Estuary Review of Foster. Report on Sedimentation Processes. http://www.launceston.tas.gov.au/upfiles/lcc/cont/_environment/earth_wind_water_fire/river_management/sediment_study_evaluation_report__volume_1.pdf
- AUS_168 (2012) River Tamar Long Reach to Launceston, in River Tamar Long Reach to Launceston 2012, Australian Hydrographic Service, Wollongong, Navigation Chart.
- Foster, D. and Nittim, R. (1987) Siltation of the Tamar River. Eighth Australasian Conference on Coastal and Ocean Engineering, 1987: Preprints of Papers. Institution of Engineers, Barton.
- Ellison, J.C. and Sheehan, M.R. (2014) Past, Present and Futures of the Tamar Estuary, Tasmania, in Estuaries of Australia in 2050 and Beyond. Springer, Berlin, 69-89. http://dx.doi.org/10.1007/978-94-007-7019-5_5
- Welsh, J. (1830) The River Tamar van Diemens Land, 1830, UK Hydrographic Office, London, Navigation Chart for the River Tamar. http://nla.gov.au/nla.map-nk2456-171
- Dyer, K.R. (1997) Estuaries: A Physical Introduction. Wiley, Chichester.
- Toffolon, M. (2002) Hydrodynamics and Morphodynamics of Tidal Channels. Ph.D. Thesis, University of Padova, Padova.
NOTES

*Corresponding author.