Open Journal of Biophysics
Vol.3 No.1A(2013), Article ID:28263,5 pages DOI:10.4236/ojbiphy.2013.31A007
Fluorescent Voltage Imaging Technique for the Measurement of Molluscan Neural Activities
Department of Correlative Study in Physics and Chemistry, Graduate School of Integrated Basic Sciences, Nihon University, Tokyo, Japan
Email: *msaito@chs.nihon-u.ac.jp
Received January 11, 2013; revised February 12, 2013; accepted February 20, 2013
Keywords: Fluorescent Voltage Imaging Technique; Neural Activity; Mollusk; S/N Ratio; Olfactory Processing Feeding Rhythm
ABSTRACT
The electrophysiological methods using microelectrodes are not appropriate for the simultaneous measurement of neural activities of many neurons. To overcome the difficulty, the fluorescent imaging technique using voltage sensitive dyes can be a powerful technique. The voltage sensitive dyes, however, generally exhibit a relatively small change in their fluorescence intensities, resulting in a low S/N ratio. Additionally, they often exhibit photobleaching and phototoxity. We have therefore improved the fluorescent voltage imaging technique by using a LED as the light source and an electron multiplying (EM)-CCD camera as the fluorescence detector. In this study, we applied our imaging system for the measurement of two kind of molluscan neural activities; one of which is involved in the olfactory processing of the land slug Limax valentianus and the other is involved in the feeding rhythm of the pond snail Lymnaea stagnalis. The system enabled us to measure the neural activities for a long time with a high speed and a high S/N ratio, and the obtained results showed some new physiological findings.
1. Introduction
The conventional electrophysiological methods have been well used for the measurement of neural activities of vertebrates and invertebrates. The direct measurement of activities of a single neuron is possible by the conventional methods using microelectrodes. However, they are not appropriate for the simultaneous measurement from many neurons. To overcome the difficulty, the fluorescent imaging technique using voltage sensitive dyes or calcium sensitive dyes can be a powerful technique. In this technique, the dyes, which change their fluorescence intensities due to the voltage or calcium ion concentration change [1], are loaded into the cells, and their fluorescence changes are acquired into a computer as a series of images. By using the voltage imaging, the measurement of neural activities was reported in vertebrates [2] and invertebrates [3-5]. The voltage sensitive dyes, however, generally exhibit a relatively small change in the fluorescence intensities, resulting in a low S/N ratio. Additionally, they often exhibit photobleaching and phototoxity. Therefore, there are not many reports on a long time stable measurement by the voltage imaging. Alternatively, the substitutive use of the calcium imaging has been attempted for the measurement of neural activities. The calcium sensitive dyes exhibit a larger change in the fluorescence intensities than the voltage sensitive dyes. Their fluorescence changes can be detected easily, and enable us to indirectly measure the neural activities since the intracellular calcium concentration can be often increased with the neural activities [6,7].
In the calcium imaging, the calcium sensitive dyes bonded with the acetoxymethyl (AM) group, which is permeable into cells, are commonly used. After the AM dyes permeate into cells, the AM group is dissociated by intracellular esterase, and then the dyes can be non-permeable and loaded into cells. Vertebrate neurons are well known to be easily loaded with the AM calcium sensitive dyes [7-10]. In invertebrates, however, the AM dyes can not be easily loaded into neurons because the AM group is difficult to be dissociated due to their weak activity of intracellular esterase.
We have therefore improved the fluorescent voltage imaging technique for the direct measurement of invertebrate neural activities although the voltage sensitive dyes have some defects as mentioned above. For this purpose, we have used a LED as the light source and an electron multiplying (EM)-CCD camera as the fluorescence detector, leading to a long time measurement with a high speed and a high S/N ratio.
In this study, we applied our imaging system for the measurement of two kind of molluscan neural activities; one of which is involved in the olfactory processing of the land slug Limax valentianus and the other is involved in the feeding rhythm of the pond snail Lymnaea stagnalis.
2. Materials and Methods
2.1. Preparations
The land slug Limax valentianus was anesthetized by injection of 35 mM Mg2+ solution into the body cavity, and the central nervous system was isolated with tentacles from the body in the dissection solution (NaCl 35, KCl 2, MgCl2 28, CaCl2 4.9, D-glucose 5, HEPES-NaOH 5 (pH 7.6)). Then, the dye loading was performed in the slug saline (NaCl 70, KCl 2, MgCl2 4.7, CaCl2 4.9, D-glucose 5, HEPES-NaOH 5 (pH 7.6))
The pond snail Lymnaea stagnalis was anesthetized by 25% ListerineÒ before dissection, and then the central nervous system was isolated from the body in the snail saline (composition in mM: NaCl 24, KCl 2, MgCl2 2, CaCl2 4, D-glucose 0.3, NaH2PO4 0.1, HEPES-NaOH 35.4 (pH 7.9)). After the sheath was removed and the desheathed preparation was treated with 1 mg/ml proteinase (type XXIV, Sigma) for 30 min, the dye loading was performed in the snail saline.
2.2. Dye Loading
The central nervous system isolated from the slug or the snail was stained with a voltage sensitive dye Di-4- ANEPPS (Wako, Japan). This dye intercalates among the lipophilic part of cell membranes. The excitation induces charge redistribution of the dye. A change in the voltage across the membrane therefore causes a spectral shift resulting from an interaction between the field and the ground and excited state dipole moments.
The slug or snail preparation was loaded for 30 min or 50 min at room temperature with 86 mM Di-4-ANEPPS in the presence of 0.06% cremophor EL and 0.6% ethanol in the slug or snail saline. After the dye loading, the preparation was washed with the slug or snail saline.
2.3. Fluorescent Voltage Imaging Measurement
Figure 1 shows the schematic illustration of the present fluorescent voltage imaging system. The stained preparation was placed in a recording chamber mounted on a stage of a microscope (E600-FN, Nikon, Japan). The neurons were visualized with a 10× water immersion objective lens (Fluor, 0.30 NA, Nikon, Japan). As the light source, we used a LED of 530 nm with a half width of 25 nm (LEX2-G, Brain Vision, Japan). Di-4-ANEPPS was excited by the LED through an excitation filter (EX510- 560). The emitted fluorescence of 705 nm was detected through a dichroic reflector (DM575) and a barrier filter (BA590). The fluorescence images were acquired by an EM-CCD camera (iXon X3 897, Andor, Ireland). The image sequences were stored into a personal computer (Dell Precision T3500, Dell, USA) and analyzed with Andor SOLIS (Ver. 4.18, Andor, Ireland). A change in the fluorescence intensity was estimated from each ROI (region of interest) flame. As shown in Figure 1, we also performed the simultaneous measurement of neural activities by electrophysiological methods.
3. Results and Discussion
3.1. Advantages of the Present Fluorescent Voltage Imaging System
The voltage sensitive dyes generally exhibit a relatively small change in the fluorescence intensities, which is about 0.1% for a change of 100 mV in membrane potential. Further, a fast change in membrane potential occurs in neural activities. Thus, in the fluorescent voltage imaging, a signal of 1/1000 of the fluorescence intensity must be detected at millisecond intervals. To realize a high S/N ratio, the light source must show a high intensity because the fluorescence intensity is proportional to the excitation intensity. It must also show a high stability because the signal is about 0.1% change in the fluorescence intensity for the measurement of neural activities. In the present imaging system, we therefore selected a LED (LEX2-G, Brain Vision, Japan) mentioned above as the light source. The LED shows a high intensity comparable to other light sources such as a xenon lamp and a halogen lamp and a higher stability (<±0.01% in most conditions) than them.
To realize a high speed imaging with millisecond resolution, the fluorescence detector must show a high sensitivity which can improve the flame rate. We therefore
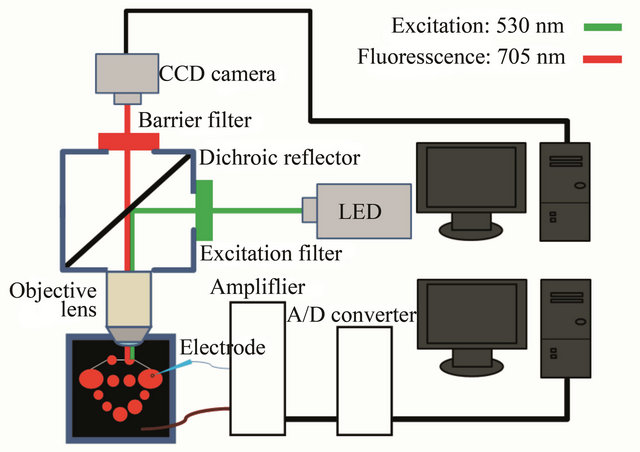
Figure 1. Schematic illustration of the present fluorescent voltage imaging system.
selected an EM-CCD camera (iXon X3 897, Andor, Ireland) mentioned above as the fluorescence detector. In EM-CCDs, photoelectrons detected by the CCD chip are multiplied through a large number of stages of the gain register. EM-CCDs are often compared with intensified CCDs (ICCDs) and their sensitivities are similar to those of ICCDs. EM-CCDs, however, show a lower noise than ICCDs because they don’t have image intensifiers.
In the present imaging system, the measurement time mostly depends on photobleaching of the dye because the high-end computer used has an enough memory. The intensity of the LED and the gain of the EM-CCD camera can be precisely adjusted to the optimum levels for each measurement so that the photobleaching can be possibly reduced. As a result, the present imaging system realized a long time measurement with a high speed and a high S/N ratio. The measurement for several minutes was possible under the present experimental conditions.
3.2. Measurement of Neural Activities Involved in the Olfactory Processing of the Land Slug
Rhythmic patterns of electrical activity are a ubiquitous feature of nervous systems. The modulation of oscillatory activities plays an essential role in the processing of sensory information. Olfactory processing has been extensively studied in the land slug. In the olfactory center (procerebrum; PC), which is located the distal part of each cerebral ganglion (see Figure 2(a)), an oscillation of local field potential (LFP) with about 1 Hz is observed by extracellular recording [11-13]. The LFP is due to the coherent activities of many neurons. Additionally, the oscillatory activity is reported to be changed by various odor stimuli to the tentacles. We here examined the odor responses of the spatiotemporal activity patterns of the PC by the present fluorescent voltage imaging system. Simultaneously, the LFP was measured by extracellular recording through a suction electrode filled with the slug saline. The signals were amplified with an extracellular recording amplifier (ER-1, Cygnus, USA). The recording chamber was consisted of two compartments with a slit connecting them (see Figure 2(b)). The cerebral ganglia were placed in one of the compartments filled with the slug saline, and the tentacles were placed to pass through the slit to the other compartment exposed to the air. The slit was sealed with silicon grease, and odor sources were placed near the tentacles.
Figure 3 shows a fluorescence measurement for the PC. In this case, the full image was composed of about 168,000 pixels. Each ROI (25 × 25 pixels) contained a few dozens of neurons. For this spatial resolution, the consecutive images could be acquired at a rate of 30 ms/ flame for 2.5 min by the present imaging system. As a result, we could observe an oscillation of the fluorescence
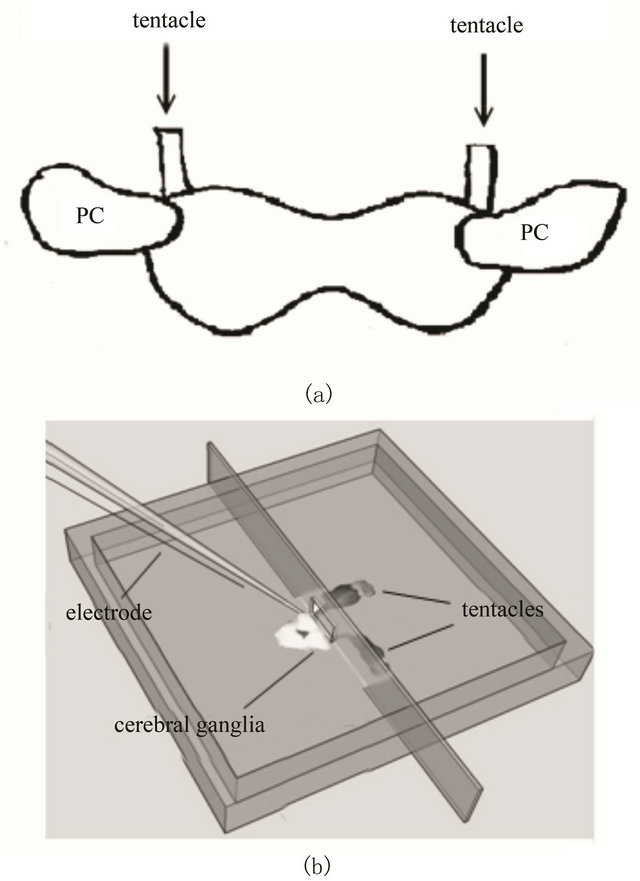
Figure 2. (a) Posterior view of a pair of cerebral ganglia with tentacles; (b) Schematic illustration of the recording chamber for the measurement of neural activities involved in the olfactory processing of the land slug.
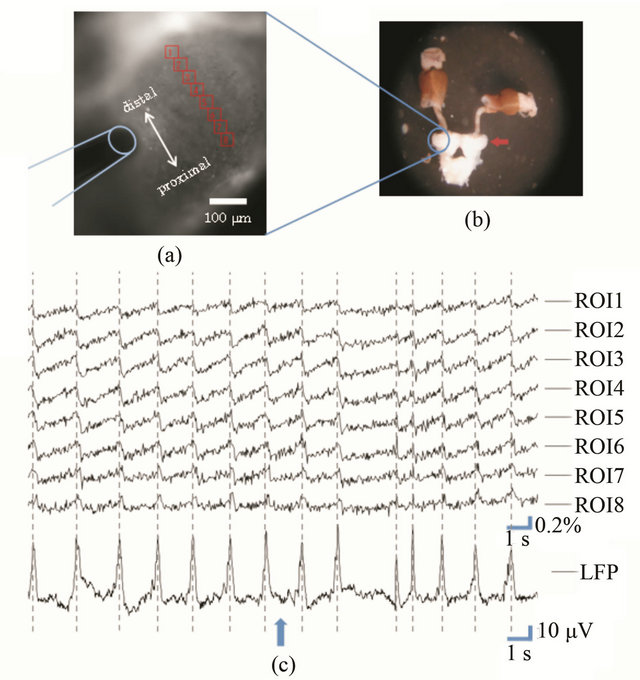
Figure 3. (a) Fluorescence image of the PC of the land slug. The ROI flames for fluorescence analysis (red squares) and the electrode for extracellular recording (blue figure) are also shown; (b) Preparation of the central nervous system with tentacles. The red arrow shows the PC; (c) Changes in the fluorescence intensity from the ROI flames. The LFP measured by extracellular recording is also shown. The aversive odor (isoamyl acetate) stimulus was applied at the time shown by the blue arrow.
intensity of each ROI with a high S/N ratio, which corresponded to the LFP oscillation measured by extracellular recording. Additionally, we found that the fluorescence oscillation had a phase delay along the distal-proximal axis of the PC. We also found that the frequency of the oscillation increased and the phase delay disappeared when an aversive odor source (isoamyl acetate, cineol and so on) was applied to the tentacles.
3.3. Measurement of Neural Activities Involved in the Feeding Rhythm of the Pond Snail
In our previous study, we have found that a regulatory neuron (cerebral giant cell; CGC) for the feeding rhythm in each cerebral ganglion of the pond snail [14] shows regular beating, regular bursting and irregular bursting discharges depending on the direct current through the cell membrane [15]. We here examined how the CGC activities affect the neural activities of the buccal ganglion (BuG), which is involved in the feeding rhythm, by the present imaging system. The CGC activities were measured simultaneously by intracellular recording through a glass microelectrode filled with 2 M potassium acetate. The signals were amplified with an intracellular recording amplifier (IR-283, NEURO DATA, USA). The direct current was injected into the CGC through the electrode to control the activities.
Figure 4 shows a fluorescence measurement for the BuG. In this case, the full image was set to about 217,000 pixels so that each ROI (15 × 15 - 35 × 35 pixels) could contain an individual neuron. For this spatial resolution, the consecutive images could be acquired at a rate of 40 ms/flame for 4 min by the present imaging system. As a result, we could detect the activities of each neuron of the BuG from the fluorescence intensity change of each ROI with a high S/N ratio, although we needed to expand the duration of action potentials by a potassium blocker, tetraethylammonium (TEA). We are confirming that the improved measurement with a faster flame rate and without TEA is possible by using another objective lens with a larger NA, which will be reported elsewhere.
As shown in Figure 4(b), some neurons in the BuG showed the synchronized activities. When the direct current of 100 pA was injected to the CGC, the firing rate of the CGC increased followed by more frequent activities of the neurons in the BuG (see also Figure 4(c)). Thus, the projection of the CGC to the neurons in the BuG was physiologically shown.
Further, the CGC activities can be measured simultaneously by the fluorescence measurement with the BuG activities. Figure 5 shows a comparison of the fluorescence measurement to the intracellular recording for the CGC activities. The fluorescence intensity change corresponded to the firing of the CGC. From this result, it is also confirmed that the activities of individual neurons
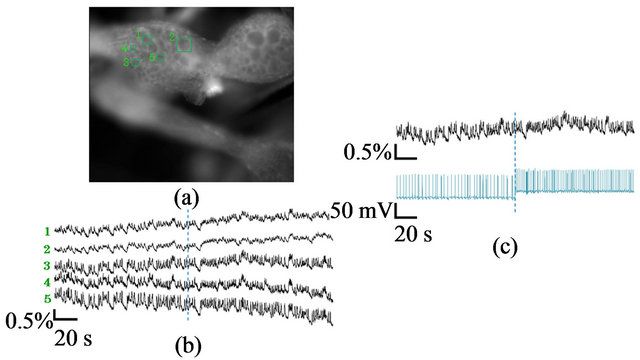
Figure 4. (a) Fluorescence image of the BuG of the pond snail. The ROI flames for fluorescence analysis (green squares) are also shown; (b) Changes in the fluorescence intensity from the ROI flames; (c) Change in the fluorescence intensity from the ROI flame 3 (upper figure) and the activities of the CGC measured by intracellular recording (lower figure). The direct current of 100 pA was injected to the CGC at the time shown by the blue dotted line.
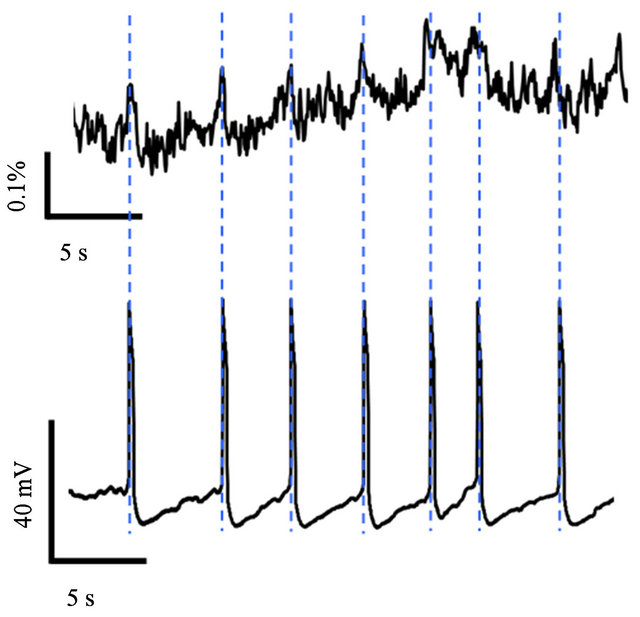
Figure 5. Comparison of the fluorescence measurement (upper figure) to the intracellular recording (lower figure) for the CGC activities.
can be detected by the present fluorescence measurement.
4. Conclusion
The present fluorescent voltage imaging system using a LED as the light source and an EM-CCD camera as the fluorescence detector realized a long time measurement for molluscan neural activities with a high speed and a high S/N ratio. By using it, we obtained the following results: 1) In the PC of the land slug Limax valentianus, the fluorescence oscillation, which corresponded to the LFP oscillation measured by extracellular recording, had a phase delay along the distal-proximal axis of the PC. The frequency of the oscillation increased and the phase delay disappeared when an aversive odor source was applied to the tentacles. 2) In the BuG of the pond snail Lymnaea stagnalis, more frequent activities of the neurons were observed when the direct current was injected to the CGC. Thus, the projection of the CGC to the neurons in the BuG was physiologically shown. We expect that our fluorescent voltage imaging technique will lead to the new findings on the neural function of the central nervous system of mollusks.
5. Acknowledgements
We thank Professor Etsuro Ito of Tokushima Bunri University for kindly providing Lymnaea stagnalis.
REFERENCES
- R. P. Haugland, “Handbook of Fluorescent Probes and Research Products,” Molecular Probes Inc., Eugene, 2001.
- H. S. Orbach, L. B. Cohen and A. Grinvald, “Optical Mapping of Electrical Activity in Rat Somatosensory and Visual Cortex,” Journal of Neuroscience, Vol. 5, No. 7, 1985, pp. 1886-1895.
- K. R. Delaney, A. Gelperin, M. S. Fee, J. A. Flores, R. Gervais, D. W. Tank and D. Kleinfeld, “Waves and Stimulus-Modulated Dynamics in an Oscillating Olfactory Network,” Proceedings of the National Academy of Sciences of the United States of America, Vol. 91, No. 2, 1994, pp. 669-673. doi:10.1073/pnas.91.2.669
- K. Okada, R. Kanzaki and K. Kawachi, “High-Speed Voltage-Sensitive Dye Imaging of an in Vivo Insect Brain,” Neuroscience Letters, Vol. 209, No. 3, 1996, pp. 197-200. doi:10.1016/0304-3940(96)12646-X
- S. Watanabe, S. Shimozono and Y. Kirino, “Optical Recording of Oscillatory Neural Activities in the Molluscan Brain,” Neuroscience Letters, Vol. 359, No. 3, 2004, pp. 147-150. doi:10.1016/j.neulet.2004.01.063
- R. Yoshida, A. Iwamoto and T. Nagahama, “Calcium Imaging for Detection and Estimation of Spike Activities in Aplysia Neurons,” Zoological Science, Vol. 18, No. 5, 2001, pp. 631-643. doi:10.2108/zsj.18.631
- N. Takahashi, S. Oba, N. Yukinawa, N. Ujita, M. Mizunuma, N. Matsuki, S. Ishii and Y. Ikegaya, “High-Speed Multineuron Calcium Imaging Using Nipkow-Type Confocal Microscopy,” Current Protocols in Neuroscience, Vol. 57, 2011, pp. 2.14.1-2.14.10.
- Y. Kudo, T. Nakamura and E. Ito, “A ‘Macro’ Image Analysis of Fura-2 Fluorescence to Visualize the Distribution of Functional Glutamate Receptor Subtypes in Hippocampal Slices,” Neuroscience Research, Vol. 12, No. 3, 1991, pp. 412-420. doi:10.1016/0168-0102(91)90072-7
- S. Sato, H. Osanai, T. Monma, T. Harada, A. Hirano, M. Saito and S. Kawato, “Acute Effect of Corticosterone on N-Methyl-D-Aspartate Receptor-Mediated Ca2+ Elevation in Mouse Hippocampal Slices,” Biochemical and Biophysical Research Communications, Vol. 321, No. 2, 2004, pp. 510-513. doi:10.1016/j.bbrc.2004.06.168
- H. Osanai, A. Suzuki, Y. Komatsuzaki, H. Mukai, S. Kawato and M. Saito, “The Binding Site for Acute Corticosterone Effects on N-Methyl-D-Aspartate ReceptorMediated Ca2+ Signals in Mouse Hippocampal Slices,” Journal of Biophysical Chemistry, Vol. 2, No. 4, 2011, pp. 430-433. doi:10.4236/jbpc.2011.24050
- A. Gelperin and D. W. Tank, “Odour-Modulated Collective Network Oscillations of Olfactory Interneurons in a Terrestrial Mollusk,” Nature, Vol. 345, No. 6274, 1990, pp. 437-440. doi:10.1038/345437a0
- A. Gelperin, L. D. Rhines, J. Flores and D. W. Tank, “Coherent Network Oscillation by Olfactory Interneurons: Modulation by Endogenous Amines,” Journal of Neurophysiology, Vol. 69, No. 6, 1993, pp. 1930-1939.
- T. Kimura, S. Toda, T. Sekiguchi and Y. Kirino, “Behavioral Modulation Induced by Food Odor Aversive Conditioning and Its Influence on the Olfactory Responses of an Oscillatory Brain Network in the Slug Limax marginatus,” Learning & Memory, Vol. 4, No. 5, 1998, pp. 365-375. doi:10.1101/lm.4.5.365
- H. Nakamura, S. Kojima, S. Kobayashi, I. Ito, Y. Fujito, H. Suzuki and E. Ito, “Physiological Characterization of Lip and Tentacle Nerves in Lymnaea stagnalis,” Neuroscience Research, Vol. 33, No. 4, 1990, pp. 291-298. doi:10.1016/S0168-0102(99)00020-6
- M. Saito, Y. Hamasaki, M. Hosoi and S. Nakada, “Various Firing Patterns Found in a Giant Neuron of the Pond Snail Lymnaea stagnalis and Their Dynamics,” Journal of the Physical Society of Japan, in Press.
NOTES
*Corresponding author.