Open Journal of Metal
Vol.4 No.2(2014), Article
ID:46886,9
pages
DOI:10.4236/ojmetal.2014.42004
FEM Simulation of Distortion and Residual Stress Generated by High Energy Beam Welding with Considering Phase Transformation
Y.-C. Kim1*, M. Hirohata2, K. Inose3
1Osaka University, Osaka, Japan
2Graduate School of Engineering, Nagoya University, Nagoya, Japan
3IHI Corporation, Yokohama, Japan
Email: *kimyc@ark.zaq.jp
Copyright © 2014 by authors and Scientific Research Publishing Inc.
This work is licensed under the Creative Commons Attribution International License (CC BY).
http://creativecommons.org/licenses/by/4.0/


Received 22 April 2014; revised 22 May 2014; accepted 29 May 2014
ABSTRACT
A series of experiments was carried out so as to elucidate the effect of the phase transformation in the cooling process on welding distortion and residual stress generated by laser beam welding (LBW) and laser-arc hybrid welding (HYBW) on the high strength steel (HT780). Then, the experiments were simulated by 3D thermal elastic-plastic analysis with FEM (Finite Element Method) which was performed with using the idealized mechanical properties considering the transformation superplasticity. From the results, the effects of the phase transformation on welding distortion and residual stress generated by LBW and HYBW were elucidated. Furthermore, the generality of the idealization of the mechanical properties was verified.
Keywords:Welding Distortion, Residual Stress, Laser Beam Welding, Laser-Arc Hybrid Welding, Phase Transformation, FEM

1. Introduction
For improving function and reducing weight of steel structures, aggressive use of high strength steel has been tried. In order to achieve this trial, it is essential that the performance of joints of high strength steel is improved. For this objective, researches of joining with laser beam have been conducted [1] .
Although joints with high quality can be manufactured by laser beam welding (LBW), it requires quite severe gap control between welded plates for avoiding generation of under fill. Therefore, application of laser-arc hybrid welding (HYBW) has been investigated for improving manufacture efficiency. By supplying deposit metal by arc welding, the gap control of HYBW is expected to be easier than that of LBW without deposit metal.
The heat input characteristics of LBW are largely different from those of existing arc welding such as heat energy, bead width, penetration depth and so on. Furthermore, those of HYBW with dual heat source differ from those of welding by using only laser or arc.
On the other hand, in welding of high strength steel, the phase transformation in the cooling process largely affects the generation of welding distortion and residual stress [2] .
Concerning to this, a series of welding experiments has been conducted so as to elucidate residual stress generated by arc welding on high strength steel (HT780). The experiment has been simulated by 3D thermal elasticplastic analysis based on FEM (Finite Element Method). In the analysis, the mechanical properties of the high strength steel were idealized by considering the phase transformation. As a result, the validity of simulation by FEM was verified for predicting the welding distortion and residual stress [1] [3] [4] .
By the way, from the viewpoints of both the welding process and the phase transformation, it is unknown how distortion and residual stress are generated by LBW and HYBW on high strength steel.
In this paper, a series of welding experiments on high strength steel (HT780) by LBW and HYBW is performed. And then, the experiment is simulated by FEM of which the validity was verified by the previous researches [5] [6] . The effects of the phase transformation on the generation of welding distortion and residual stress of LBW and HYBW are elucidated. Moreover, the generality of the idealized mechanical properties with considering the phase transformation is verified.
2. Welding Experiment
2.1. Test Specimen
The shape and dimension of the specimen are shown in Figure 1.
In order to obtain distortion and residual stress generated by butt welding with high accuracy, it is necessary that a specimen is made so that a linear misalignment due to tack welding does not occur [6] . Therefore, onepass bead-on-plate welding is selected.
The material is a high strength steel of which the tensile strength is over 780 MPa (HT780). The thickness is 12 mm. Table 1 shows the chemical compositions and the mechanical properties of the material.
Table 2 shows the welding conditions of LBW and HYBW. In both processes, a fiber laser is used. In HYBW, CO2 MAG arc welding with 780 MPa class filler wire is also used.
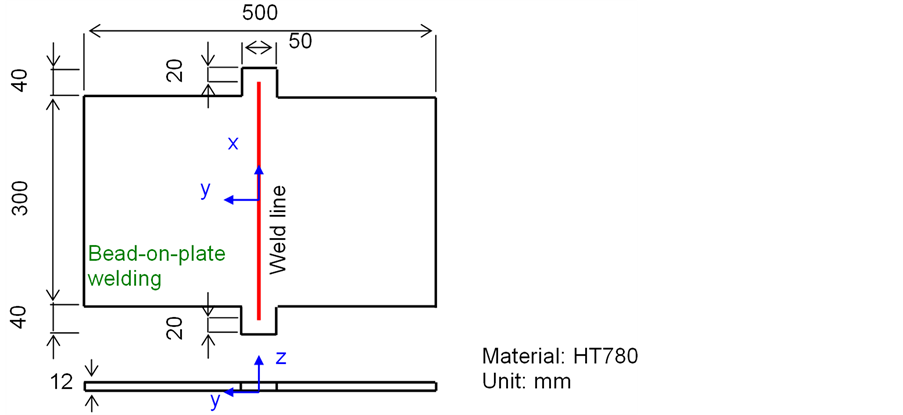
Figure 1. Test specimen.

Table 1. Chemical compositions and mechanical properties.
Table 2. Table type styles.
2.2. Experimental Procedure
During the welding, the temperature histories are measured by the thermo couples attached to 4 points (y = 15, 30, 50, 80 (mm)) of the upper side of the specimen (z = 12 (mm)) in the center of the welding direction (x = 15 (mm)).
After the welding, the penetration shapes are confirmed by obtaining the macrographs. These are also used for making grids in simulating the experiments by FEM.
The out-of-plane deformation is measured and the residual stress is obtained by a stress relaxation method in both LBW and HYBW specimens.
2.3. Results of Experiments
2.3.1. Macrographs
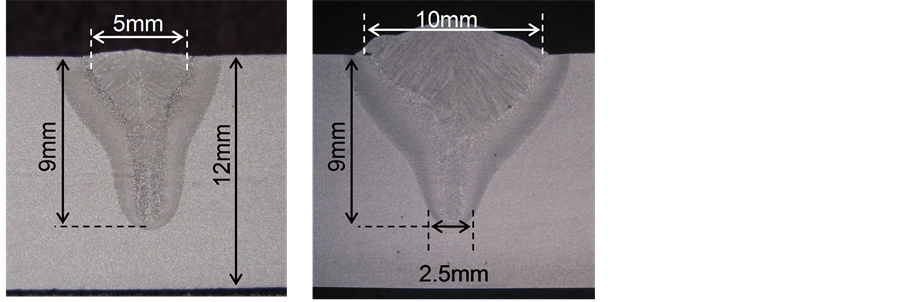
Figure 2 shows the examples of the macrographs of LBW and HYBW.
In LBW, the bead width is around 5 mm and the penetration depth is 9 mm. In HYBW, the bead width at the upper side is wide (around 10 mm) due to the supply of weld metal by arc welding. The penetration depth is almost the same as that by LBW.
2.3.2. Welding Distortion
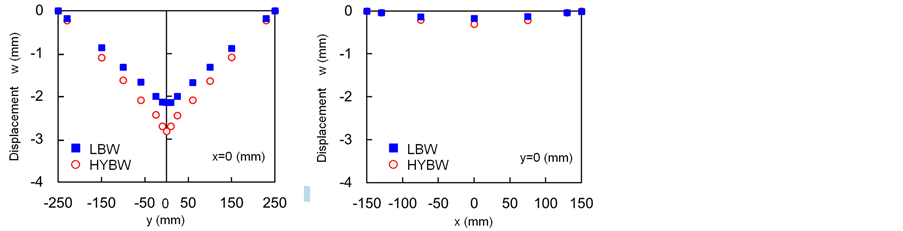
Figure 3 shows the welding out-of-plane deformation. The angular distortion of LBW is smaller than that of HYBW (Figure 3(a)). The longitudinal bending distortions of both LBW and HYBW are extremely small (Figure 3(b)).
2.3.3. Welding Residual Stress
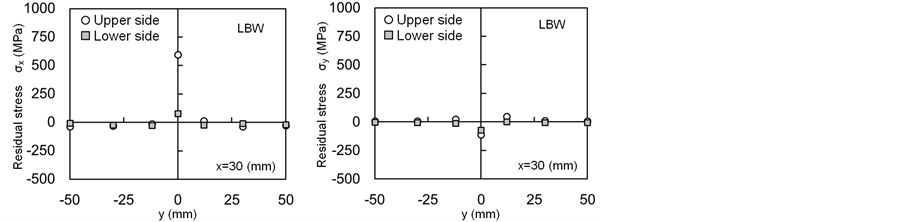
Figure 4 shows the welding residual stress.
The residual stress generated by LBW is noted.
The stress component along the weld line; σx by LBW (Figure 4(a)) is tensile but under the yield stress (813 MPa) in the weld metal on the upper side. The magnitude is around 600 MPa. On the lower side, the tensile stress around 80 MPa occurs. On the upper and lower sides, small compressive stress under 20 MPa occurs in the base metal. The stress component perpendicular to the weld line; σy by LBW (Figure 4(b)) is compressive around 90 MPa in the weld metal on both the upper and lower sides. Scarcely any stress occurs in the base metal.
In the same way, the residual stress generated by HYBW is noted. The stress component along the weld line; σx by HYBW (Figure 4(c)) is almost the same as that of LBW in the weld metal on the upper side. That is tensile and the magnitude is around 600 MPa. The region in which the tensile stress occurs is wider than that of LBW. On the lower side, the tensile stress around 300 MPa occurs, which is larger than that of LBW because the total heat input of HYBW is larger than that of LBW. The compressive stress in the base metal on the upper and lower sides is small as well as that of LBW. The stress component perpendicular to the weld line; σy by HYBW (Figure 4(d)) is tensile from 100 to 150 MPa in the weld metal on the upper side. That on the lower side is around 70 MPa. The stress in the base metal is small as well as that of LBW.
 (a) (b)
Figure 2. Macrograph. (a) LBW; (b) HYBW.
 (a) (b)
Figure 3. Welding out-of-displacements generated by LBW and HYBW. (a) Angular distortion; (b) Longitudinal bending distortion.
3. Idealization of Mechanical Properties
For simulating the welding on high strength steel, idealized mechanical properties considering the phase transformation in the cooling process are used. Here, the idealization of mechanical properties in the phase transformation range in the cooling process proposed by the author is explained. The details of idealization have been shown in the references [3] [4] .
The starting and finishing temperatures of phase transformation in the cooling process; Ms and Mf, were measured by Formastor test with changing the cooling rates (40, 100, 150 degrees Celsius/s). Figure 5 shows the result in the case that the cooling rate is 100 degrees Celsius/s. The variations of them were within 20 degrees Celsius in the three cases of cooling rates.
The averages of them were adopted, i.e., Ms was 441 degrees Celsius and Mf was 324 degrees Celsius. The range between them was defined as the phase transformation range.
The average of thermal expansion coefficient; α, was −22 × 10−6 per degrees Celsius in the phase transformation range. This was uniformly used in that range.
A series of tensile tests at high temperature was carried out. Specimens were heated up to 1250 degrees Celsius and the temperature was kept in some seconds. After cooling the specimens to the test temperatures, the tensile tests were carried out. Although the cooling rates were changed (40, 100, 150 degrees Celsius/s), it was confirmed that the effect of cooling rate on the mechanical properties was small.
As an example of the results of the tensile tests, temperature dependencies of Young’s modulus are shown in Figure 6. The above-mentioned transformation expansion occurs in the phase transformation range and it is known that transformation superplasticity also occurs in this range. It means the phenomenon that strength is remarkably lowered and extraordinary ductility is observed when the phase transformation occurs and progresses [2] . Therefore, the yield stress and Young’s modulus in the phase transformation range cannot be identified because the strain due to loading and that due to the transformation expansion and the transformation superplasticity cannot be separated.
 (a)
(a)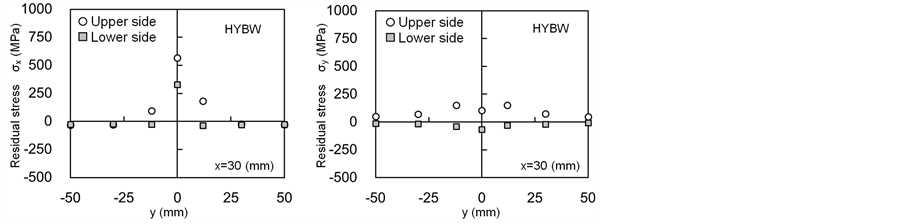 (b)
(b)
Figure 4. Distributions of residual stress generated by LBW and HYBW. (a) Stress component, σx by LBW; (b) Stress component, σy by LBW; (c) Stress component, σx by HYBW; (d) Stress component, σy by HYBW.
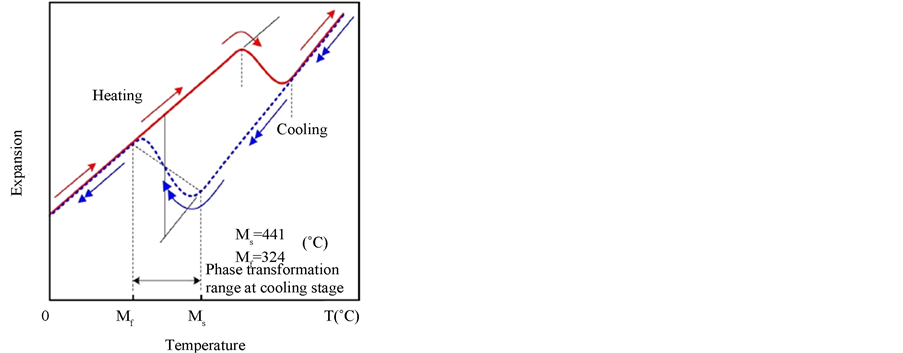
Figure 5. Expansion-temperature diagram.
In simulating the experiment by the thermal elastic-plastic analysis, the three types of idealized mechanical properties as shown in Figure 7 are used.
1) Model A: The phase transformation is not considered. That is, the mechanical properties in the heating process are also used in the cooling process.
2) Model B: Only the transformation expansion is considered by using the negative value of the thermal expansion coefficient; α in the phase transformation range is used. However, the yield stress; σy and Young’s modulus; E are the same in the heating and cooling processes.
3) Model C: Not only the transformation expansion but also the transformation superplasticity are considered. Although the thermal expansion coefficient; α and the yield stress; σy are the same as those in Model B, Young’s modulus; E between Ms and Mf, is idealized with considering the extraordinary ductility due to the transformation superplasticity. That is, Young’s modulus; E at Ms is lowered around zero and it is linearly recovered up to Mf in the cooling process.
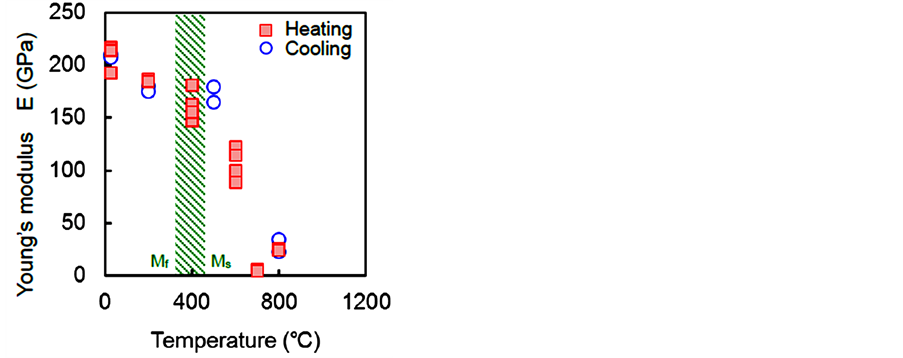
Figure 6. Temperature dependencies of Young’s modulus.
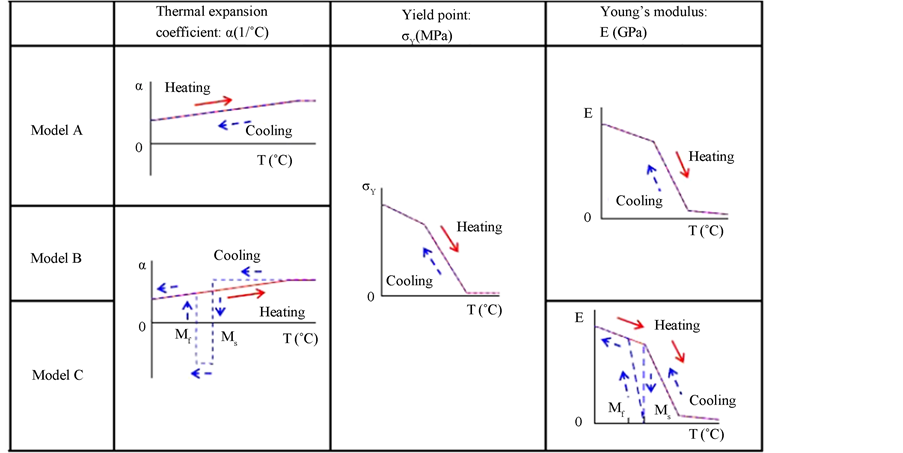
Figure 7. Idealization of mechanical properties in phase transformation range at cooling stage.
In the thermal elastic-plastic analysis described below, these mechanical properties are used in the cooling process in the elements of which the temperature exceeds the A1 transformation temperature (around 720 degrees Celsius) in the heating process, that is, the weld metal and heat affected zone (HAZ). In the elements except them, the mechanical properties in the heating process are also used in the cooling process.
4. Simulation by 3D Thermal Elastic-Plastic Analysis
4.1. Model for Simulation
Figure 8 shows the models for simulation by 3D thermal elastic-plastic analysis.
The isoparametric solid elements with 8 nodes are used. The half model is adopted. The heat input elements are decided by referring the macrographs [6] .
In the case of LBW model, the heat energy by laser is given into the penetration shape. On the other hand, in the case of HYBW model, the penetration shapes by laser and arc are separated referring to the macrograph of LBW (Figure 2(a)). In each part, the magnitude of heat energy by laser (QL) and arc (QA) are given respectively.
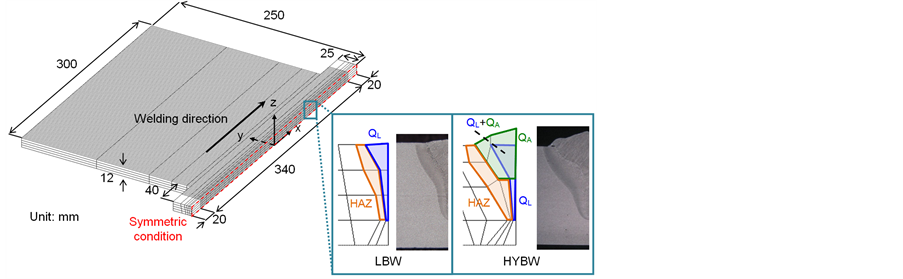
Figure 8. Model for thermal elastic-plastic analysis.
4.2. Results of Analysis
4.2.1. Temperature Histories
The non-steady heat conductivity analyses are carried out on LBW and HYBW models.
Figure 9 shows the temperature histories. They are measured on the upper side at the cross-section of x = 15 (mm). The distances from the weld line (y) are 15 30, 50 and 80 (mm). The symbols represent the results obtained by the experiment and the lines represent those obtained by the analysis.
The temperature histories obtained by the analysis are successfully agreed with those by the experiments in LBW and HYBW.
It can be confirmed that the maximum temperatures in each measured point of HYBW are higher than those of LBW due to the difference of the total heat input between LBW and HYBW.
4.2.2. Welding Distortion
The thermal elastic-plastic analysis is carried out with using the temperature histories obtained by the non-steady heat conductivity analyses.
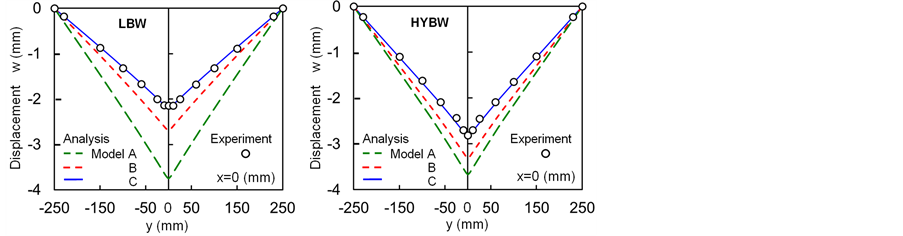
Figure 10 shows the welding out-of-plane distortion obtained by the experiment and the analysis.
Here, only the angular distortion is noted because the longitudinal bending distortion is too small to discuss the meaning of the results of the analysis.
In both cases of LBW (Figure 10(a)) and HYBW (Figure 10(b)), the distortions of Model A (green broken lines), in which both the transformation expansion and the transformation superplasticity are not considered, are extremely larger than the experimental results (circular symbols).
Although those of Model B (red dotted lines), in which only the transformation expansion is considered, are smaller than those of Model A, they are larger than the experimental results.
The distortions of Model C (blue solid lines) agree with the experimental results in which both the transformation expansion and the transformation superplasticity are considered.
The results indicate that the phase transformation in the cooling process largely affects and controls the welding distortion. The effects are caused by not only the transformation expansion but also the transformation superplasticity.
4.2.3. Welding Residual Stress
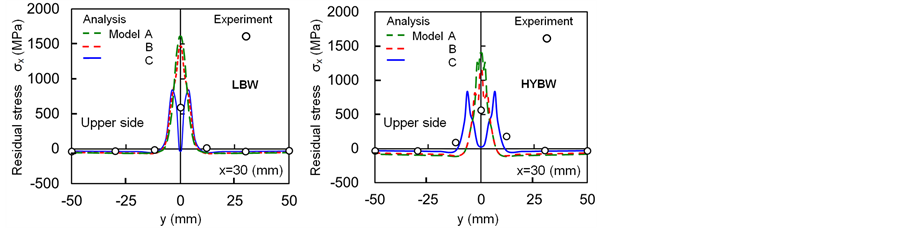
Figure 11 shows the distribution of residual stress obtained by the experiment and the analysis.
Here, only the stress component along the weld line; σx on the upper side is noted because the effect of the phase transformation on it is the largest in all stress components on the upper and lower sides.
In both cases of LBW (Figure 11(a)) and HYBW (Figure 11(b)), the residual stress of Model A (green broken lines), in which both the transformation expansion and the transformation superplasticity are not considered, and Model B (red dotted lines), in which only the transformation expansion is considered, are extremely large tension in the weld metal. That of Model C (blue solid lines), in which both the transformation expansion and the transformation superplasticity are considered, is drastically changed from tensile yield stress to zero in the narrow region of the weld metal. This is because the phase transformation, i.e., the tensile stress generated in the cooling process is released in the phase transformation range [4] .
 (a) (b)
Figure 9. Temperature histories obtained by experiment and analysis. (a) Temperature histories of LBW; (b) Temperature histories of HYBW.
 (a) (b)
Figure 10. Welding out-of-plane displacements obtained by experiment and analysis. (a) Angular distortion of LBW; (b) Angular distortion of HYBW.
 (a) (b)
Figure 11. Distributions of residual stress obtained by experiments and analysis. (a) Stress component, σx by LBW; (b) Stress component, σx by HYBW.
Although the experimental result in the weld metal is only one, the magnitude is smaller than the tensile yield stress. By considering the accuracy of the stress relaxation method, the analysis results of Model C simulate the experimental results.
When noting the results of Model C, the region in which the phase transformation affects the distribution of the residual stress of HYBW is wider than that of LBW. The reason is that the total heat input of HYBW is larger than that of LBW.
In any case, the phase transformation in the cooling process largely affects the generation of the residual stress as well as the welding distortion.
From the view point of both the welding distortion and residual stress, the validity of idealizing the mechanical properties with considering the phase transformation could be verified. The generality could also be verified because the experimental results of LBW and HYBW were simulated by the analyses with using these idealized mechanical properties.
5. Conclusions
In order to investigate the effects of the phase transformation on the generation of welding distortion and residual stress of LBW and HYBW, the experiment was carried out.
1) Welding distortion of LBW was smaller than that of HYBW because the total heat input of HYBW with dual heat source was larger than that of LBW.
2) In both cases of LBW and HYBW, the welding residual stress σx (component along the weld line) generated in the welds was tensile but smaller than the yield strength in the weld metal.
Then, the experiments were simulated by the 3D thermal elastic-plastic analyses based on FEM with using the idealized mechanical properties considering the phase transformation in the cooling process.
3) The experimental results could be simulated with high accuracy by the analyses in both cases of LBW and HYBW. That is, the generality of the idealized mechanical properties with considering the phase transformation could be verified. It meant that FEM simulation was valid for predicting the welding distortion and residual stress generated in high strength steel by LBW and HYBW.
4) It was confirmed that the phase transformation in the cooling process largely affected and controlled welding distortion. The effects were caused by not only the transformation expansion but also the transformation superplasticity.
5) Tensile residual stress generated in the cooling process was released by the phase transformation. The effects could be confirmed in both LBW and HYBW. However, the region in which the phase transformation affected on residual stress of HYBW was wider than that of LBW due to the difference of the magnitude of the heat input.
6) The effects of the phase transformation on the generation of welding distortion and residual stress were the same in both cases of LBW and HYBW even though the characteristics of the heat input were different from each other.
References
- Inose, K., Lee, J.-Y., Nakanishi, Y. and Kim, Y.-C. (2008) Characteristics of Welding Distortion/Residual Stress Generated by Fillet Welding with Laser Beam and Verification of Generality of Its High Accurate Prediction. Quarterly Journal of the Japan Welding Society, 26, 61-66. (in Japanese)
- John, S.V. (2001) Superplasticity: Mechanisms and Application. Journal of the Minerals, Metals and Materials Society, 53, 22.
- Kim, Y.-C., Hirohata, M. and Hageyama, Y. (2009) Modeling of Phase Transformation in Cooling Process and Verification of Its Validity. Conference on High Strength Steel for Hydropower Plants, Takasaki, 20-22 July 2009, 15.1- 15.4.
- Kim, Y.-C., Hirohata, M. and Inose, K. (2012) Effects of Phase Transformation on Distortion and Residual Stress Generated by LBW of High Strength Steel. Welding in the World, 56, 64-70.
- Kim, Y.-C., Hirohata, M. and Inose, K. (2011) Modeling of Laser-Arc Hybrid Welding Considered Phase Transformation. 64th Annual Assembly of International Institute of Welding (IIW), Chennai, 17-22 July 2011, XV-1380-11.
- Kim, Y.-C., Lee, J.-Y. and Inose, K. (2010) Determination of Dominant Factors in High Accuracy Prediction of Welding Distortion. Welding in the World, 54, 234-240.
NOTES

*Corresponding author.