Open Journal of Radiology
Vol.3 No.2(2013), Article ID:33156,7 pages DOI:10.4236/ojrad.2013.32010
Evaluation of the Optimal Image Reconstruction Interval for Noninvasive Coronary 64-Slice Computed Tomography Venography
1Division of Radiology, Department of Pathophysiological Therapeutic Science, Faculty of Medicine, Tottori University, Yonago City, Japan
2Division of Cardiology, Sanin Rosai Hospital, Yonago City, Japan
3Division of Radiology, Tottori Prefecture Kousei Hospital, Kurayoshi City, Japan
Email: yasuohta@med.tottori-u.ac.jp
Copyright © 2013 Yasutoshi Ohta et al. This is an open access article distributed under the Creative Commons Attribution License, which permits unrestricted use, distribution, and reproduction in any medium, provided the original work is properly cited.
Received March 22, 2013; revised April 22, 2013; accepted April 30, 2013
Keywords: CT; Coronary; Vein; Reconstruction; Styling
ABSTRACT
Objective: We investigated the appropriate reconstruction interval required to generate optimal quality images of the coronary veins and to evaluate the size of each vein at the systolic and diastolic phases using coronary computed tomography (CT) venography. Methods: Coronary CT venograms obtained from 30 patients using 64-slice CT were reconstructed at 0% to 90% of the cardiac cycle in 10% increments. Two radiologists assessed the image quality of the anterior interventricular vein (AIV), the great cardiac vein (GCV), the posterior vein of the left ventricle (PVLV), the posterior interventricular vein (PIV), the coronary sinus (CS) and the small cardiac vein (SCV). We determined the sizes of measurable CS (n = 16) and GCV (n = 12) at the end systolic and mid diastolic phases. Results: The most appropriate reconstruction point for all coronary veins turned out to be at the mid-diastolic phase. The size of the CS and GCV was greater at a 30% than that at a 70% R-R interval (p < 0.01). Conclusions: Image quality was optimal at the mid-diastolic phase for each coronary vein, but the sizes of the coronary veins varied during the cardiac cycle. The cardiac cycle must be considered when measuring the sizes of cardiac veins.
1. Introduction
Successful percutaneous procedures such as biventricular pacing [1,2], catheter ablation [2,3], cellular cardiomyoplasty [4], and percutaneous mitral valve annuloplasty [5] require considerable understanding of the cardiac veins. Balloon-occlusion coronary sinus (CS) angiography is a popular method of visualizing the coronary veins, but this method is technically challenging [6], and it does not provide information on relationships between cardiac veins and other cardiac structures. Multidetector row computed tomography (MDCT) with retrospective electrocardiogram (ECG)-gating and intravenous administration of contrast medium provides accurate images of cardiac structures with high spatial resolution less invasive. Such measurement of the coronary venous system helps plan preoperatively for several procedures mentioned above [5,7-10].
ECG-gated MDCT images are generally reconstructed at a point between end systole and mid diastole that represents minimal cardiac motion. However, little has been reported about image quality and reconstruction intervals of coronary veins using MDCT [11,12]. In addition, the size of the coronary sinus differs during the cardiac cycle, and coronary veins have not been numerically compared among the cardiac cycle using MDCT.
Our aims of this study are to investigate which reconstruction interval is required to generate optimal quality images of the coronary veins and to evaluate the sizes of coronary veins at the systolic and diastolic phases.
2. Materials and Methods
2.1. Study Population
We retrospectively reviewed data from consecutive 30 patients (14 males and 16 females; mean age, 67 years; age range, 52 - 86 years) who had undergone MDCT to evaluate the coronary arteries. Patients had atypical chest pain combined with a high risk of coronary artery disease.
The exclusion criteria comprised an irregular heart rate, allergy to contrast medium containing iodine, renal insufficiency (estimated glomerular filtration rate: eGFR < 30 mL/min/1.73 m2), pregnancy, hemodynamic instability, previous bypass surgery, and/or contrast density in the coronary sinus below 150 Hounsfield units (HU). None of the patients corresponded with these criteria.
Our institutional ethics committee approved this retrospective study; written, informed consent from patients was not required.
2.2. Patient Preparation
Patients who were not prescribed with beta-blocker drugs orally received 20 mg of metoprolol for heart rates over 70 beats per minutes one hour before MDCT imaging. Sublingual nitroglycerin was given to all patients before image acquisition.
2.3. CT Protocol
All scans were acquired in the craniocaudal direction using a 64-slice CT scanner (Aquilion 64, Toshiba, Otawara, Japan) during a single breath-hold. A bolus of non-ionic iodinated contrast agent (Iohexol, Omnipaque 350 mgI/ml, Tokyo, Japan) was injected at a rate of 0.06 ml/kg/sec for 13 seconds via a 20-gauge catheter placed in the right antecubital vein with 25 ml of saline chaser using a dual head power injector (DualShot, Nemoto, Japan). The scanning delay was controlled by bolus tracking (SureStart, Toshiba, Japan) with a region of interest placed in the aortic root. Data acquisition was started 6 seconds after CT attenuation reached a threshold of 120 HU from the baseline.
Data were acquired in the craniocaudal direction under the following conditions: detector collimation, 0.5 mm (64; gantry rotation time, 330 millisecond; tube voltage, 120 kV; tube current, 500 mAs. ECG was digitally recorded during data acquisition and stored with unprocessed CT datasets. Patients who were not prescribed with beta-blocker drugs orally received 20 mg of metoprolol for heart rates over 70 beats per minutes one hour before MDCT imaging. Sublingual nitroglycerin was given to all patients before image acquisition.
2.4. CT Protocol
Datasets were reconstructed in 10% steps from 0% to 90% of the R-R interval using retrospective ECG gating with a slice thickness of 0.5 mm. We used a muticycle recon-struction algorithm that provided heart rate-dependent temporal resolution between 89.2 and 175.0 millisecond from a 330 millisecond gantry rotation. All reconstructed images were transferred to a separate workstation (Zio-station, Amin, Japan).
2.5. Image Analysis
Two independent experienced cardiac radiologists (Y.O and S.F) evaluated the reconstructed data. The anterior interventricular vein (AIV), great cardiac vein (GCV), posterior interventricular vein (PIV), and small cardiac vein (SCV), as well as the posterior vein of the left ventricle (PVLV) and the posterior coronary sinus (CS), were evaluated from volume-rendered images (Figure 1).
Each cardiac vein in all 10 data sets from 0% to 90% of the R-R interval was evaluated in three orthogonal planes using multiplanar reformatting by both readers with regard to the presence of motion artifacts. Image quality was assessed using the described confidence scale of 5, no motion artifacts; 4) minor artifacts (mild blurring); 3) moderate artifacts (moderate artifacts without discontinuity; 2) severe artifacts (doubling or discontinuity in the course of the vein; 1) nonvisible (unable to differentiate target vein from other veins or nonexistent) [13,14]. The score for each vessel was then determined by consensus. A score of 3 was considered diagnostic in terms of image quality for clinical diagnostic purposes. Likewise, scores of 4 or 5 were considered appropriate for measuring the sizes of veins. Figure 2 shows examples of image grading.
We measured the cross-sectional area of the CS and the diameter of the GCV, both of which were measured at end-systolic (30%) and mid-diastolic (70%) phases of the R-R interval. Cross-sections of the CS are not circular, so we measured cross-sectional areas of this vessel [5,8].
2.6. Statistical Analysis
Data were statistically analyzed using SPSS software version 17.0 (SPSS, Chicago, IL, USA). Data are ex-
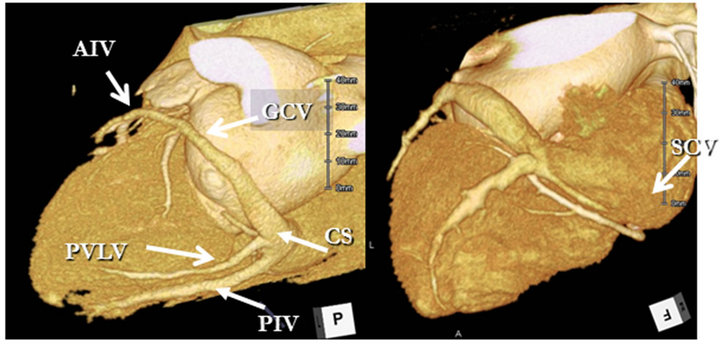
Figure 1. Coronary CT venogram of a representative case. CS: Coronary sinus; PIV: Posterior interventricular vein; PVLV: Posterior vein of left ventricle; GCV: Great cardiac vein; AIV: Anterior interventricular vein; SCV: Small cardiac vein.
pressed as mean ± standard deviation for continuous variables and as frequencies for categorical variables. We analyzed 300 sets of CT data acquired from coronary veins (10 per patient). Analyses proceeded at the pervessel level with seven coronary veins for each of the 30 patients, resulting in 210 vessels for each reconstructtion and 10 reconstruction intervals for a total of 2100 vessels.
The null hypothesis that not all ratings for reconstructtions have the same mean was tested using the multivariate analysis of variance for related multiple repeated measurements (ANOVA). Multiple pairwise comparesons of means of related samples were assessed using the Scheffé test.
A P value of <0.05 indicated a statistically significant difference. The sizes of coronary veins were compared using the Wilcoxon signed-ranks test and a P value of <0.01 indicated a statistically significant difference.
3. Results
Table 1 summarizes the patients’ characteristics and scan

Figure 2. Multiplanar reformatting image of CT coronary venograms show proximal part of great cardiac vein (arrows); each illustrates different score of image quality. (a) Image shows vessel structure is not visible (score 1); (b) Image shows doubling and discontinuity in course of vessel (score 2); (c) Image shows moderate blurring without discontinuity (score 3); (d) Image shows mild blurring of vascular margin (score 4); (e) Image shows no motion artifact (score 5).
demographics. None of the patients had prior cardiac events. The mean body mass index was 22 ± 3 (range 14.7 - 30.8) kg/m2 and 21 (70%, 21 of 30) of the patients were used beta-blockers. The mean heart rate during scanning was 65 ± 13 (range 50 - 100) beats/min. Scans and bolus-timing procedures were successfully completed in all patients. None of the patients had ectopic beats during image acquisition. The scan delay was 23.3 ± 2.5 (range 20 - 29) seconds and the mean scan duration was 7.6 ± 1.1 (range 4 - 10) seconds.
3.1. Image Quality of Coronary Veins
We evaluated 2100 vessels in the 30 patients. The image quality was highest at the mid-diastolic phase in all coronary veins (Table 2). A second image quality peak appeared at the end-systolic phase. Image reconstruction intervals at 30%, 40%, 60%, 70%, and 80% of the cardiac cycle did not significantly differ. Except for the
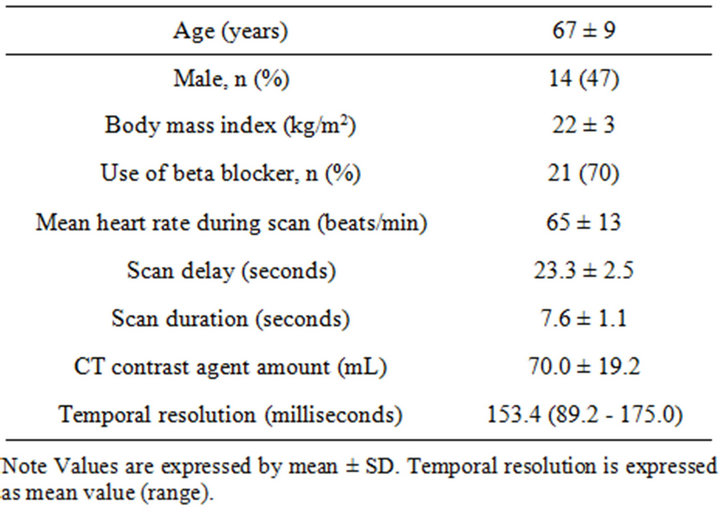
Table 1. Patient and CT characteristics (n = 30).
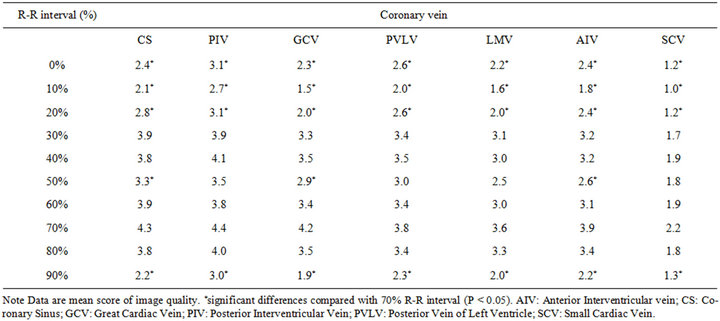
Table 2. Mean score of image quality of the coronary veins for all patients.
SCV, the diagnostic image quality (i.e., score 3 - 5) of all coronary veins was found at 30%, 40%, 60%, 70%, and 80%. The highest score for the SCV was 2.2. The image quality of all veins was significantly lower at 0%, 10%, 20% and 90% reconstruction intervals than that at 70% (p < 0.05) (Table 2). In addition, we could not identify the LMV and AIV in one patient and the SCV in 9 patients.
As a result, scores were of diagnostic image quality in 85.2% (179/210) of all coronary veins and in 91.1% (164/180) of all except the SCV at a 70% R-R interval. Image scores were measurable (scores of 4 or 5) in 70.0% (147/210) of all veins and in 80.0% (144/180) of all veins except the SCV, respectively (Table 3).
3.2. Size of Coronary Veins
We measured the cross-sectional area of 16 CSs in which scores were measurable at both 30% and 70% R-R intervals. The mean area was significantly larger at the 30% (49.8 ± 32.3 mm2) than at the 70% (32.1 ± 23.5 mm2) R-R interval (Figure 3). The mean area in two CSs was smaller or similarly sizes at a 30% R-R interval. These CSs were larger at a 40% than at a 70% R-R interval. Scores for 12 GCVs were measurable at both 30% and 70% R-R intervals, and the diameter was significantly larger at 30% (5.4 ± 1.2 mm) than at 70% (3.9 ± 1.1 mm) (Figure 3). All vessels were larger at a 30% than at a 70% R-R interval. Figure 4 shows a representative case.
4. Discussion
Coronary CT angiography has been used to noninva-
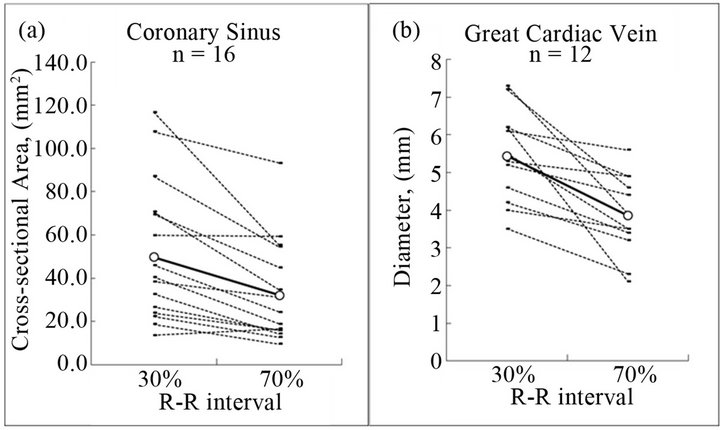
Figure 3. Comparison of the size of the coronary sinus (CS) and great cardiac vein (GCV) between 30% and 70% R-R interval. The mean size of the CS (a) and GCV (b) at the 30% of R-R interval is significantly larger than that of 70%, CS (49.8 ± 32.3 vs. 32.1 ± 23.5, p < 0.01), GCV (5.4 ± 1.2 vs. 3.9 ± 1.1, p < 0.01). White dot expresses mean value.
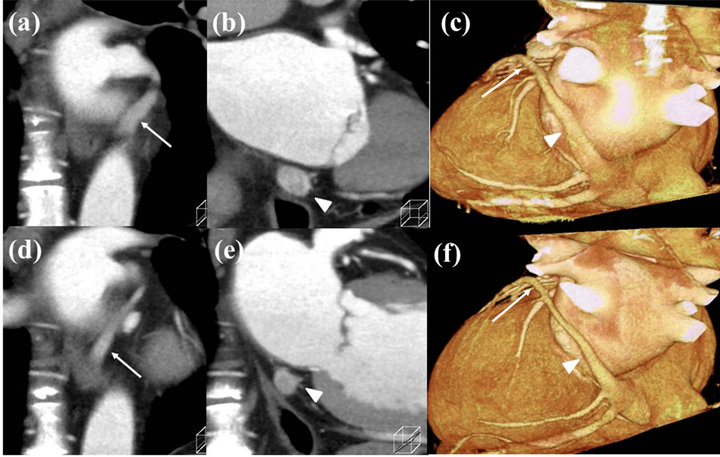
Figure 4. Coronal images of the coronary sinus (CS) and the great cardiac vein (GCV) reconstructed at 30% ((a)-(c)) and 70% ((d)-(f)) of R-R intervals. GCV (arrow) and CS (arrowhead) at 30% are larger than 70%.

Table 3. Percent of coronary veins with excellent, good to excellent, or acceptable image quality of all patients include SCV, and without SCV according to the reconstruction interval.
sively visualize coronary artery stenosis by creating highquality images, while coronary veins have not been fully evaluated to date using MDCT. Two important findings were generated from this study. First, the image quality of each coronary vein was optimal at the mid-diastolic phase. Second, the sizes of the CS and GCV varied and were significantly larger at the end-systolic than at the mid-diastolic phase.
4.1. Image Quality of Coronary Veins
An important step in obtaining quiescent cardiac images with MDCT is to use the most appropriate reconstruction interval when cardiac motion is minimal. A previous study of coronary arterial motion velocity showed that coronary artery movement reaches a nadir at the endsystolic phase and at the mid-diastolic phase [15]. Therefore, we preselect these phases as reconstruction intervals for coronary CT angiography. Wintersperger et al. found that the image quality of 64-section CT coronary angiography is optimal in diastole when patients have heart rates of <65 beats/min [16]. Husmann et al. reported that images of coronary arteries should be reconstructed at the end-systolic phase (30% - 40% of the R-R interval) when heart rates exceed 83 beats/min [17].
Only a few studies have investigated the relationship between image quality and reconstruction intervals of the cardiac veins on MDCT images [11,12]. The present study found that image scores were optimal at the middiastolic phase when the mean heart rate was 65 beats/ min. The image quality of coronary arteries is also usually optimal at the mid-diastolic phase and the coronary veins are located in the vicinity of them, which explains this concordance.
On the other hand, Mlynarski concluded that the optimal phase was 30% or 40% (end-systolic phase) for cardiac veins in 2-mm axial reconstruction using 64-slice MDCT at a mean heart rate of 62 beats/min [12]. A previous evaluation of three-dimensional volume-rendered images with 8-slice MDCT and a slice thickness of 1.25 mm, found that coronary veins were visually larger in reconstructed images acquired during systole than diastole. Therefore, the origin of tributary veins of the coronary veins was usually easier to detect from reconstructed images acquired during systole [11]. However, we found using 64-slice MDCT and a slice thickness of 0.5 mm that a second peak of image quality appeared between 30% and 40% of the R-R interval (end-systolic phase). The image quality was better at the mid-diastolic than at the end-systolic phase despite the vessels appearing larger at the end-systolic phase. We speculate that this difference in our findings was due to the slice thickness during reconstruction. With a slice thickness of 1.25 mm or 2 mm, misalignment artifact is more prominent than that of 0.5 mm on multiplanar reformation or 3Drendered images. In such conditions, visibility of vessels is better during larger state. Therefore, they detected tributary veins of coronary veins easier during systolic phase.
The ratio (%) of veins with images of diagnostic quality was similar between the end-systolic and mid-diastolic phases. However, reconstruction at the 70% R-R interval generated 80.0% with measureable scores, whereas the ratios of measureable scores at 30% and 40% of the R-R interval were 53.3% and 57.8%, respectively. Hence, the mid-diastolic phase should be applied primarily as a reconstruction interval when measuring cardiac veins using 64-slice MDCT. The most of current 64-slice MDCT has the capability to expose X-ray only certain cardiac phases to reduce radiation dose, in this case, mid-diastolic phase should be included as exposure phase.
The image quality of the SCV was lower than that of other veins. Images from 90.5% of identified SCV were of diagnostic quality, but scores were 1 (non-visible) in 30% of cases, which could be explained as follows. First, this study included some patients without small cardiac veins. Tschabitscher found that the small cardiac vein was missing from 75% of 145 adult hearts [18]. Why the rates of the presence of the small cardiac vein differ between the present and previous studies is obscure, but race features might be one explanation. Second, the diameter of the small cardiac vein was sometimes too small to identify at the spatial resolution of the MDCT.
4.2. Size of Coronary Veins
We measured the size of CS and GCV when scores were measurable at R-R intervals of both 30% and 70%. Because scores of very few other tributaries of coronary veins were measureable at both R-R intervals, we excluded them from measurement.
The CS and GCV were significantly larger at the endsystolic phase. This supports the findings of a previous study using MR imaging [19]. Some studies that have measured coronary vein tributaries apparently ignored the possibility of size variations during the cardiac cycle. Our results demonstrated that the coronary vessels differ in size between diastolic and systolic phases. Therefore, this should be recognized when measuring the sizes of cardiac veins and the coronary veins should always be measured at the same cardiac phase in patients.
4.3. Radiation Exposure
None of the patients had ECG modulation for reduction of radiation exposure. These examinations were performed in the early introduction of 64-row CT in our institution when we applied no radiation reduction technique. Nowadays, reduction of radiation exposure is important issue for cardiac CT [20]. ECG-based tube current modulation or prospective ECG triggering is one method [21,22]. In these methods, data loss or image degradation will occur in the phases not planned. From our results, we should choose mid-diastolic phase as prospective ECG triggering phase.
4.4. Study Limitations
First, none of the patients evaluated in this study had ventricular asynergy. Patients who need to evaluate coronary venous anatomy may suffer with impairment of ventricular motion caused by myocardial diseases. Second, contrast enhancement of coronary vein tributaries was sometimes low. The timing of the contrast bolus may become more important for CT venography using dual source CT and 256 - 320 slice MDCT that has a shorter scanning duration. Last, in our study, the gantry rotation time and mean temporal resolution of 64-slice CT were 330 and 153.4 milliseconds (range: 89.2 - 175.0 milliseconds), respectively. Although this temporal resolution is sufficient to obtain measurable image quality at either systolic or diastolic quiescence, it is insufficient to obtain measurable image quality at any reconstruction interval. Improving the temporal resolution would resolve this issue.
5. Conclusion
The image quality of 64-slice CT was optimal at the mid-diastolic phase for all coronary veins, but they vary in size during the cardiac cycle. Thus, we stress that the cardiac cycle must be considered when measuring cardiac veins.
REFERENCES
- S. Cazeau, C. Leclercq, T. Lavergne, S. Walker, C. Varma, et al., “Effects of Multisite Biventricular Pacing in Patients with Heart Failure and Intraventricular Conduction Delay,” The New England Journal of Medicine, Vol. 344, No. 12, 2001, pp. 873-880. doi:10.1056/NEJM200103223441202
- R. C. Hendel, M. R. Patel, C. M. Kramer, M. Poon, R. C. Hendel, et al., “ACCF/ACR/SCCT/SCMR/ASNC/ NASCI/ SCAI/SIR 2006 Appropriateness Criteria for Cardiac Computed Tomography and Cardiac Magnetic Resonance Imaging: A Report of the American College of Cardiology Foundation Quality Strategic Directions Committee Appropriateness Criteria Working Group, American College of Radiology, Society of Cardiovascular Computed Tomography, Society for Cardiovascular Magnetic Resonance, American Society of Nuclear Cardiology, North American Society for Cardiac Imaging, Society for Cardiovascular Angiography and Interventions, and Society of Interventional Radiology,” Journal of the American College of Cardiology, Vol. 48, No. 7, 2006, pp. 1475- 1497. doi:10.1016/j.jacc.2006.07.003
- C. Weiss, R. Cappato, S. Willems, T. Meinertz and K. H. Kuck, “Prospective Evaluation of the Coronary Sinus Anatomy in Patients Undergoing Electrophysiologic Study,” Clinical Cardiology, Vol. 22, No. 8, 1999, pp. 537-543. doi:10.1002/clc.4960220810
- C. A. Thompson, B. A. Nasseri, J. Makower, S. Houser, M. McGarry, et al., “Percutaneous Transvenous Cellular Cardiomyoplasty. A Novel Nonsurgical Approach for Myocardial Cell Transplantation,” Journal of the American College of Cardiology, Vol. 41, No. 11, 2003, pp. 1964-1971. doi:10.1016/S0735-1097(03)00397-8
- A. J. Choure, M. J. Garcia, B. Hesse, M. Sevensma, G. Maly, et al., “In Vivo Analysis of the Anatomical Relationship of Coronary Sinus to Mitral Annulus and Left Circumflex Coronary Artery Using Cardiac Multidetector Computed Tomography: Implications for Percutaneous Coronary Sinus Mitral Annuloplasty,” Journal of the American College of Cardiology, Vol. 48, No. 10, 2006, pp. 1938-1945. doi:10.1016/j.jacc.2006.07.043
- E. Meisel, D. Pfeiffer, L. Engelmann, J. Tebbenjohanns, B. Schubert, et al., “Investigation of Coronary Venous Anatomy by Retrograde Venography in Patients with Malignant Ventricular Tachycardia,” Circulation, Vol. 104, No. 4, 2001, pp. 442-447. doi:10.1161/hc2901.093145
- S. Abbara, R. C. Cury, K. Nieman, V. Reddy, F. Moselewski, et al., “Noninvasive Evaluation of Cardiac Veins with 16-MDCT Angiography,” American Journal of Roentgenology, Vol. 185, No. 4, 2005, pp. 1001-1006. doi:10.2214/AJR.04.1382
- M. R. Jongbloed, H. J. Lamb, J. J. Bax, J. D. Schuijf, A. de Roos, et al., “Noninvasive Visualization of the Cardiac Venous System Using Multislice Computed Tomography,” Journal of the American College of Cardiology, Vol. 45, No. 5, 2005, pp. 749-753. doi:10.1016/j.jacc.2004.11.035
- J. P. Singh, S. Houser, E. K. Heist and J. N. Ruskin, “The Coronary Venous Anatomy: A Segmental Approach to Aid Cardiac Resynchronization Therapy,” Journal of the American College of Cardiology, Vol. 46, No. 1, 2005, pp. 68-74. doi:10.1016/j.jacc.2005.04.017
- L. F. Tops, N. R. Van de Veire, J. D. Schuijf, A. de Roos, E. E. van der Wall, et al., “Noninvasive Evaluation of Coronary Sinus Anatomy and Its Relation to the Mitral Valve Annulus: Implications for Percutaneous Mitral Annuloplasty,” Circulation, Vol. 115, No. 11, 2007, pp. 1426- 1432. doi:10.1161/CIRCULATIONAHA.106.677880
- H. Tada, K. Kurosaki, S. Naito, K. Koyama, K. Itoi, et al., “Three-Dimensional Visualization of the Coronary Venous System Using Multidetector Row Computed Tomography,” Circulation Journal, Vol. 69, No. 2, 2005, pp. 165- 170. doi:10.1253/circj.69.165
- R. Mlynarski, M. Sosnowski, A. Wlodyka, K. Chromik, W. Kargul, et al., “Optimal Image Reconstruction Intervals for Noninvasive Visualization of the Cardiac Venous System with a 64-Slice Computed Tomography,” The International Journal of Cardiovascular Imaging, Vol. 25, No. 6, 2009, pp. 635-641. doi:10.1007/s10554-009-9463-0
- S. S. Shim, Y. Kim and S. M. Lim, “Improvement of Image Quality with Beta-Blocker Premedication on ECG-Gated 16-MDCT Coronary Angiography,” American Journal of Roentgenology, Vol. 184, No. 2, 2005, pp. 649-654. doi:10.2214/ajr.184.2.01840649
- S. Leschka, L. Husmann, L. M. Desbiolles, O. Gaemperli, T. Schepis, et al., “Optimal Image Reconstruction Intervals for Non-Invasive Coronary Angiography with 64- Slice CT,” European Radiology, Vol. 16, No. 9, 2006, pp. 1964-1972. doi:10.1007/s00330-006-0262-x
- S. Achenbach, D. Ropers, J. Holle, G. Muschiol, W. G. Daniel, et al., “In-Plane Coronary Arterial Motion Velocity: Measurement with Electron-Beam CT,” Radiology, Vol. 216, No. 2, 2000, pp. 457-463.
- B. J. Wintersperger, K. Nikolaou, F. von Ziegler, T. Johnson, C. Rist, et al., “Image Quality, Motion Artifacts, and Reconstruction Timing of 64-Slice Coronary Computed Tomography Angiography with 0.33-Second Rotation Speed,” Investigative Radiology, Vol. 41, No. 5, 2006, pp. 436-442. doi:10.1097/01.rli.0000202639.99949.c6
- L. Husmann, S. Leschka, L. Desbiolles, T. Schepis, O. Gaemperli, et al., “Coronary Artery Motion and Cardiac Phases: Dependency on Heart Rate—Implications for CT Image Reconstruction,” Radiology, Vol. 245, No. 2, 2007, pp. 567-576. doi:10.1148/radiol.2451061791
- M. Tschabitscher, “Anatomy of Coronay Veins,” SpringerVerlag, New York, 1984.
- R. Nezafat, Y. Han, D. C. Peters, D. A. Herzka, J. V. Wylie, et al., “Coronary Magnetic Resonance Vein Imaging: Imaging Contrast, Sequence, and Timing,” Magnetic Resonance in Medicine, Vol. 58, No. 6, 2007, pp. 1196-1206. doi:10.1002/mrm.21395
- A. J. Einstein, M. J. Henzlova and S. Rajagopalan, “Estimating Risk of Cancer Associated with Radiation Exposure from 64-Slice Computed Tomography Coronary Angiography,” The Journal of the American Medical Association, Vol. 298, No. 3, 2007, pp. 317-323. doi:10.1001/jama.298.3.317
- J. Hausleiter, T. Meyer, M. Hadamitzky, E. Huber, M. Zankl, et al., “Radiation Dose Estimates from Cardiac Multislice Computed Tomography in Daily Practice: Impact of Different Scanning Protocols on Effective Dose Estimates,” Circulation, Vol. 113, No. 10, 2006, pp. 1305- 1310. doi:10.1161/CIRCULATIONAHA.105.602490
- J. P. Earls, E. L. Berman, B. A. Urban, C. A. Curry, J. L. Lane, et al., “Prospectively Gated Transverse Coronary CT Angiography Versus Retrospectively Gated Helical Technique: Improved Image Quality and Reduced Radiation Dose,” Radiology, Vol. 246, No. 3, 2008, pp. 742- 753. doi:10.1148/radiol.2463070989