Journal of Power and Energy Engineering
Vol.03 No.01(2015), Article ID:53111,12 pages
10.4236/jpee.2015.31003
A Comprehensive Analysis of Plug in Hybrid Electric Vehicles to Commercial Campus (V2C)
Andrew D. Clarke, Elham B. Makram
Department of Electrical and Computer Engineering, Clemson University, Clemson, USA
Email: adclark@g.clemson.edu, makram@clemson.edu
Academic Editor: Elias K. Stefanakos, Electrical Engineering Department, University of South Florida, USA
Copyright © 2015 by authors and Scientific Research Publishing Inc.
This work is licensed under the Creative Commons Attribution International License (CC BY).
http://creativecommons.org/licenses/by/4.0/


Received 20 November 2014; revised 18 December 2014; accepted 30 December 2014
ABSTRACT
Vehicle to grid is an emerging technology that utilizes plug in hybrid electric vehicle batteries to benefit electric utilities during times when the vehicle is parked and connected to the electric grid. In its current form however, vehicle to grid implementation poses many challenges that may not be easily overcome and many existing studies neglect critical aspects such as battery cost or driv- ing profiles. The goal of this research is to ease some of these challenges by examining a vehicle to grid scenario on a university campus, as an example of a commercial campus, based on time of use electricity rates. An analysis of this scenario is conducted on a vehicle battery as well as a statio- nary battery for comparison. It is found that vehicle to campus and a stationary battery both have the potential to prove economical based on battery cost and electricity rates.
Keywords:
Electric Vehicles, Power Distribution, Economic Analysis, Vehicle to Building (V2B), Battery Storage

1. Introduction
Plug in hybrid electric vehicles (PHEVs) are becoming more prevalent. Many studies seek to examine possible services these vehicles may provide to electric utilities. In order to understand the implications of introducing PHEVs to a distribution system, one must first define what constitutes classification of a PHEV. Hybrid electric vehicles (HEVs) use both an internal combustion engine and an electric system usually consisting of a battery and a motor to meet the requirements of propulsion. A vehicle must meet the following three requirements beyond those of a typical HEV in order to be classified as a PHEV by the IEEE [1] .
1) A 4 kWh battery that is used for propulsion must be installed in the vehicle.
2) A connection to the electric grid must be present to recharge the battery.
3) A vehicle must be able to drive 10 or more miles solely using electric power.
Each PHEV used for the analysis presented in this paper meets these requirements with a battery capacity of 16.5 kWh and all electric range of 38 miles [2] . AC PHEV chargers are typically broken up into three categories. These categories are listed in [3] and summarized in Table 1. Based on the charging stations recommended for the PHEV used in this study by [4] , only Levels 1 and 2 chargers are considered. A shorter charge time for the PHEV used in this study is listed when a Level 2 charger is used [2] . It is assumed that most consumers will choose the faster charge time if available, so a maximum charge/discharge rate is chosen to correspond to a Level 2 charger.
One of the services that PHEVs may be able to provide to an electric utility is peak shaving through vehicle to grid (V2G). In V2G, PHEV batteries are charged during off peak energy usage times and discharged during peak energy usage. One method of implementing this type of scheme involves using time-of-use (TOU) rates. TOU rates charge more for energy used during peak usage periods than for energy used during off peak usage periods [5] . Using TOU rates in a V2G scheme, a PHEV owner would charge the vehicle battery during off peak pricing periods and discharge the battery back to the electric grid during peak pricing periods.
V2G schemes typically require a communication network to be installed to allow utilities to communicate with PHEV chargers. Also, adding PHEVs utilizing V2G to a radial distribution system that typically sees only unidirectional power flows may create bidirectional power flows on the system. Both the additional communication network and bidirectional power flows lead to a high cost associated with V2G [6] . Furthermore, PHEVs are only capable of supplying a small amount of power in comparison to the overall system load of a large utility. Due to these factors, using PHEVs for peak shaving through V2G will likely face many challenges. Some existing studies attempt to conduct an economic analysis of V2G, however they either do not consider actual vehicle driving cycle data, fail to include the costs of negative impacts on the battery, or are conducted on large scale systems where the implementation of V2G is expected to be slow to gain traction [6] - [8] . Also, studies fail to show the breakeven point for PHEV owners in terms of TOU rates.
This research aims to implement V2G on a university campus system or other large commercial campus, henceforth referred to as V2C. This type of system will alleviate some of these concerns while still allowing the potential for both the consumer and utility to benefit. In the system being studied, which is the Clemson Univer- sity distribution system, the campus is seen as a large net consumer by the electric utility, similar to a large commercial building. Therefore, a large number of vehicles can be connected before all of the campus loads would be supplied by sources other than the electric utility. This would eliminate the issue of two way power flows on the electric utility system caused by the campus or other large commercial building supplying power back to the electric utility. Also, by using TOU rates, a decentralized method of control is used to command ve- hicle charging and discharging in order to greatly reduce or eliminate the need for communication. The electric utility also benefits through a reduction of load power drawn by the university campus during peak energy usage times. The economic analysis on such a scheme is conducted to show at what point it becomes economically beneficial for PHEV owners to participate. An economic comparison with stationary battery energy storage is also conducted.
The structure of this paper is as follows: Section 2 contains details of spatial and temporal PHEV models used for this study; Section 3 contains specifics of the vehicle to campus algorithm; Section 4 has details and the results for the economic analysis; Section 5 shows the peak shaving impacts of the vehicle to campus algorithm; and Section 6 contains the final conclusion of this paper. Notation may be found at the end of the paper.

Table 1. PEV charging levels [3] .
2. Vehicle Spatial and Temporal Distributions
In order to complete an accurate analysis of V2C, the locations of PHEVs during different times of the day are needed. Both temporal and spatial distributions of PHEVs must be determined. The spatial distribution is used to determine how far a PHEV has traveled when it arrives on campus from home and how far it must travel to return home. The temporal distribution is used to determine what time PHEVs arrive on campus and what time they leave to return home. In order to develop accurate distributions, data from the 2009 National Household Travel Survey is used along with the distribution fitting command in MATLAB [9] . For the spatial distribution, the responses to how far a worker’s job is from home are used. These responses correspond to the variable DISTTOWK in [9] . Based on the responses, an exponential distribution with the probability density function shown in Figure 1 is chosen for the distance driven between work and home. The average distance driven be- tween work and home is determined to be 14.1 miles.
The times PHEVs arrive on campus as well as when they leave must also be approximated. For the temporal distribution of when vehicles arrive on campus, the responses to the end time of all trips with the destination of work are used. For the temporal distribution of when vehicles leave campus to return home, the responses corresponding to the start time of all trips with the destination of home are used. These responses correspond to the variables ENDTIME, STRTTIME, and WHYTO for the arrival time, leaving time, and purpose of the trip, respectively. Based on the responses, normal distributions with the probability density functions shown in Figure 2 are chosen for the arrival and departure times. The average arrival time of PHEVs on campus is determined to be 9:07 am and the average departure time of PHEVs from campus is determined to be 3:23 pm.

Figure 1. Spatial probability density function.

Figure 2. Temporal probability density function.
3. Vehicle to Campus Algorithm
In order to implement V2C, a decentralized algorithm is implemented. The algorithm requires the PHEV owner to estimate how far the vehicle will be driven after departure from campus and also input the time the PHEV will depart. The goal of the algorithm is to utilize V2C to supply as much energy as possible during the peak pricing period while also maintaining enough charge upon departure that the distance input by the PHEV owner can be traveled solely on electric power. The necessary state of charge (SOC) is calculated using the estimated distance input by the user as well as the 98 MPGe and 16.5 kWh battery capacity given in [2] . Any charging necessary is performed during off peak pricing if possible. The only time on peak charging would occur is the case where a vehicle is not connected long enough during off peak times to reach the necessary SOC required by the PHEV owner.
The algorithm attempts to charge the PHEV as much as possible before the on peak period, limited by a maximum charging rate of 7 kW, which is chosen based on a level 2 charger [3] . The algorithm also attempts to discharge the PHEV as much as possible during on peak periods, limited by maintaining enough energy in the battery at the time of departure and a maximum discharging rate of 7 kW. If the PHEV remains connected after the peak period ends, off peak charging is also allowed during this time. An SOC operating range of 10% - 89.2% is chosen based on 98 MPGe, 38 mile all electric range, and 16.5 kWh battery capacity [2] . An efficiency of 90% is assumed for both charging and discharging operations [8] . Charging and discharging rates are reduced from 7 kW wherever possible such that the rate is the lowest that will allow completion of the energy transfer in the allotted time.
For the economic analysis, it is assumed that the PHEV is driven the average of 14.1 miles to campus and arrives at 9:07 am. It is also assumed that the vehicle will be driven the average of 14.1 miles from campus to home upon departure at 3:23 pm. On peak pricing is assumed to start at 2:00 pm and to end at 8:00 pm [10] - [16] . Based on these parameters, the SOC profile of the PHEV battery while the vehicle is parked in campus is shown in Figure 3. The blue line in Figure 3 represents the energy stored in the PHEV battery over time, starting at the arrival time and ending at the departure time. The vertical red lines show the beginning and end of the on peak pricing period.
4. Economic Analysis
In order to fully examine the economic analysis of a V2C scheme, a comparison with a stationary battery that has the same capacity as the PHEV battery is conducted. The same SOC operating range and efficiency for the PHEV battery are also assumed for the stationary battery. Figure 4 shows the energy stored in the stationary battery throughout the day.
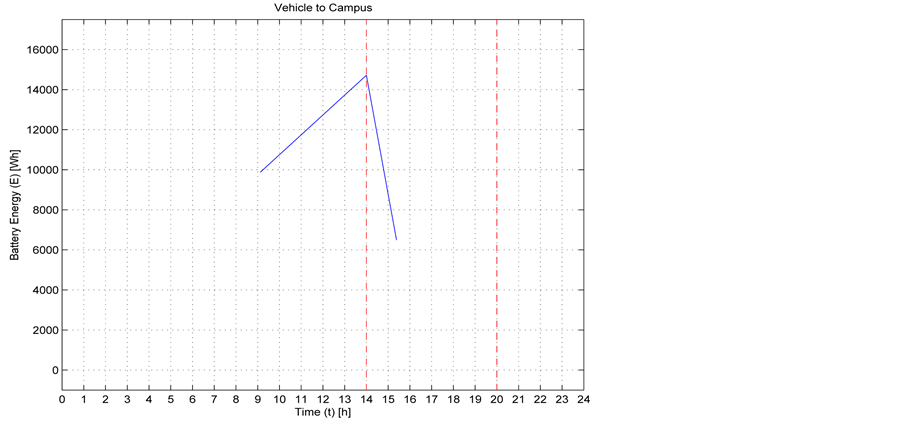
Figure 3. Energy profile of the PHEV battery throughout the day while parked on campus.

Figure 4. Energy profile of the stationary battery throughout the day.
To produce a meaningful comparison for V2C operation, a baseline cost for operating a PHEV without V2C must be considered. For the baseline, the cost of charging the PHEV only during off peak is considered. Also, only the energy necessary to drive to work and make the return trip home is necessary to consider as no other energy is depleted from the PHEV battery. Charging efficiency is also included in the calculation. The baseline cost is calculated using Equation (1). For operation without V2C, there is no accelerated degradation of the battery, so no additional cost to compensate for that is necessary.
 (1)
(1)
Whenever V2C is employed, an accelerated degradation of the PHEV battery occurs compared to without V2C due to the increased cycling of the battery. After repeated cycling, a battery loses some of its usable storage capacity. For this study, a cycle life of 2500 cycles was chosen based on [2] [8] . This must be accounted for in order to give PHEV owners an accurate estimate of whether or not it is economical to participate in V2C. This cost is accounted for using Equation (2). This compensates the PHEV owner for a partial cycling of the battery based on how much energy is discharged from the battery for V2C operations [8] .
 (2)
(2)
It is stated in [17] that the goal for battery price in PHEVs varies from $150 - $500 per kWh. For this study, three different battery costs are studied including the two extremes and one halfway between these estimates. These costs include $150 per kWh, which corresponds to a battery cost of $2475, $325 per kWh, which corresponds to a battery cost of $5362.50, and $500 per kWh, which corresponds to a battery cost of $8250.
The total cost of energy exchange during V2C is given by Equation (3). The total savings that are seen from using V2C are calculated using Equation (4).
 (3)
(3)
 (4)
(4)
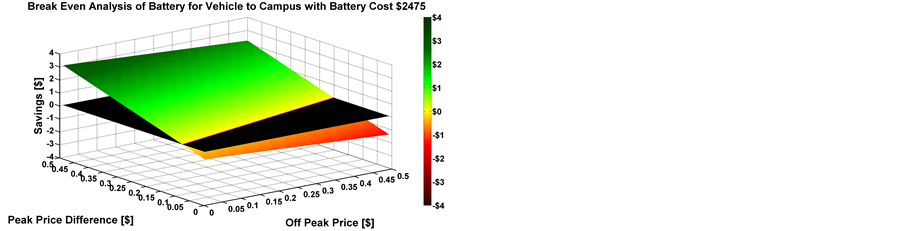
The results are shown in Figure 5 for the three battery costs. The axes show the off peak price, the price difference between peak and off peak prices, and the total savings. In Figure 5(a), Figure 5(c), and Figure 5(e) any points above the black surface represent an economic benefit from utilizing V2C while those below it represent a loss of money through utilizing V2C. Figure 5(b), Figure 5(d), and Figure 5(f) give an overhead view of these surfaces, where the magenta line represents the intersection with the black surface. All points above the line represent an economic benefit from utilizing V2C while those below it represent a loss of money through utilizing V2C.
It can be seen that as battery costs increase, the difference between peak and off peak price must increase in
 (a) (b)
 (c) (d)
 (e) (f)
Figure 5. Break even analysis of vehicle to campus using the average cycle. (a) Battery cost―$2475; (b) Battery cost―$2475―overhead view; (c) Battery cost―$5362.50; (d) Battery cost―$5362.50―overhead view; (e) Battery cost―$8250; (f) Battery cost― $8250―overhead view.
order to realize an economic benefit from V2C. In all cases however, an economic benefit is possible if the difference between peak price and off peak price is large enough. It can also be seen that at the high off peak prices, the difference between peak and off peak prices must be larger than the low off peak prices in order to see an economic benefit. This is due to the charging and discharging efficiencies, both of which are below 100%. A PHEV owner may have to pay for energy losses, in which case this must be included in the analysis for accuracy. At high off peak prices, the cost of energy losses is higher than during low off peak prices.
A similar economic analysis is conducted for a stationary battery. Figure 4 shows a stationary battery’s SOC profile and the cycle compensation is again given by Equation (2). In this case however, ED represents the full usable battery capacity, EB. For the stationary battery, the savings are calculated using Equation (5).
 (5)
(5)
The results of the economic analysis for the stationary battery can be found in Figure 6. Again, all points above the black surface or magenta line represent an economic benefit from utilizing stationary storage while those below represent a loss of money. It can be seen that the break even line for the PHEV battery and stationary battery is the same. This is due to using the same battery parameters for both comparisons. However, the amount of savings is different between the two analyses. This is due to the different charging and discharging profiles of the PHEV and stationary batteries.

 (a) (b)
 (c) (d)
 (e) (f)
Figure 6. Break even analysis of stationary battery to campus. (a) Battery cost―$2475; (b) Battery cost―$2475―over- head view; (c) Battery cost―$5362.50; (d) Battery cost―$5362.50―overhead view; (e) Battery cost ―$8250; (f) Battery cost―$8250―overhead view.
5. Peak Shaving Impacts
Based on the ability of V2C to prove profitable, it has been shown that V2C has the potential to benefit consumers without impacting required driving behavior. This section focuses on showing the benefit of V2C to the electric utility feeding campus. The V2C algorithm previously described works by charging PHEVs during off peak rate times and discharging them during peak rate times. The peak rate times correspond to the peak load values seen from campus loads. Figures 7-9 show the campus load profile on the 12.47 kV circuit for a spring, summer, and winter day based on a base case simulation, respectively. These load profiles do not include V2C or stationary battery energy storage. It can be seen that the peak load for the spring day occurs between 2 and 3 pm. For the summer day, the peak load also occurs between 2 and 3 pm. The winter day’s peak occurs between 12 and 1 pm. It can also be seen that the highest peak load occurs during the spring season.
In order to examine the impacts of adding PHEVs to the campus system while utilizing V2C, a total of 300 PHEVs are added in a total of 8 car parks around campus. The car parks are located based on currently available parking lots on campus. Six of the car parks contain thirty PHEV charging stations each, while the other two contain sixty PHEV charging stations each. The distance driven to campus, arrival time, and departure times are all chosen using random variables corresponding to the distributions described previously, with the constraint

Figure 7. Clemson University 12.47 kV system load―spring- base case.

Figure 8. Clemson University 12.47 kV system load―sum- mer-base case.
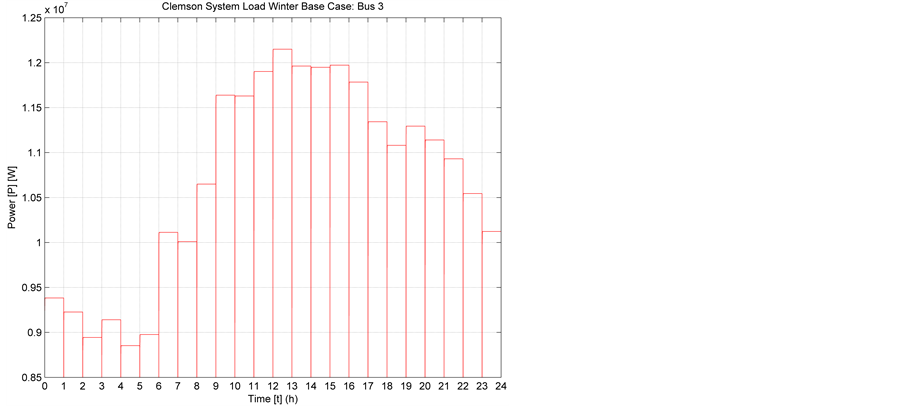
Figure 9. Clemson University 12.47 kV system load―winter-base case.
that departure time must be later than arrival time. Arrival and departure times are rounded to the nearest minute. Based on these parameters, the V2C algorithm is applied to each vehicle to determine the charge and discharge rates. In order to examine the maximum effects of peak shaving due to PHEVs, it is assumed for this section that the difference between on peak and off peak rates is high enough that V2C proves profitable. The charge and discharge rates from the V2C algorithm are then applied to the 300 PHEVs. Due to the arrival and departure times, not all PHEVs are present on campus during the peak rate period, meaning not all PHEVs participate in peak shaving. Based on the temporal distributions however, it can be seen that the majority of PHEVs that park on campus regularly will be present during the beginning of the peak rate period, with the availability decreasing as the time gets later.
Figures 10-12 show the campus 12.47 kV system load with PHEVs participating in V2C for a spring, summer, and winter day, respectively. It can be seen that the peak system load is reduced for both the spring and summer cases. For the winter case, the load is reduced during the utility peak pricing period, however this does

Figure 10. Clemson University 12.47 kV system load―spring-V2C.
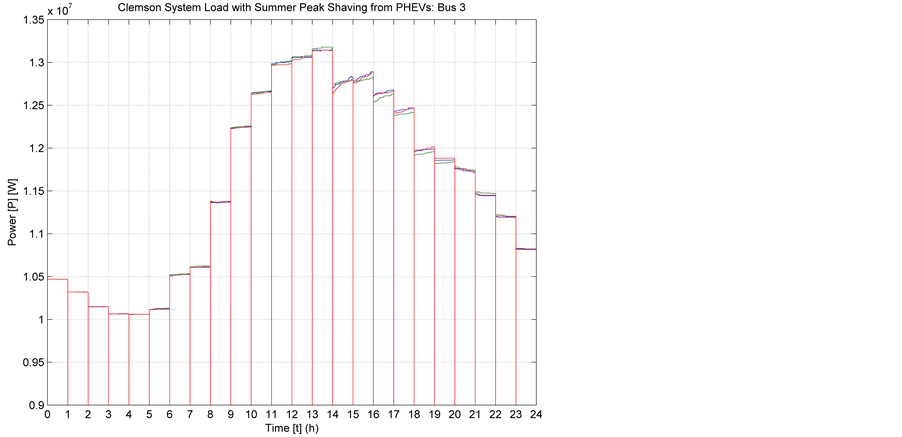
Figure 11. Clemson University 12.47 kV system load―summer-V2C.
not overlap with the system peak load, so the peak is not reduced. Due to the use of PHEVs in a V2C campus scenario, the electric utility providing electric power to campus can expect a significant reduction of campus load during the peak pricing periods. By drawing less energy during peak rate periods, the campus will also save money on the purchase of electricity.
In order to show the viability of using V2C as an acceptable source for peak shaving, a comparison with stationary battery energy storage is again conducted. In order to draw a meaningful comparison, each PHEV is replaced with an equivalent sized stationary battery of the same capacity at the same location. The profile of the stationary battery energy is shown in Figure 4. The load profile for the campus with stationary energy storage is shown in Figures 13-15 for a spring, summer, and winter day, respectively.

Figure 12. Clemson University 12.47 kV system load―winter-V2C.

Figure 13. Clemson University 12.47 kV system load―spring-stationary battery.

Figure 14. Clemson University 12.47 kV system load―summer-stationary battery.

Figure 15. Clemson University 12.47 kV system load―winter-stationary battery.
It can be seen that the peak shaving impacts of the stationary battery energy storage are similar to that of the PHEVs using V2C. The main difference is that more peak shaving occurs with the stationary battery energy storage than with PHEVs using V2C. This is especially apparent during the latter portion of the peak rate time. This is due to the disconnection of PHEVs based on the temporal distributions and the minimum SOC requirement placed on individual PHEVs by the spatial distribution.
6. Conclusion
An economic analysis and peak shaving analysis for both V2C and stationary storage are conducted. It is shown that V2C and stationary storage can both be cost effective and allow for peak shaving on a university campus. The cost effectiveness and the amount of savings are dependent on the battery cost and electricity pricing during both on and off peak times. Under the V2C scenario, the PHEV owner is left with enough energy to travel a desired distance solely under electric power while still participating in V2C. Implementation of V2C reduces the load of the university campus, as seen by the electric utility, during peak usage times, thus benefiting the electric utility without the concern of two way power flows occurring on the utility system. While a stationary battery has the potential to save more than a PHEV battery, the break even point between the two is the same. Thus, utilizing V2C will allow a university campus to achieve similar benefits without the initial high cost and space requirements of a stationary battery.
Acknowledgements
The authors would like to thank the members of the Clemson University Electric Power Research Association (CUEPRA) for their financial support and valuable discussion.
References
- Anumolu, P., Banhazl, G., Hilgeman, T. and Pirich, R. (2008) Plug-In Hybrid Vehicles: An Overview and Performance Analysis. 2008 IEEE Long Island Systems, Applications and Technology Conference, Farmingdale, 2 May 2008, 1-4. http://dx.doi.org/10.1109/LISAT.2008.4638946
- Chevrolet (2014) 2014 Volt: Electric Car―Hybrid Car Chevrolet Web. http://www.chevrolet.com/volt-electric-car.html
- Kisacikoglu, M.C., Ozpineci, B. and Tolbert, L.M. (2010) Examination of a PHEV Bidirectional Charger System for V2G Reactive Power Compensation. 2010 25th Annual IEEE Applied Power Electronics Conference and Exposition (APEC), Palm Springs, 21-25 February 2010, 458-465. http://dx.doi.org/10.1109/APEC.2010.5433629
- Bosch. (2014) Charging Stations Bosch Electric Vehicle Solutions Web. http:/www.pluginnow.com/charging_stations
- Davis, B.M. and Bradley, T.H. (2012) The Efficacy of Electric Vehicle Time-of-Use Rates in Guiding Plug-In Hybrid Electric Vehicle Charging Behavior. IEEE Transactions on Smart Grid, 3, 1679-1686. http://dx.doi.org/10.1109/TSG.2012.2205951
- Yilmaz, M. and Krein, P.T. (2013) Review of the Impact of Vehicle-to-Grid Technologies on Distribution Systems and Utility Interfaces. IEEE Transactions on Power Electronics, 28, 5673-5689. http://dx.doi.org/10.1109/TPEL.2012.2227500
- Pang, C., Dutta, P. and Kezunovic, M. (2012) BEVs/PHEVs as Dispersed Energy Storage for V2B Uses in the Smart Grid. IEEE Transactions on Smart Grid, 3, 473-482. http://dx.doi.org/10.1109/TSG.2011.2172228
- Das, R., Thirugnanam, K., Kumar, P., Lavudiya, R. and Singh, M. (2014) Mathematical Modeling for Economic Evaluation of Electric Vehicle to Smart Grid Interaction. IEEE Transactions on Smart Grid, 5, 712-721. http://dx.doi.org/10.1109/TSG.2013.2275979
- US Department of Transportation, Federal Highway Administratio (2014) 2009 National Household Travel Survey. http://nhts.ornl.gov
- PG & E (2014) Time-of-Use. http://www.pge.com/en/mybusiness/rates/tvp/toupricing.page?WT.mc_id=Vanity_tou
- PPL Electric Utilities (2014) Time-of-Use Rate Option. https://www.pplelectric.com/at-your-service/electric-rates-and-rules/time-of-use-option.aspx
- Southern California Edison (2014) Residential Rate Plans. https://www.sce.com/wps/portal/home/residential/rates/residential-plan/tou/
- Portland General Electric (2014) Time of Use: Pricing. http://www.portlandgeneral.com/residential/your_account/billing_payment/time_of_use/pricing.aspx
- Con Edison (2014) Voluntary Time-of-Use. http://www.coned.com/customercentral/energyresvoluntary.asp
- NV Energy (2014) Residential Time of Use for Southern Service Territory. Time of Use Rate for Home. https://www.nvenergy.com/home/paymentbilling/timeofuse.cfm
- BGE (2014) Time of Use Pricing. http://www.bge.com/waystosave/manageyourusage/pages/time-of-use-pricing.aspx
- Anderson, D. (2009) An Evaluation of Current and Future Costs for Lithium-Ion Batteries for Use in Electrified Ve- hicle Powertrains. Master’s Thesis, Environmental Management, Duke University, Durham.
Notation
CostB: The cost of the battery;
CostBL: The baseline charging cost without V2C;
CostC: The compensation that is necessary for each instance of V2C;
CostE: The total energy cost;
CycR: The number of cycles the battery is rated for;
EB: The usable capacity of the battery;
EC: The total energy supplied to the vehicle during charging including losses;
ED: The total energy supplied from the vehicle to the campus, after losses are subtracted;
EH: The energy used to home from work;
EW: The energy used to travel from home to work;
RateOff: The price of electricity during off peak times;
RateOn: The price of electricity during peak times;
SavSB: The amount of money saved using a stationary battery;
SavV2C: The amount of money saved using V2C.