Advances in Physical Education
Vol.4 No.3(2014), Article
ID:49336,11
pages
DOI:10.4236/ape.2014.43017
A 30-Year Journey of Monitoring Fitness and Skill Outcomes in Physical Education: Lessons Learned and a Focus on the Future
Garry Tester, Timothy R. Ackland, Laurence Houghton
School of Sport Science, Exercise and Health, The University of Western Australia, Perth, Australia
Email: tim.ackland@uwa.edu.au
Copyright © 2014 by authors and Scientific Research Publishing Inc.
This work is licensed under the Creative Commons Attribution International License (CC BY).
http://creativecommons.org/licenses/by/4.0/


Received 28 June 2014; revised 30 July 2014; accepted 8 August 2014
ABSTRACT
The aims of this paper are to provide normative data for primary school-age children from various regions in Australia, to identify secular trends in the data over three decades, to focus on results for selected schools that have adopted varied levels of commitment to the physical education program and finally, to demonstrate a way forward to improve the fitness and skill levels of children. Children’s physical (PQ), fitness (FQ) and skill (SQ) quotient data were collated from over 30 years (1981-2012) of program implementation, with individual data from 27,571 students aged 6 - 12 years. Compared to the initial cohort of children from whom the sub-scale was created (1981- 1989), mean PQ data were consistently 10 - 15 points lower for both boys and girls over the past three decades. There appears no identifiable trend for Australian rural versus metropolitan students. Of great concern, however, was the decline in skill level for the younger children over the past 20 years. While fitness levels appear to have been maintained, the poorer SQ scores for the cohort aged 6 years, particularly in females, clearly impact negatively on the composite PQ values. With detailed test protocols and quotient calculations freely available, and now published normative data, the PQ can be used widely across nations to develop genuine hope for the future of improving the health of children.
Keywords:Physical Education, Fitness, Skill, Physical Quotient

1. Introduction
Physical inactivity contributes to the deaths of more than 13,000 Australians and results in more than AUD $1.5 billion in direct healthcare costs each year (Auditor General of Australia, 2012). Excess body weight is the sixth most important risk factor contributing to the overall burden of disease worldwide with 10% of children now classified as overweight. The main adverse health consequences of this morphology are cardiovascular disease, type-2 diabetes and several cancers (Active Healthy Kids Australia, 2014). A further alarming problem is that children’s activity levels are low and declining (Haslam & James, 2005).
Researchers worldwide recognize that it is easier to change and promote health behaviors in children than to change poor habits among adults (Tester 2011; Tester & Watkins, 1987, 1988, 1994a, 1994b, 1995, 1996). For example, between 1981 and 1989, Tester (1991) measured the impact of a new physical education (PE) curriculum upon children’s fitness and skill levels, with complete stakeholder ownership (by teachers, parents and the children) in a primary school cohort aged 6 - 12 years. Through a systematically applied model, the selected children improved their overall fitness and skill when compared to two other randomly selected schools, with no stakeholder ownership. One comparison school had a PE specialist and the other had a classroom teacher who delivered the PE program. All three schools were of similar size of approximately 400 students.
The results for the school that used the Physical Quotient (PQ) data of their students’ performances and achieved ownership by all key stakeholders were outstanding, with significant improvement of 50% over the 9 years of the initial study. In contrast, the other two schools did not use the PQ data as a catalyst for change, and did not achieve program ownership by their stakeholders, and so results remained static over the study period. This outcome is consistent with data from Sallis et al. (1991, 1992, 1994, 1995, 1997) and other researchers (Dwyer et al., 1983; Etnier et al., 1997; Morrow & Freedson, 1994; Ribeiro et al., 2010; Simon et al., 2008; Simons-Morton et al., 1991; Strong et al., 2006) demonstrating that well-designed and engaging PE programs, with logical monitoring data will deliver significant health benefits.
Tester and Watkins (1994a, 1994b, 1995) published the findings of the original study, which resulted in worldwide interest for use of the testing protocol. In part, the popularity was due to the easily understood results which incorporated the innovative PQ scoring scale. The standardized PQ scores were based upon the more familiar Intelligence Quotient (IQ) (Herrnstein & Murray, 1994; Spearman, 2010). Since 1995, some 319 schools and 33,000 students aged 6 - 19 years have been assessed from Australia and Singapore.
However, none of these data have been published or analyzed for secular trends. Therefore, the primary aim of this paper was to provide normative data (by age and gender) for primary school-age children from metropolitan and rural regions in Australia. In addition, we sought to identify trends in the data collected over three decades, as well as to document an ongoing, successful case study to provide PE professionals a model for changing school culture and facilitating the delivery of positive fitness and skill outcomes.
2. Methods
Children’s PQ and the related sub-scales of Fitness Quotient (FQ) and Skill Quotient (SQ) were collated from over 30 years of research (1981 to 2012) providing the largest database of its type in the world. The database includes profiles from 27,571 students aged 6 - 12 years and represents primary schools throughout Australia (including metropolitan, regional and remote communities).
Prior to the implementation of the PQ, a handbook of test protocols was developed for the collection of FQ and SQ data; covering safety, warm up, test execution, standardized verbal instructions and a marking protocol. In the initial study, Tester (1991) trained the physical education specialist in School A, where all physical education and sport delivery was left to the specialist, with no stakeholder (parents, teachers and students) buy-in or ownership. In school B, again with no stakeholder ownership, a junior and upper primary teacher were trained to collect the data, while Tester collected all data in School C-Guildford Primary School (Western Australia) with full stakeholder ownership, over the same 9-year period as schools A and B. Tester and his trained physical education staff at Sports Challenge Australia (www.sportschallenge.com.au) completed all fitness and skill testing after 1990 to ensure standardization of scoring.
It should be noted that the FQ and SQ scores for all participating schools was made available at the end of February and November for the 9 years of the initial study. Where there was stakeholder ownership at School C, including a school objective of having fit, healthy and skilled children written into the school plan on an annual basis, the FQ and SQ scores increased significantly over 3 years to a new plateau in the fourth year. In Schools A and B, however, with no stakeholder ownership and the FQ and SQ data not used to monitor, communicate and to modify the PE and sport programs, the scores remained static for 9 years (Tester, 1991).
Since that initial study, Guildford Primary School has remained committed to the priority of having fit, healthy and skilled children. This school has had a PE specialist since 1990, has adopted a sustainability plan for PE and sport, with resources allocated annually to provide upgraded equipment, induct new teachers and parents annually to the importance of healthy and skilled children, and provide regular communication and individual reporting to all stakeholders. See Figure 1 for an example of the individual feedback that has been provided. This has allowed parents to monitor and develop ownership of their child’s performance and provide valuable support for sustainable physical activity both in the school and the community. These data have been collected annually by the PE teacher and Sports Challenge Australia staff.
2.1. Development of the PQ, FQ and SQ Scales
An initial database of 10,944 students aged 6 - 12 years was used to construct the PQ and both the FQ and SQ sub-scales. Data collection for this initial phase of research over 9 years (1981 to 1989) formed the basis of the composite fitness and skill scores for individuals with respect to their ageand gender-matched peers.
The seven item fitness test battery and summary score (FQ sub-scale), and the 10 item skill test battery (the SQ sub-scale), were combined to create an overall PQ score for each student (Table 1). Test items chosen for the fitness and skill batteries were based on functional tests with proven validity and reliability, ease of administration and minimal need for specialized testing equipment (CAHPER, 1974; Hunsicker & Reiff, 1976; Minister for Fitness and Amateur Sport, 1981). Furthermore, the tests chosen for the fitness scale measured the major physiological capacities of cardiovascular endurance, speed, strength and flexibility. The skill tests represented the fundamental motor movements within educational gymnastics and ball skills that underpin most sports undertaken by children and adolescents (Table 1).
The Cronbach Coefficient Alpha test of reliability was applied to all FQ and SQ results in the initial study cohort, with reliability coefficients ranging from 0.78 - 0.97. Lower reliability coefficients were noted mainly in the junior primary groups (students aged 6 - 7 years), whereas all coefficients for students aged 8 - 12 years were above 0.94 (Tester, 1991).
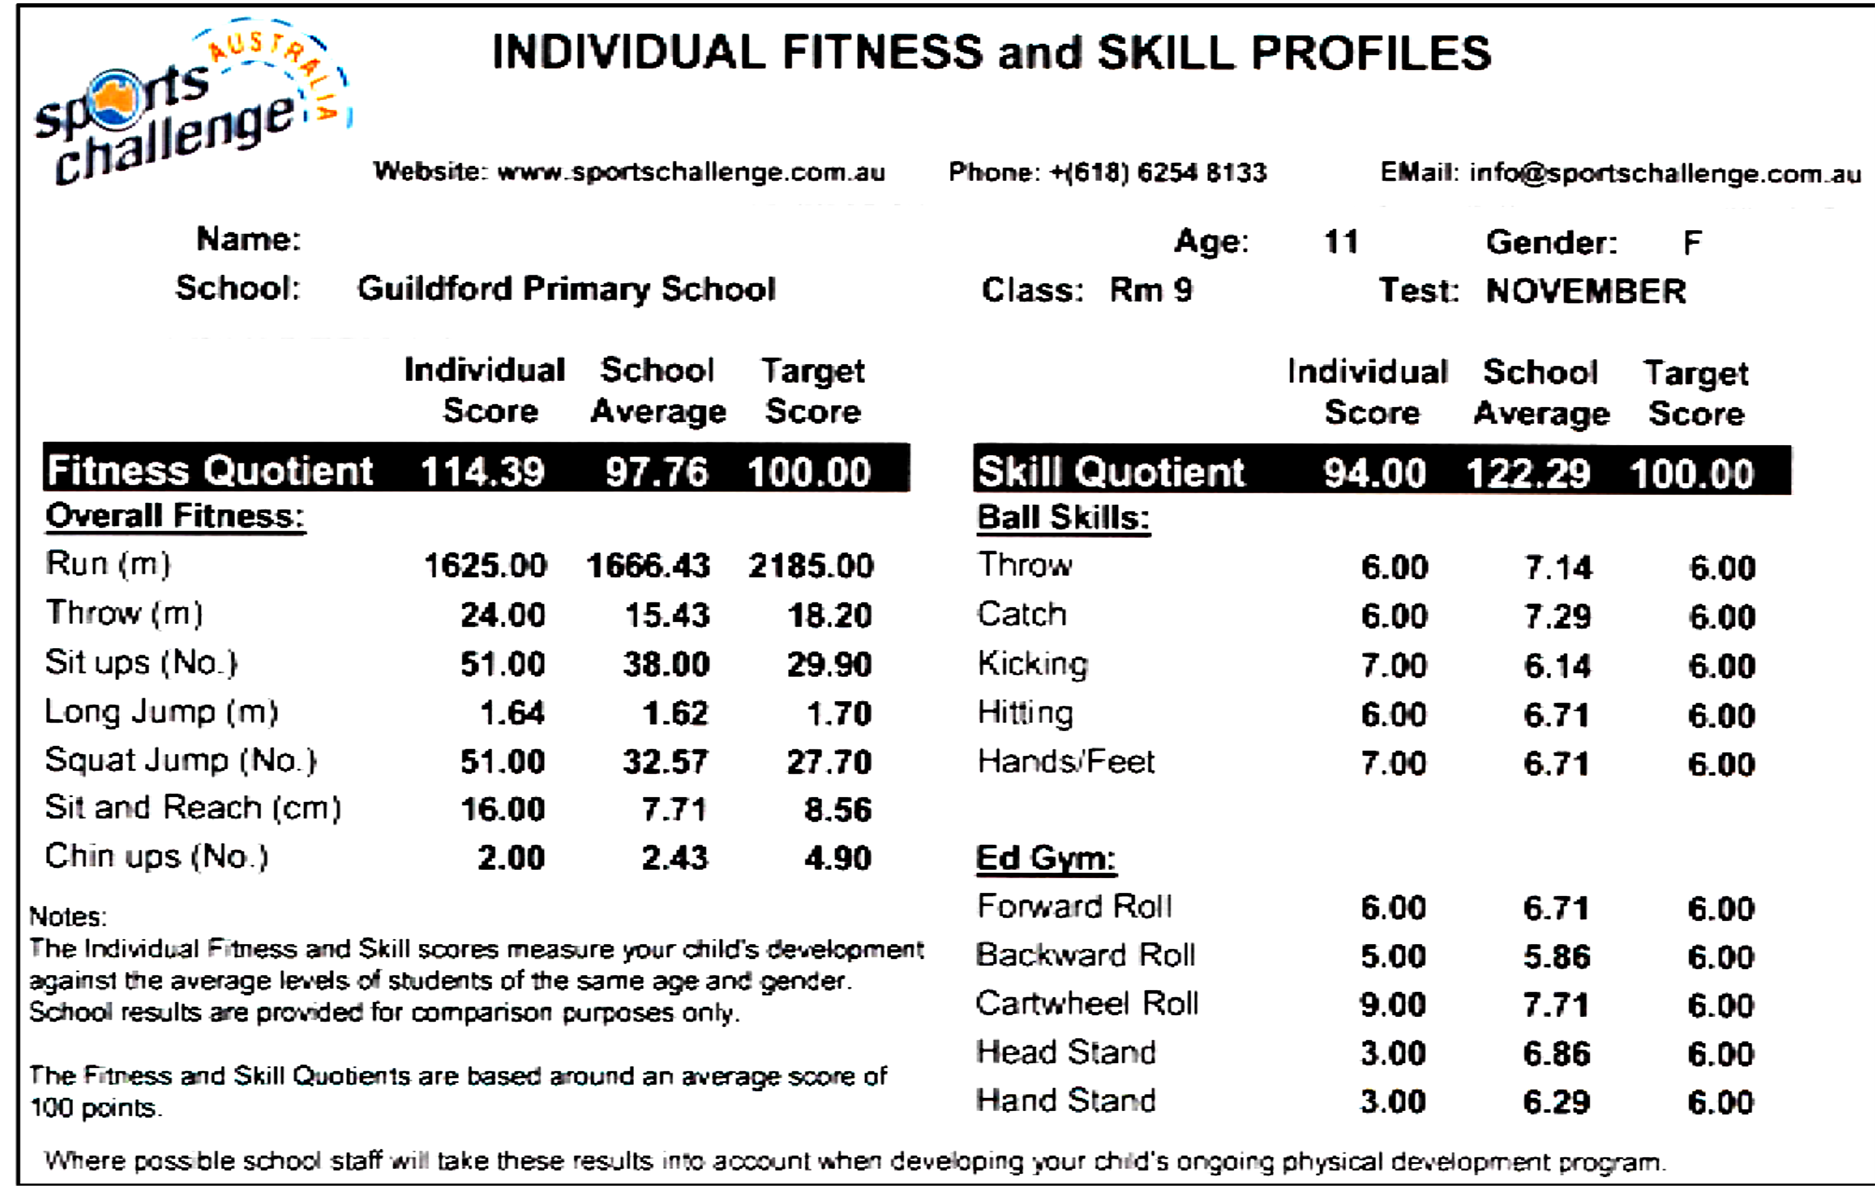
Figure 1. Individual report example for test components and fitness and skill quotients showing the comparison with the school average and target mean scores.

Table 1. Test battery components for calculating the fitness quotient (FQ) and the skill quotient (SQ).
Note. All skill test scores out of a possible 10 points, with the grand mean being the average of each test within each of the two disciplines-educational gymnastics and ball skills.
The resultant PQ, FQ and SQ scores for an individual were typically in the range of 80 - 120, with a score of 100 representing an average performance in fitness and skill for a particular age and gender group. The scoring system is equivalent statistically to the standard IQ scale used for assessment of intellectual capacity and follows a Gaussian distribution. An acceptable range for FQ and SQ, or the combined PQ, is 85 - 115 points, representing one standard deviation above or below the mean of 100 points.
Following an initial positive response from teachers, parents and health professionals during the first decade (1981-1990), now 22 years on (1991-2012) the PQ still provides a relevant, understandable measure that facilitates motivation for all stakeholders (teachers, coaches, children and parents) to effect change in health outcomes.
2.2. Data Analysis
Individual test data were scored according to Tester (1991) to create FQ, SQ and PQ summary data. Group mean and standard deviation values were then computed separately for male and female students and reported for seven cohorts of school children aged 6 - 12 years inclusively. A series of single-factor analysis of variance tests were conducted with post hoc t-tests used to determine specific group differences. An alpha level for significance was set at p < 0.01 to accommodate multiple comparisons.
3. Results
FQ, SQ and PQ normative data for Australian primary school children aged 6 - 12 years are presented in Tables 2-4with stratification by age, gender and location (metropolitan or rural). Compared to the initial cohort of children from whom the sub-scale was created (1981-1989), both mean FQ and SQ were consistently 10 - 15 points lower for both boys and girls in the database (approximately 1 and 0.5 standard deviations lower for FQ and SQ, respectively). There was no identifiable trend for age or gender in this regard, or any consistent trend for rural versus metropolitan students in either FQ or SQ. Similarly, the PQ scores for Australian students (Table 4) were consistently 10 - 15 points lower for both boys and girls compared to the initial cohort of children from whom the sub-scale was created. While there appears no identifiable trend for rural versus metropolitan students, the PQ improved at the higher age groups and is consistently higher by 3 - 5 points for boys compared to girls.
Figure 2 demonstrates the trends in FQ, SQ and PQ for 6- and 12-year-old children over the three decades. Among children aged 6 years, and compared to those tested in the 1980’s, both male and female students from the latter decades performed decidedly worse on the SQ by some 20 - 30 points (Figure 2(a)). This was especially marked in the 6 year old girls with a similar trend observed in FQ and the resulting PQ in this cohort
Table 2 . Fitness quotient scores of Australian primary school children aged 6 - 12 y from rural and metropolitan areas (data collected from 1981-2012). Values are mean ± SD (number of schools, number of children).
Table 3. Skill quotient scores of Australian primary school children aged 6 - 12 y from rural and metropolitan areas (data collected from 1981-2012). Values are mean ± SD (number of schools, number of children).
Table 4. Physical quotient scores of Australian primary school children aged 6 - 12 y from rural and metropolitan areas (data collected from 1981-2012). Values are mean ± SD (number of schools, number of children).
(Figure 2(a)). However, with a trend for improved FQ scores for 6-year-old boys, the resultant PQ scores are reasonably maintained for boys over the past three decades.
For boys aged 12 years, a trend for increased mean SQ is countered by a negative trend for FQ, thereby resulting in similar PQ scores over the three decades (Figure 2(b)). For girls, a spike in SQ during the 1990’s occurred and this had a similar effect on the PQ for this decade (Figure 2(b)).
Finally, mixed-longitudinal PQ data are presented for Year-1 and Year-7 students from Guildford Primary School and compared to the normative data for all schools (Figure 3). These male and female, 6 and 12 year age cohorts from Guildford have maintained PQ scores well in excess of the normative average data over the past three decades.
4. Discussion
This paper presents normative data for FQ, SQ and PQ scores, stratified by age and gender, and collated from over 27,000 participants spanning 30 years in the Sports Challenge Australia program. With detailed test protocols and quotient calculations freely available, and now published normative data, this standardized test battery can be adopted universally. Compared to the initial cohort of children from whom the sub-scale was created (1981-1989), mean PQ data were consistently 10 - 15 points lower for both boys and girls over the past three decades, thought there was no identifiable trend for Australian rural versus metropolitan students.
Many Australians labor under the misapprehension that children from rural communities lead a more active and healthier lifestyle than their metropolitan counterparts. The FQ data presented here are equivocal in this regard. The problems faced by children in rural communities range from the lack of qualified PE teachers, extremes of climate, relatively poor school facilities, a lack of community support and general classroom teachers with limited or no knowledge of delivering quality and engaging PE programs (Tester, 2010).
Trends across Three Decades
Of great concern in these data, is the decline in skill level for the younger children over the past 20 years. While fitness levels appear to have been maintained, the poorer SQ scores for the year 6 cohort clearly impact negatively on the composite PQ values. As research has shown (Active Healthy Kids Australia, 2014; Haslam & James, 2005), it is better to teach and improve both physical and health habits in younger children, and this is very true of fundamental movement skills. The trend in Australian schools over the past two decades has been to reduce the number of qualified PE staff in primary schools. In 2012, only one in ten schools had access to such a staff member (Auditor general of Australia, 2012). As a result, fundamental movement skills are not taught consistently through the Australian school system and this important aspect of motor development is often left to
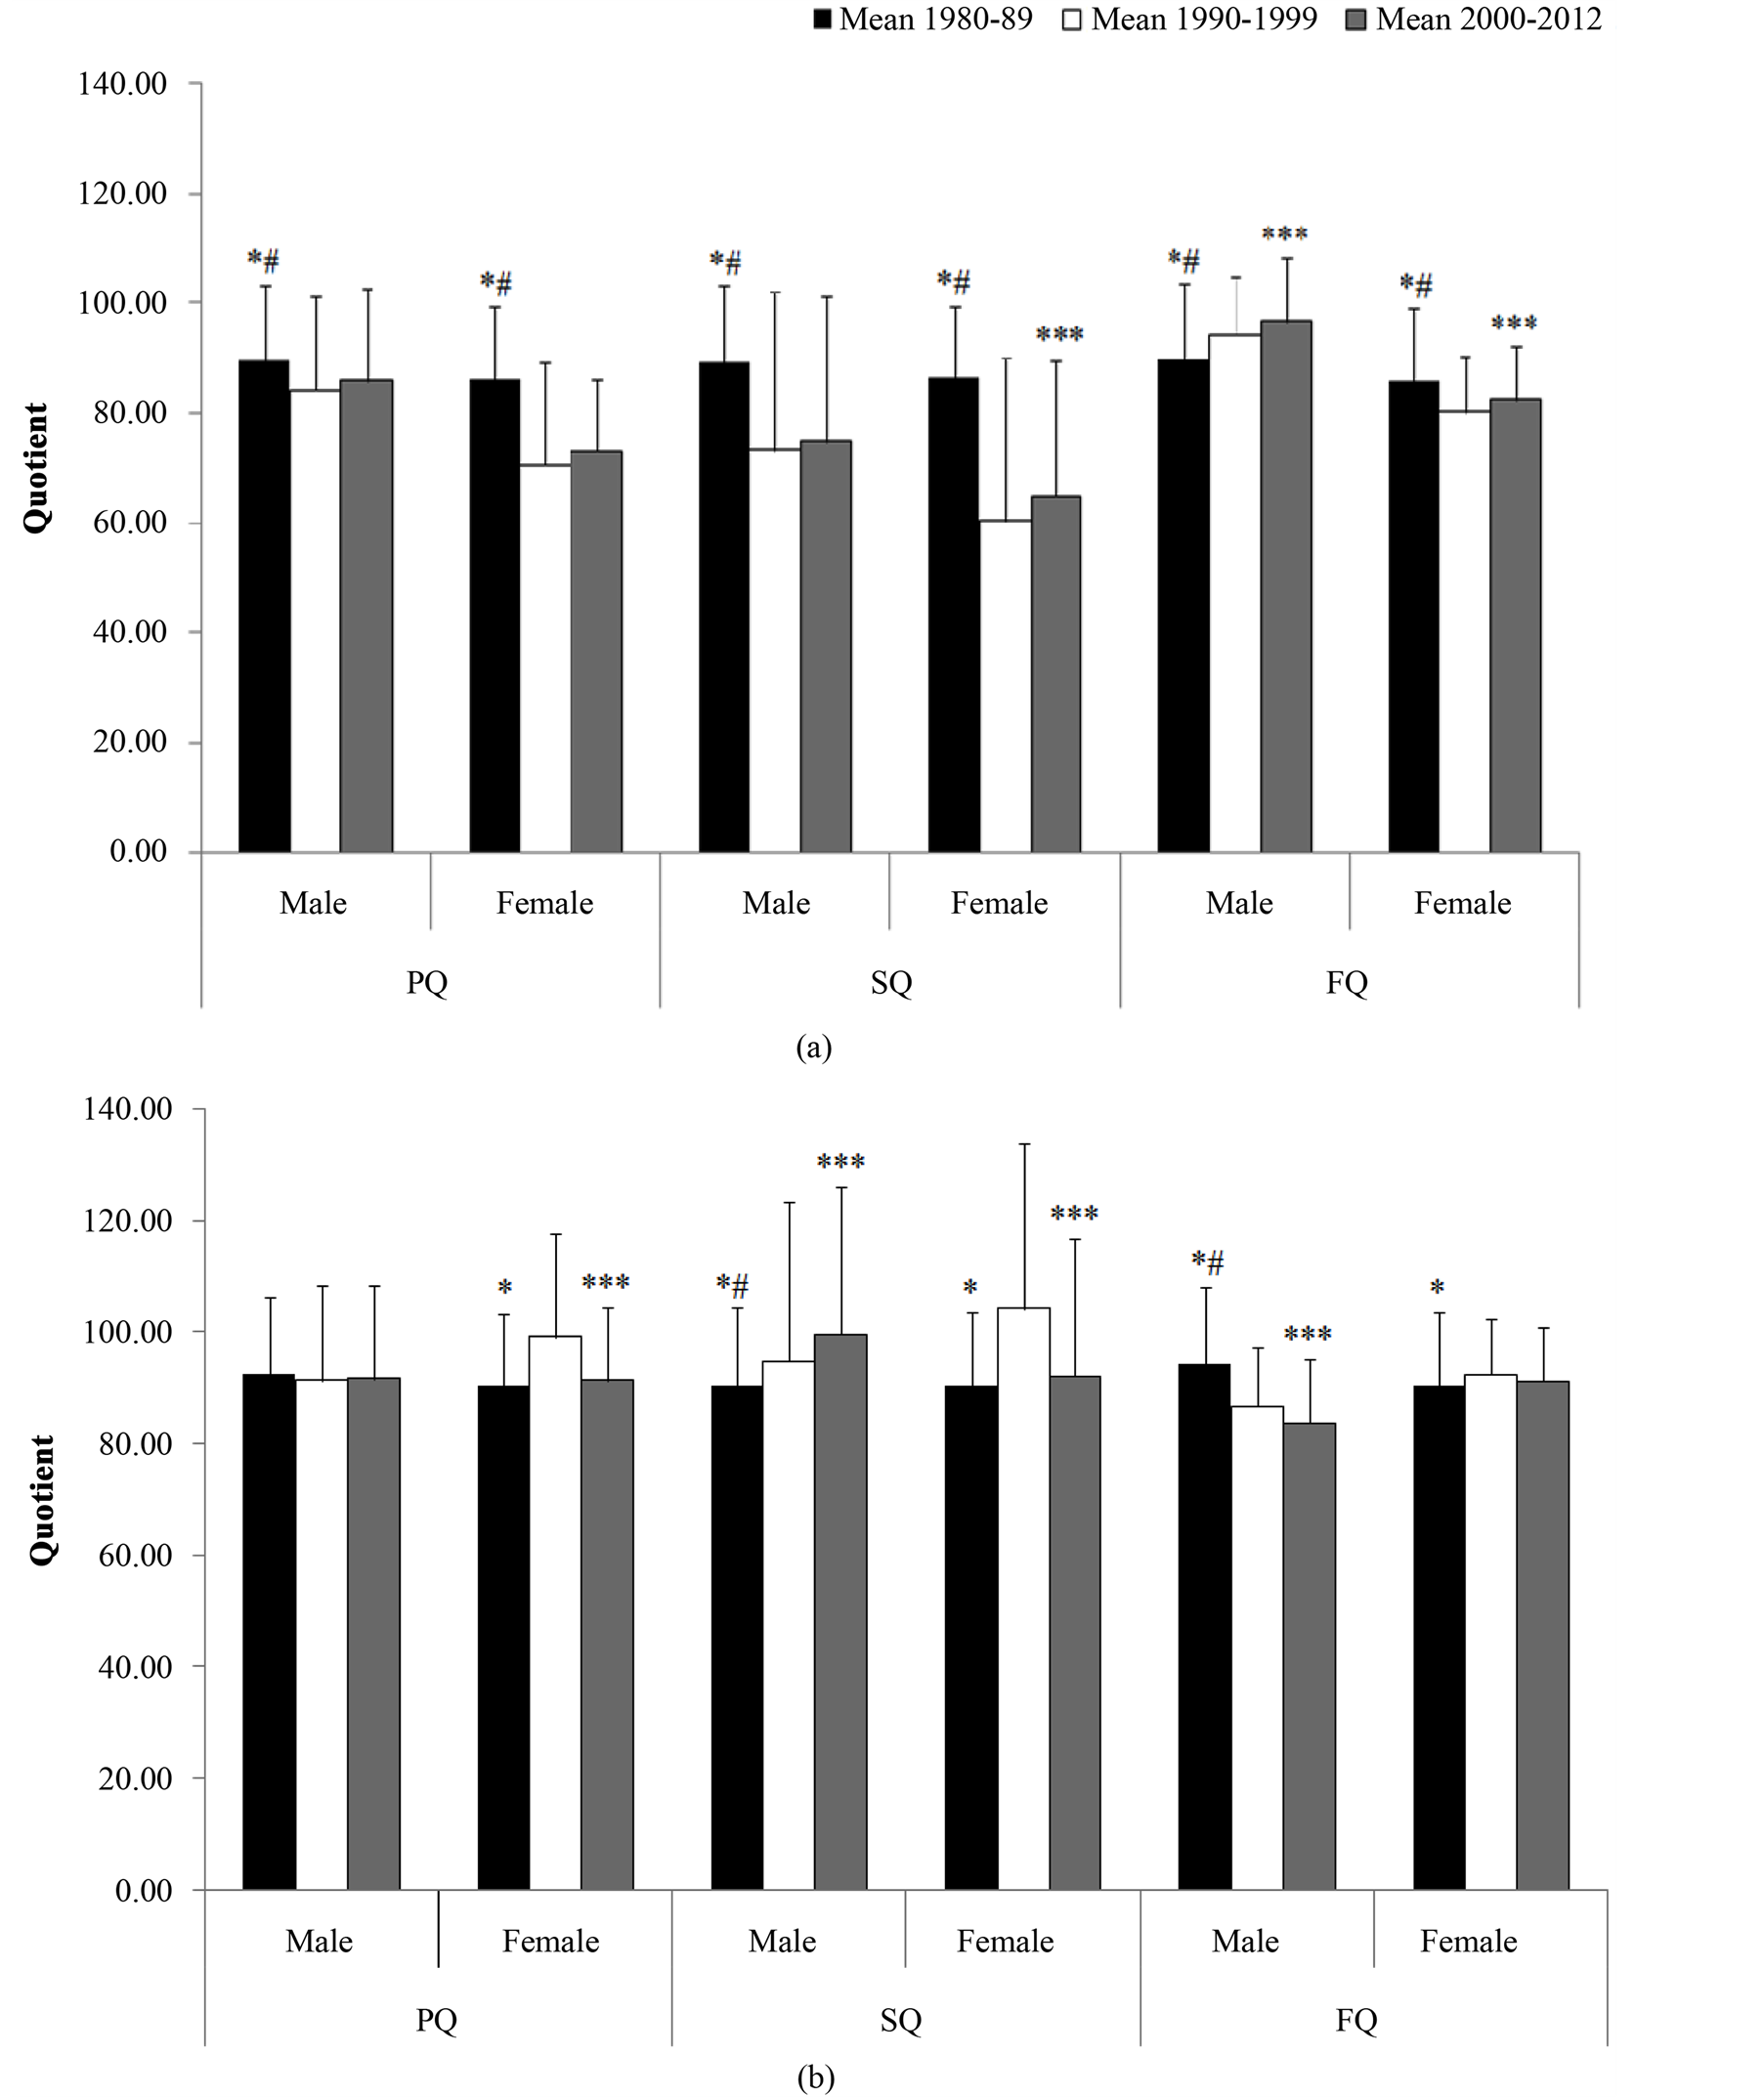
Figure 2. Physical quotient (PQ), skill quotient (SQ) and fitness quotient (FQ) mean scores across the three decades of Sports Challenge testing in Australian schools: (a). Year 1 (6 y); (b). Year 7 (12 y). *1980-89 significantly different from 1990-1999, p < 0.01; #1980-89 significantly different from 2000-2012, p < 0.01; ***1990-1999 significantly different from 2000-2012, p < 0.01.
family activities and community programs.
Consistent with other researchers, in particular Sallis et al. (1991, 1992, 1994, 1995, 1997), Bailey (2006) and the recent Australian survey (Active Healthy Kids Australia, 2014), we acknowledge that participation in school-based PE and sport will not necessarily result in improved health outcomes. Further, the world is now a very different place from the start of this research three decades ago. Today’s children are less active and there
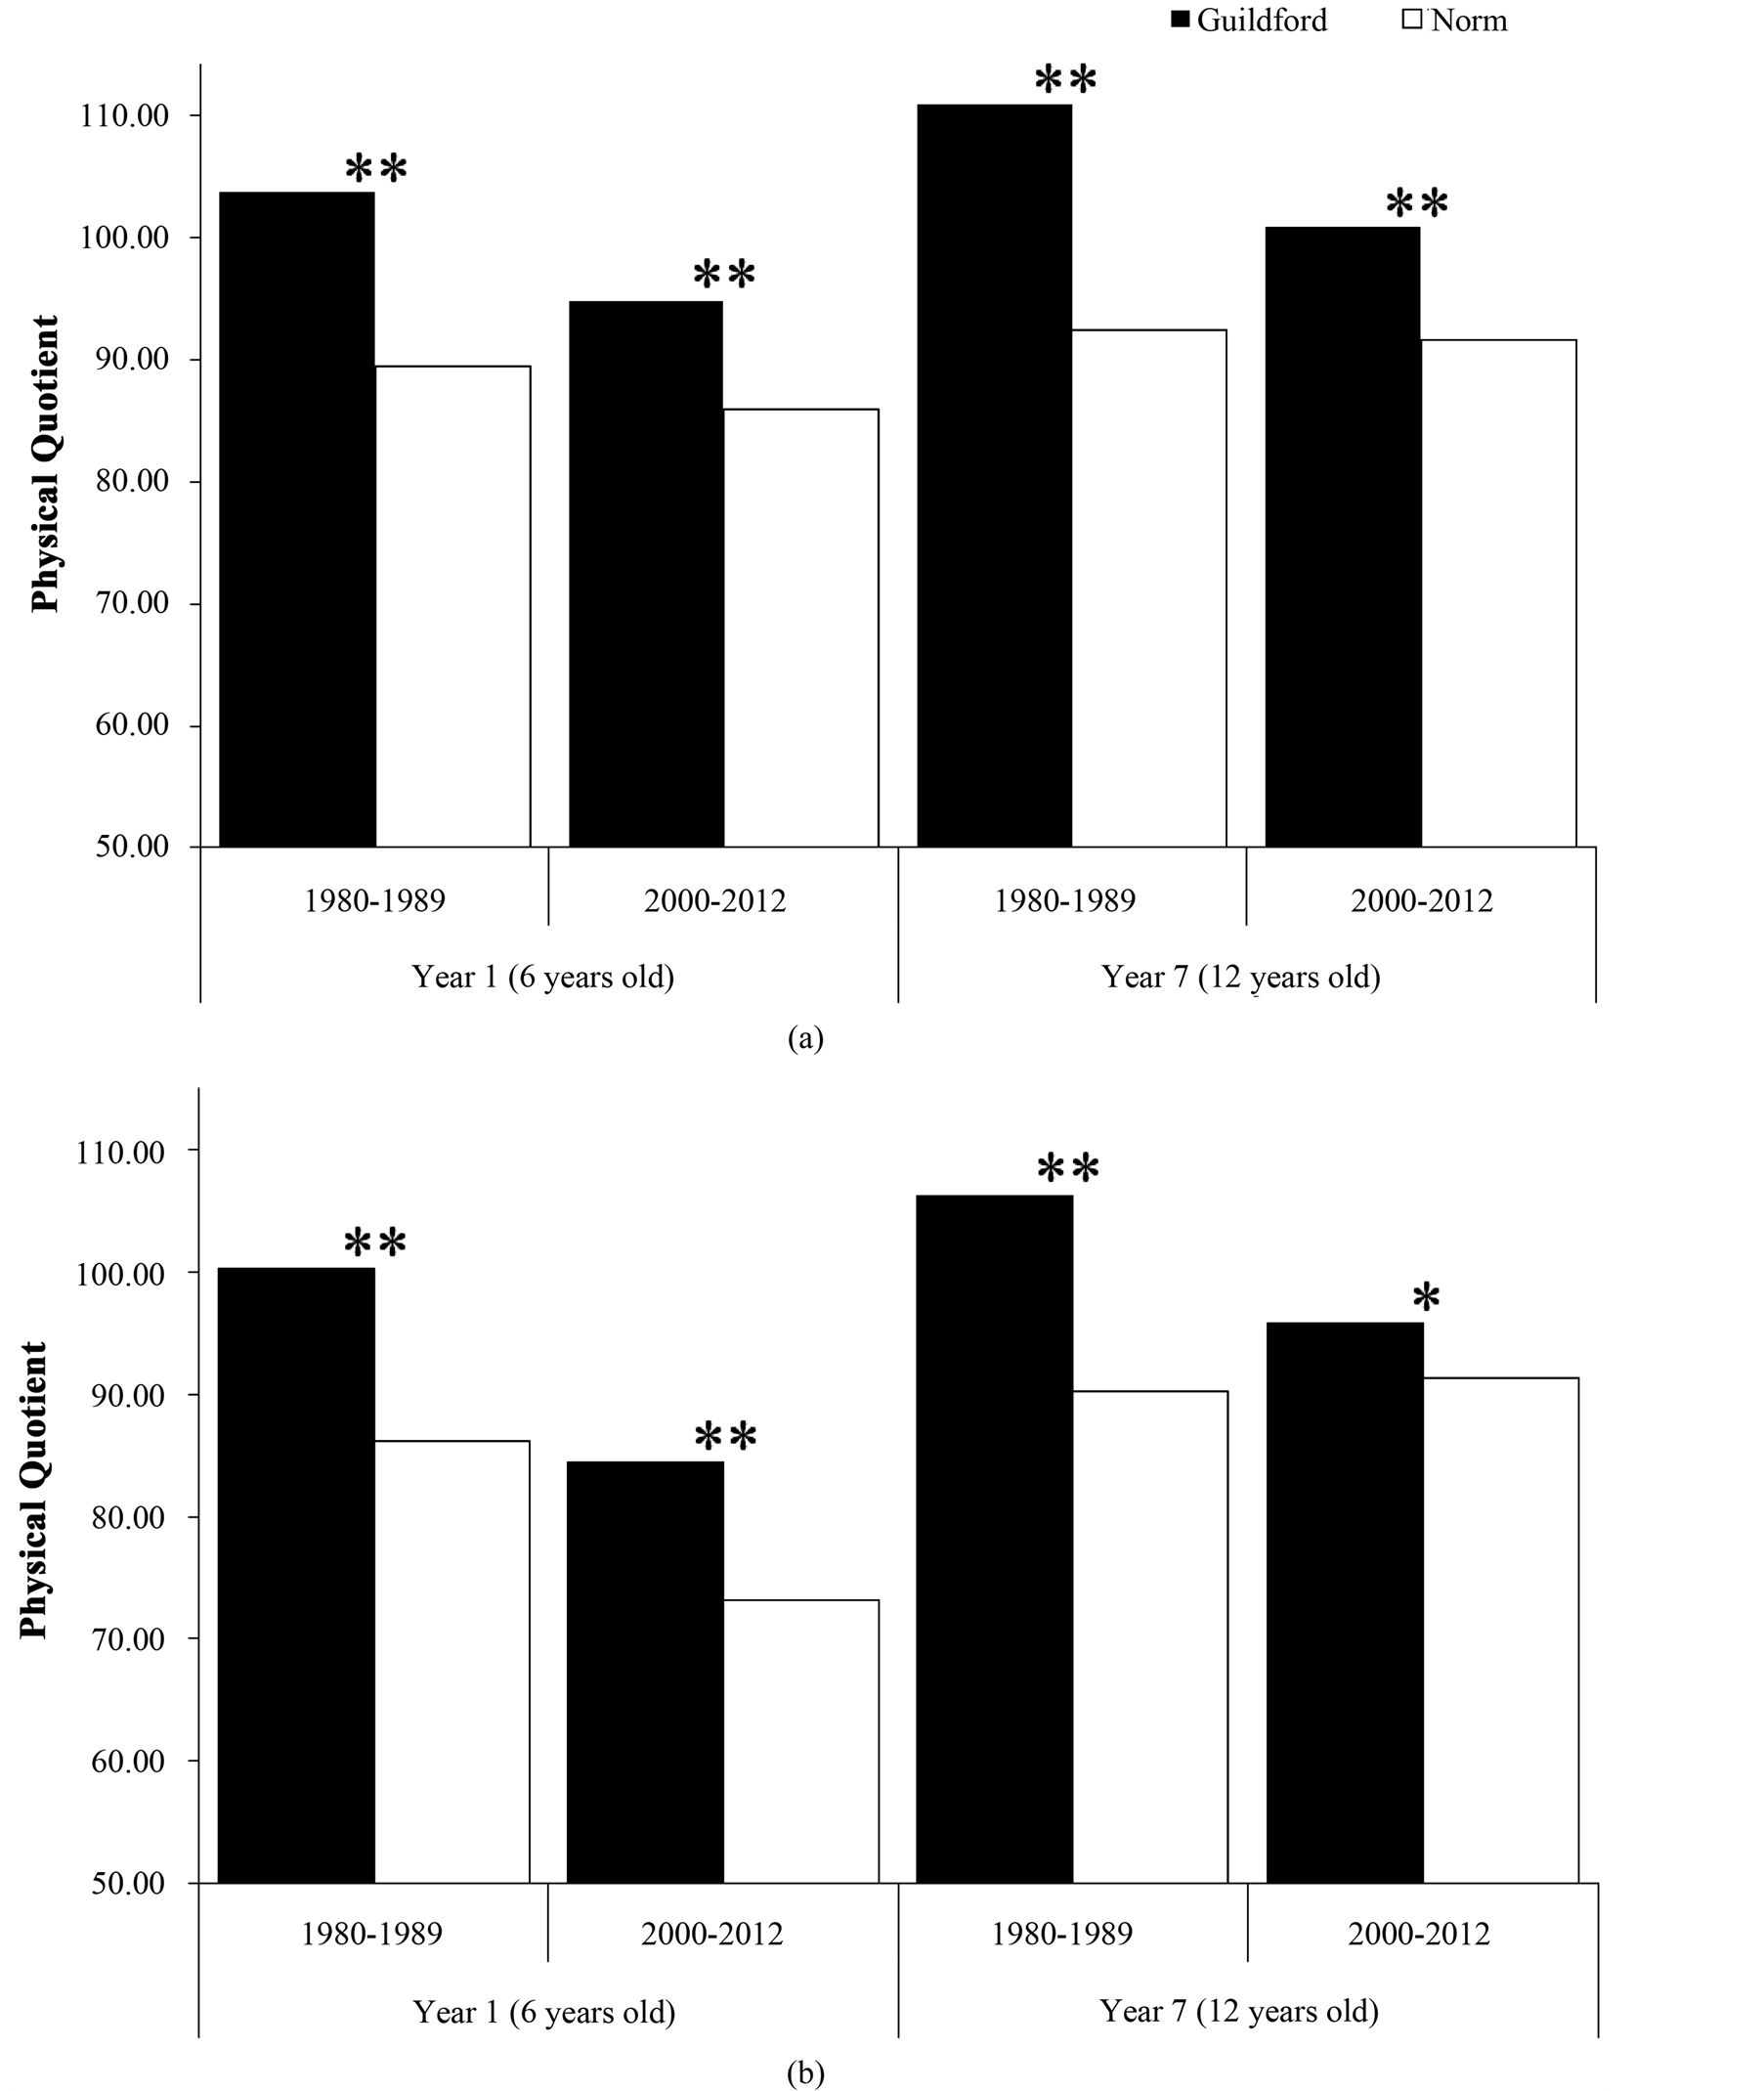
Figure 3. Mean physical quotient (PQ) data from Guildford Primary School (Guildford) and normative data (Norm) from all schools, comparing Year 1 and Year 6 cohorts from 1980-1989 and 2000-2012. *p < 0.01; **p < 0.001. (a) Males PQ. (b) Females PQ.
is an alarming rise in obesity in this cohort. Furthermore, there is less PE time in schools, fewer trained PE teachers in Australian primary schools, fewer children ride or walk to school, and the advent of the computer has increased their sedentary behavior (Eime et al., 2013; Epstein et al., 2008; Mota et al., 2010; Schooler & Trinh, 2011; Vella et al., 2014; Wickel & Eisenmann, 2007; Wong et al., 2011).
Nevertheless, the skill level and physical capacity of primary school-aged children are sensitive to an appropriate intervention strategy. Working closely with one Singaporean primary school, Sports Challenge Australia has been successful in creating an environment that has underpinned significant improvements in children’s SQ scores in less than 12 months. When there is ownership by the key stakeholders involved in a student’s PE development (family, the principal and trained PE staff) and with access to accurate and reliable normative data like the PQ, significant improvements can occur. Evidence from this 30-year research project supports our observation that positive health outcomes can be achieved when there is a systematic commitment by all stakeholders in a community school.
The program adopted by Guildford Primary School aimed to improve fitness and skill levels among the entire student population and this has paid dividends when their scores were compared to two other randomly selected (control) schools of similar size and demographics. The researchers were not interested in simply passively studying, recording and reporting on a sample of school children and comparing it to other samples. They set out to change the environment and create a way of intervening in this school to encourage and foster the development of fit, healthy and skilled children to develop sustainability, which has been demonstrated to be sustainable over 30 years.
Conversely, the two other metropolitan schools that did not use these data effectively (one had a PE specialist and the other had a classroom teacher who ran the PE program) combined with no commitment and ownership from the key stakeholders, there was little change over the 9 years.
5. Conclusion
This research has shown that when communities are prepared to support the PE program in their school, through trained and committed teaching personnel, combined with regular assessment data that is understandable to all involved in, but especially the parents, they can achieve significant health benefits for their children.
These 30 years of programming and data collection have generated the World’s largest database of its type and has shown clearly that there is genuine hope for the future if communities want to make a difference to the health of their children. The sustained efforts at Guildford Primary School demonstrate that with the right plan and ownership by the key stakeholders, all children have the capacity to improve their overall health and take genuine ownership of their lifestyle choices in life’s uncertain journey.
References
- Active Healthy Kids Australia (2014). Is Sport Enough? The 2014 Active Healthy Kids Australia Report Card on Physical Activity for Children and Young People, Adelaide, South Australia.
- Auditor General of Australia (2012). Physical Activity in Government Primary Schools Needs to Improve. Auditor General’s Report to Parliament, June 2012, NSW.
- Bailey, R. (2006). Physical Education and Sport in Schools: A Review of Benefits and Outcomes. Journal of School Health, 76, 397-401. http://dx.doi.org/10.1111/j.1746-1561.2006.00132.x
- Canadian Association for Health, Physical Education and Recreation (CAHPER) (1974). The CAHPER Fitness-Performance Test Manual. Ontario: CAHPER.
- Dwyer, T., Coonan, W. E., Leitch, D. R., Hetzel, B. S., & Baghurst, R. A. (1983). An Investigation of the Effects of Daily Physical Activity on the Health of Primary School Students in South Australia. The International Journal of Epidemiology, 12, 308-313. http://dx.doi.org/10.1093/ije/12.3.308
- Eime, R., Young, J., Harvey, J., Charity, M., & Payne, W. (2013). A Systematic Review of the Psychological and Social Benefits of Participation in Sport for Children and Adolescents: Informing Development of Conceptual Model of Health through Sport. International Journal of Behavioural Nutrition and Physical Activity, 10, 98. http://dx.doi.org/10.1186/1479-5868-10-98
- Epstein, L., Roemmich, J., Robinson, J., Paluch, R., Winiewicz, D., Fuercg, J. et al. (2008). A Randomized Trial of the Effects of Reducing Television Viewing and Computer Use on Body Mass Index in Young Children. Archives of Pediatrics and Adolescent Medicine, 162, 239-245. http://dx.doi.org/10.1001/archpediatrics.2007.45
- Etnier, J., Salazar, W., Landers, D. M., Petruzzello, S. J., Han, M., & Nowell, P. (1997). The Influence of Physical Fitness and Exercise upon Cognitive Functioning: A Meta Analysis. Journal of Sport and Exercise Psychology, 19, 249-277.
- Haslam, D. W., & James, P. T. (2005). Obesity. The Lancet, 366, 1197-1209. http://dx.doi.org/10.1016/S0140-6736(05)67483-1
- Herrnstein, R. J., & Murray, C. (1994). The Bell Curve: Intelligence and Class Structure in American Life. New York, NY: Free Press.
- Hunsicker, P., & Reiff, G. G. (1976). AAHPERD Youth Fitness Test Manual. Washington DC, AAHPERD.
- Minister for Fitness and Amateur Sport (1981). The Canadian Fitness Survey. Ottawa.
- Morrow, J. R., & Freedson, P. S. (1994). Relationship between Habitual Physical Activity and Aerobic Activity in Adolescents. Pediatric Exercise Science, 6, 315-329.
- Mota, J., Ribeiro, J., Carvalho, J., Santos, M., & Martins, J. (2010). Television Viewing and Changes in Body Mass Index and Cardiorespiratory Fitness over a Two-Year Period in Schoolchildren. Pediatric Exercise Science, 22, 245-253.
- Ribeiro, I. C., Parra, D. C., Hoehner, C. M., Soares, J., Torres, A., Pratt, M., Legetic, B. et al. (2010). School-Based Physical Education Programs: Evidence-Based Physical Activity Interventions for Youth in Latin America. Global Health Promotion, 17, 5-15. http://dx.doi.org/10.1177/1757975910365231
- Sallis, J. F., & McKenzie, T. L. (1991). Physical Education’s Role in Public Health. The Research Quarterly for Exercise and Sport, 62, 124-137. http://dx.doi.org/10.1080/02701367.1991.10608701
- Sallis, J. F., & Patrick, K. (1994). Physical Activity Guidelines for Adolescents: Consensus Statement. Paediatric Exercise Science, 6, 302-314.
- Sallis, J. F., Chen, A. H., & Castro, C. M. (1995). School-Based Interventions for Childhood Obesity. In L. W. Y. Cheung, & J. B. Richmond (Eds.), Child Health, Nutrition and Physical Activity (pp. 179-204). Campaign: Human Kinetics.
- Sallis, J. F., McKenzie, T. L., Alcaraz, J. E., Kolody, B., Fauchette, N., & Hovell, M. F. (1997). The Effects of a 2-Year Physical Education Program (SPARK) on Physical Activity and Fitness in Elementary School Students. American Journal of Public Health, 87, 1328-1334. http://dx.doi.org/10.2105/AJPH.87.8.1328
- Sallis, J. F., Simons-Morton, B. G., Stone, E. J., Corbin, C. B., Epstein, L. H., Fauchette, N. et al. (1992). Determinants of Physical Activity and Interventions in Youth. Medicine and Science in Sports and Exercise, 24, S248-S257. http://dx.doi.org/10.1249/00005768-199206001-00007
- Schooler, D., & Trinh, S. (2011). Longitudinal Associations between Television Viewing Patterns and Adolescent Body Satisfaction. Body Image, 8, 34-42. http://dx.doi.org/10.1016/j.bodyim.2010.09.001
- Simon, C., Schweitzer, B., Oujaa, M., Wagner, A., Arvelier, D., Triby, E., Copin, N., Blanc, S., & Platat, C. (2008). Successful Overweight Prevention in Adolescents by Increasing Physical Activity: A 4-Year Randomized Controlled Intervention. International Journal of Obesity, 32, 1489-1498. http://dx.doi.org/10.1038/ijo.2008.99
- Simons-Morton, B. G., Parcel, G. S., Baranowski, T., Forthofer, R., & O’Hara, N. M. (1991). Promoting Physical Activity and Healthful Diet among Children: Results of a School-Based Intervention Study. American Journal of Public Health, 81, 986-991. http://dx.doi.org/10.2105/AJPH.81.8.986
- Spearman, C. E. (2010). The Proof and Measurement of Association between Two Things. American Journal of Psychology, 15, 72-101. (1904). Reprinted in International Journal of Epidemiology, 39, 1137-1150. http://dx.doi.org/10.1093/ije/dyq191
- Strong, W. B., Malina, R. M., Blimkie, C. J. R., Daniels, S. R., Dishman, R. K., Gutin, B., Hergenroeder, A. C. et al. (2006). Evidence-Based Physical Activity for School Age Youth. Journal of Pediatrics, 146, 732-737. http://dx.doi.org/10.1016/j.jpeds.2005.01.055
- Tester, G. J. (1991). Planned Change in Curriculum and Its Impact on Student Performance: A Nine Year Longitudinal Study. Ph.D. Thesis, Perth: The University of Western Australia.
- Tester, G. J. (2010). Fitness and Skill Testing the Way Forward for Talent Identification. Proceedings of the Youth Olympics Conference, Singapore.
- Tester, G. J. (2011). A World First Measure for Talent Identification: The Physical Quotient PQ. Proceedings of the Aspire 4 Sport-Sports Congress, Doha.
- Tester, G. J., & Watkins, G. G. (1987). Anatomy of Innovation: Part 1—Implementing Daily Physical Education. ACHPER National Journal, 118, 16-18.
- Tester, G. J., & Watkins, G. G. (1988). Anatomy of Innovation: Part 2—The Impact of Daily Physical Education at Guildford Primary School Six Years on. ACHPER National Journal, 119, 9-11.
- Tester, G. J., & Watkins, G. G. (1994a). School and Community Plus Commitment to Physical Education Equals Guildford’s Success: Part 1. The ACHPER Healthy Lifestyles Journal, 41, 11-14.
- Tester, G. J., & Watkins, G. G. (1994b). School and Community Plus Commitment to Physical Education Equals Guildford’s Success: Part 2—School Comparisons. The ACHPER Healthy Lifestyles Journal, 41, 14-18.
- Tester, G. J., & Watkins, G. G. (1995). School and Community Plus Commitment to Physical Education Equals Guildford’s Success: Part 3—The Message Is in the Process Not the Curriculum. The ACHPER Healthy Lifestyles Journal, 42, 8-12.
- Tester, G. J., & Watkins, G. G. (1996). Developing a Winning School: The Impact of a Well Designed and Innovated Physical Education Program. The Hong Kong Journal of Sports Medicine and Sports Science, 3, 36-58.
- Vella, S., Cliff, D., Magee, C., & Okely, A. (2014). Sports Participation and Parent-Reported Health-Related Quality of Life in Children: Longitudinal Associations. Journal of Pediatrics, Online First. http://ro.uow.edu.au/sspapers/837
- Wickel, E., & Eisenmann, J. (2007). Contribution of Youth Sport to Total Daily Physical Activity among 6- to 12-Yr-Old Boys. Medicine and Science in Sports and Exercise, 39, 1493-1500. http://dx.doi.org/10.1249/mss.0b013e318093f56a
- Wong, B., Faulkner, G., & Buliung, R. (2011). GIS Measured Environmental Correlates of Active School Transport: A Systematic Review of 14 Studies. International Journal of Behavioural Nutrition and Physical Activity, 8, 1-22.