Open Journal of Safety Science and Technology
Vol.2 No.2(2012), Article ID:20271,7 pages DOI:10.4236/ojsst.2012.22008
Dynamic Stability Analysis and Forecast of Surface Mine Dump
School of Resources and Environmental Engineering, Wuhan University of Technology, Wuhan, China
Email: yehaiwang369@hotmail.com
Received January 11, 2012; revised February 11, 2012; accepted February 18, 2012
Keywords: Dump; Dynamic Stability; Geo-Studio Software; Forecast
ABSTRACT
Malugou Dump is close to Jinduicheng Molybdenum surfaces mine and affected by blasting vibration all its lifetime, it is meaningful to monitor the blasting vibration and analyze the stability of dump under blasting vibration so as to ensure the safety of the dump. Firstly, dynamic test was done about Malugou Dump. Then dynamic stability analysis of the dump is simulated with Geo-studio software. The results show that the present blasting vibration has little effect on the dump and the safety factor of dump under blasting vibration is about 1.158, which indicates that Malugou Dump is safe. At last, the relationship between safety factor and maximum single explosion charge, the horizontal distance between monitoring points and blast source and elevation difference is obtained by simulating and regressing, which can be used as a guidance of production blasting in Jinduicheng Molybdenum mine.
1. Introduction
Dump is one of the main facilities in mines, and dump stability will be affected by production activities and economic benefits of mines. The factors that affect the stability of dumps are underground water, dumping process, production blasting, rainstorm etc. [1,2].
Malugou Dump is located at 400 meters away from the southeast corner of Jinduicheng opencast, and the total dumping area is 455,517.3 m2. The dump slope height now is 150 m, and the final designed dump slope height is 205 m. The main geomorphic types in this range are alluvial valleys and erosion slopes with bedrock. Malugou is converged from 4 upriver finger valleys and the largest width of that is 180 m. The valley is overall calabash type with large inside and small outfall. The bedrock slope is widely protruded at both sides of valleys, and the slope ratio is more than 1:2. Most area of slope is lush with plants except few with bedrock exposed. And there is a small range of artificial crushed stones in the dumping area of dump.
The water bodies in the valleys are surface water and groundwater. The surface water is from the natural rainfall, and the maximum daily precipitation at rainstorm of Malugou is 114.11 mm. The groundwater is from the Quaternary pore water and the erosion bedrock crevice water. The pore water is located at the region of colluvium gravel soil and alluvial gravel layer, and the maximum buried depth of which is 15 m. The crevice water is small, located at the cracks of bedrock.
2. Dynamic Stability Analysis of Malugou Dump
A typical section (Figure 1) is selected to analyze the stability of Malugou dump under blasting vibration loading. A 2-dimension model of dump is built with the Geostudio software, X is the horizontal direction, and Y is the vertical direction. There are four testing points, 1#, 2#, 3# and 4# (Figure 2), used to test the dynamic response of dump during production blasting.
2.1. Parameters of Dumping Materials
Malugou dump is stacked with four kinds of materials, permeable dam, slag, gravel soil and bedrock. The physical and mechanical parameters (Table 1) [3] of saturated dumping materials are acquired from the related data of Malugou dump.
2.2. Dynamic Stability Analysis of Dump
The dynamic stability of Malugou dump is analyzed with Geo-studio software. Firstly the dynamic response of blasting vibration is firstly analyzed in QUAKE/W module, and then the dump slope stability is analyzed in SLOPE/W module [4].
The testing data from testing point 4 used to analyze the dynamic stability of dump are listed in Table 2 and the peak acceleration curves of data 1 are shown in Figures 3 and 4.
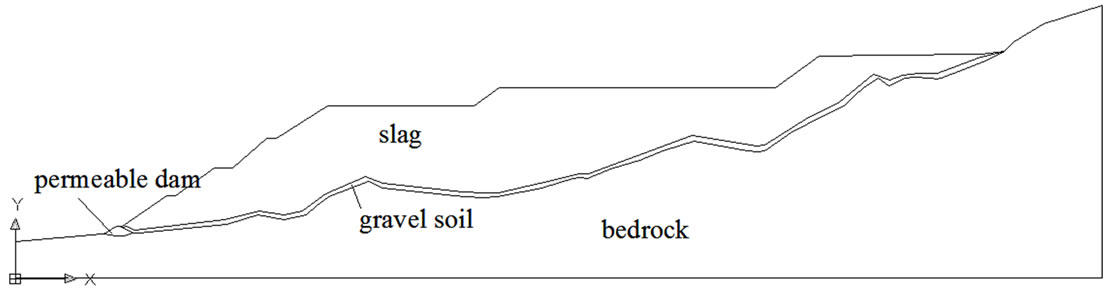
Figure 1. Typical section of present dump.
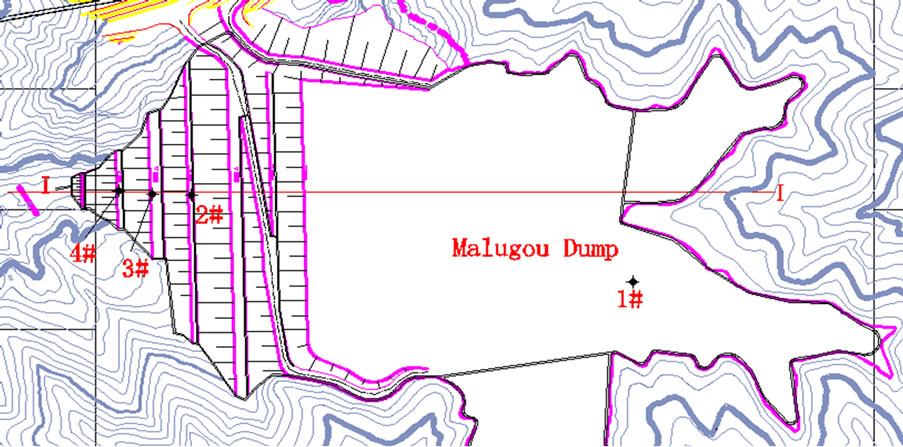
Figure 2. Testing points of Malugou dump.
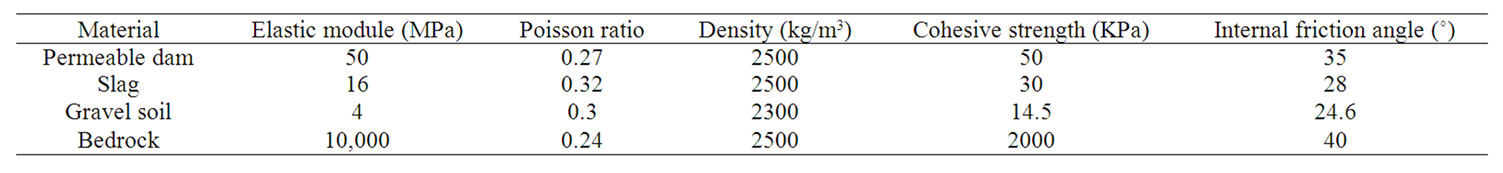
Table 1. Parameters of dumping materials.
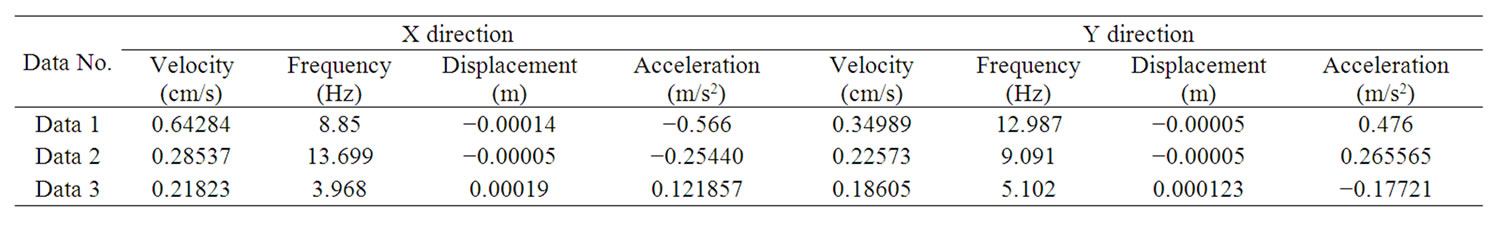
Table 2. Testing data from testing point 4.
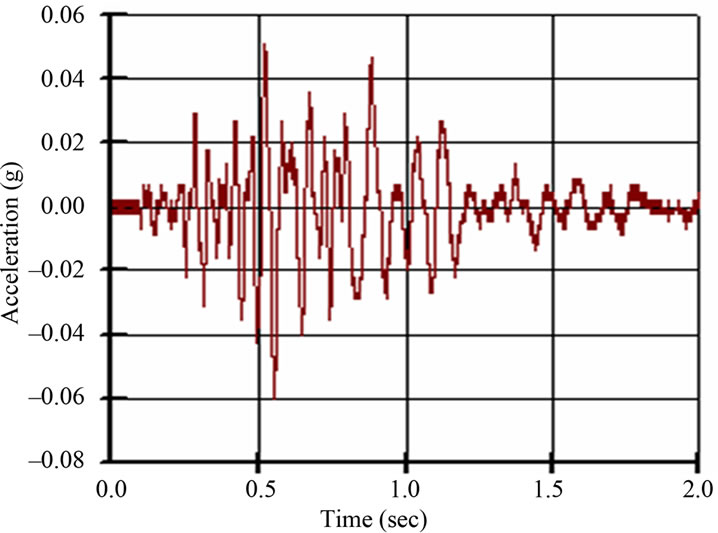
Figure 3. Measured acceleration time history curve of X direction.
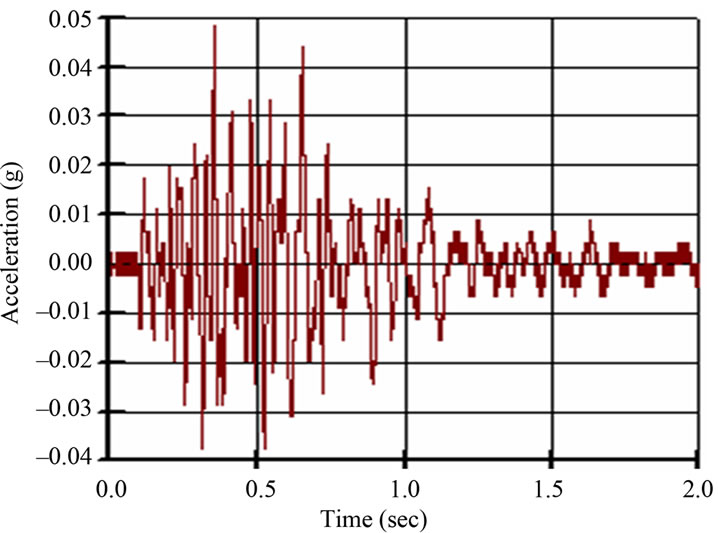
Figure 4. Measured acceleration time history curve of Y direction.
The stress contour of dump is analyzed and the results are shown in Figures 5-7, and the horizontal displacement is simulated and the displacement time history curve is shown in Figure 8.
The displacement time history curve (Figure 9) can be obtained by taking a fist-order integral to the measured velocity data with blasting vibration analysis software. Comparing Figure 8 with Figure 9, a conclusion can be drawn that the values at corresponding moments are almost the same but with contrary symbols. The reason for that is the forward direction defined in monitoring and simulation is opposite. The maximum displacement simulated is 0.000132 m, and the maximum displacement integrated is 0.000134 m.
The safety factor time history curve (Figure 10) and the critical slip surface (Figure 11) of dump under blasting vibration can be simulated by Geo-studio.
The stability analysis of fully saturated dump under blasting vibration shows that the minimum safety factor is 1.15772, and the maximum is 1.15792.
Repeating the operation mentioned above with data 2 and data 3, the safety coefficient can be obtained, shown in Table 3. The static safety factor of fully saturated dump is about 1.158, which meets the request of Chinese regulation of mine dump. And a conclusion can be drawn that the blasting vibration has little effect on the stability of dump, and the dump is safe.
3. Stability Forecast of Malugou Dump
According to the physical and mechanical parameters of fully saturated materials of Malugou dump in Table 1, if
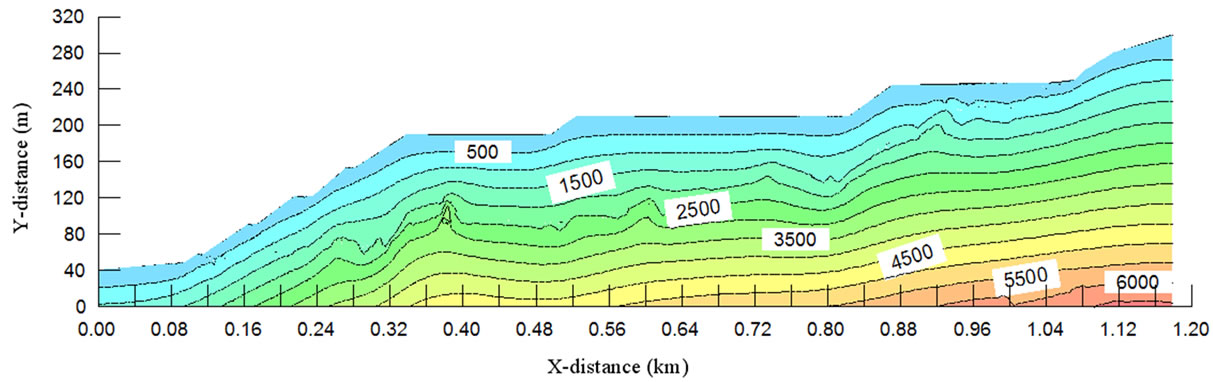
Figure 5. Vertical stress contour of Malugou dump under blasting vibration (KPa).
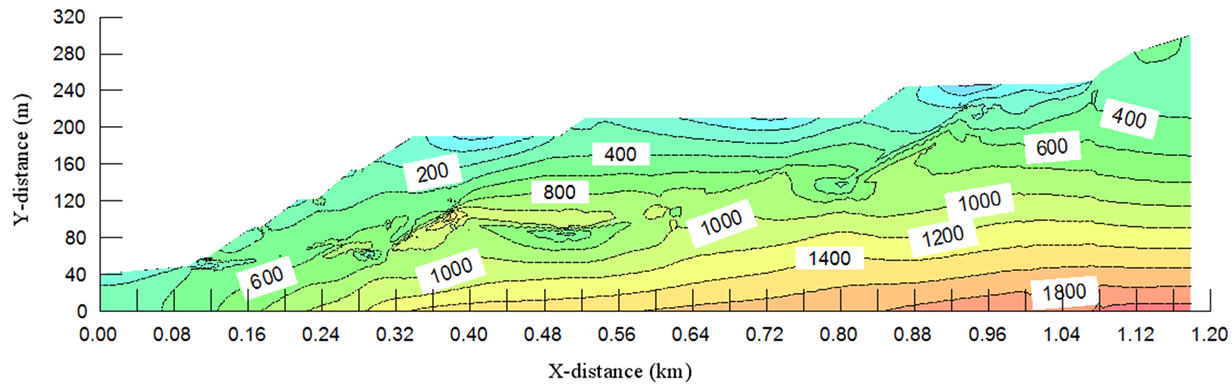
Figure 6. Horizontal stress contour of Malugou dump under blasting vibration (KPa).
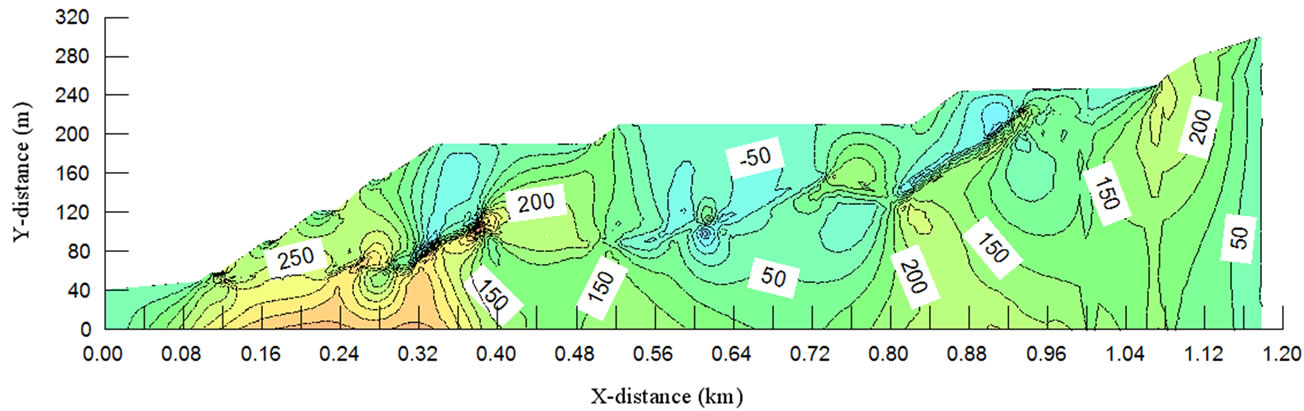
Figure 7. Shear stress contour of Malugou dump under blasting vibration (KPa).
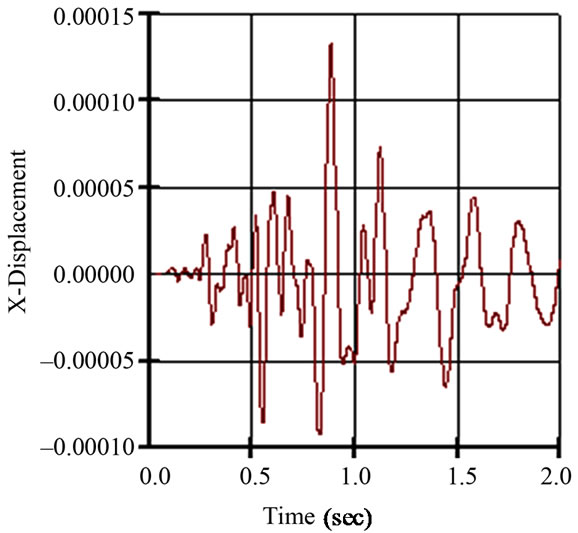
Figure 8. Simulated horizontal displacement time history curve (m).
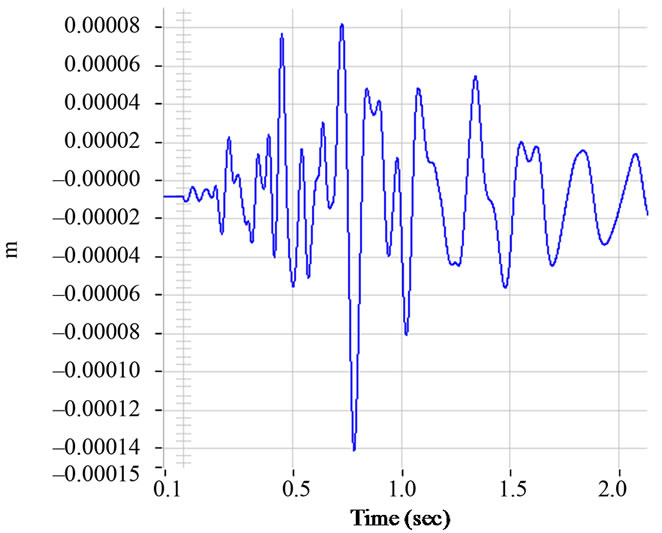
Figure 9. Measured horizontal displacement time history curve (m).
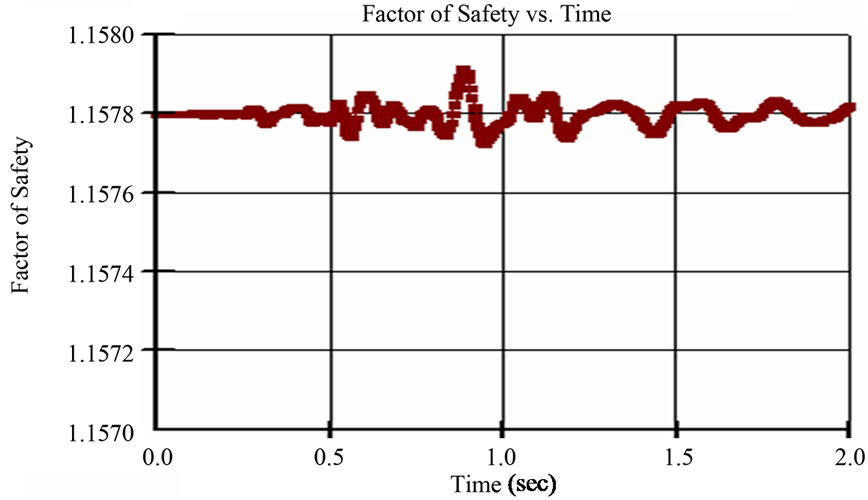
Figure 10. Safety factor time history curve.
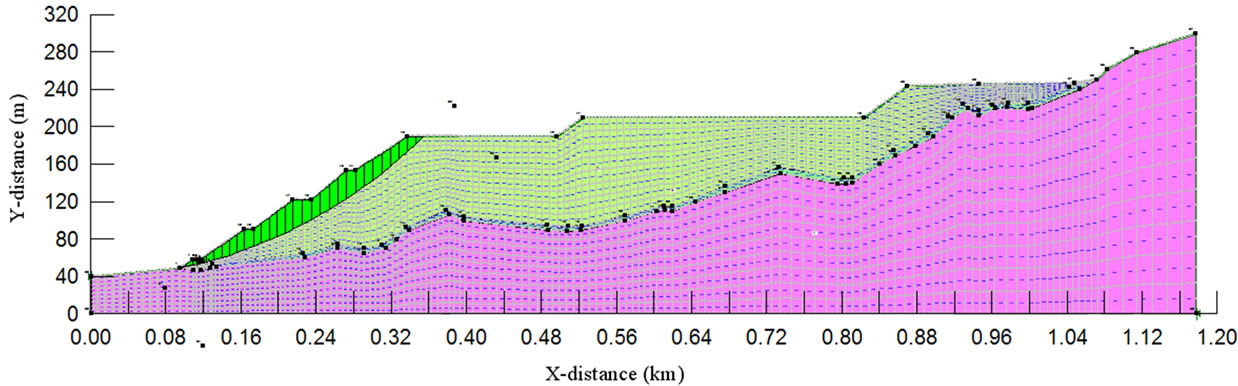
Figure 11. Critical slip surface.
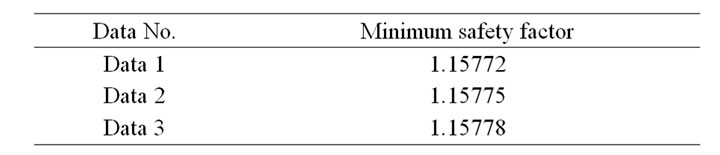
Table 3. Simulated results of dump stability under blasting vibration.
the values of initial horizontal and vertical acceleration time history curves (Figures 12 and 13) are magnified with 10 times, 50 times, 100 times, 500 times, 1000 times and 2000 times respectively, the safety factor time history curves (Figures 14-20) and critical slip surface (Figure 21) can be obtained by simulating with Geo-studio.
The minimum safety factors related to accelerations with different magnifications are listed in table 4 and the relation curves of acceleration and minimum safety factor are shown in Figures 22 and 23.
Figures 22 and 23 show that the safety factor of dump
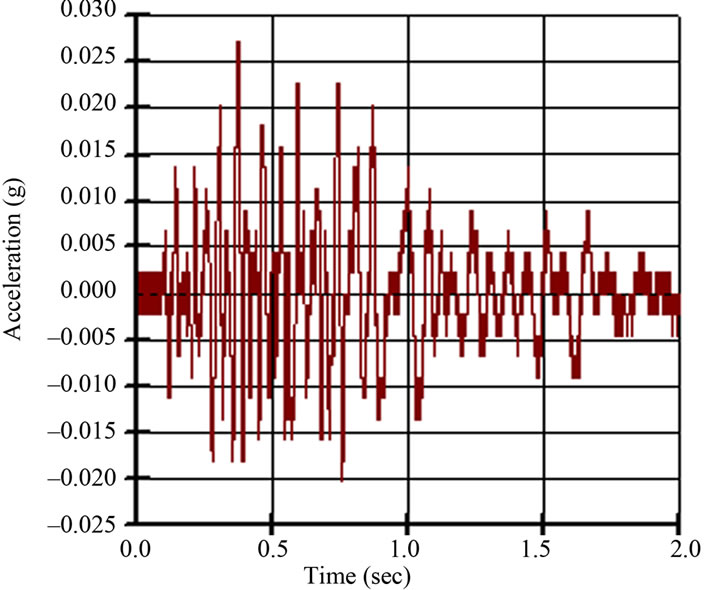
Figure 12. Initial acceleration time history curve of horizontal direction.
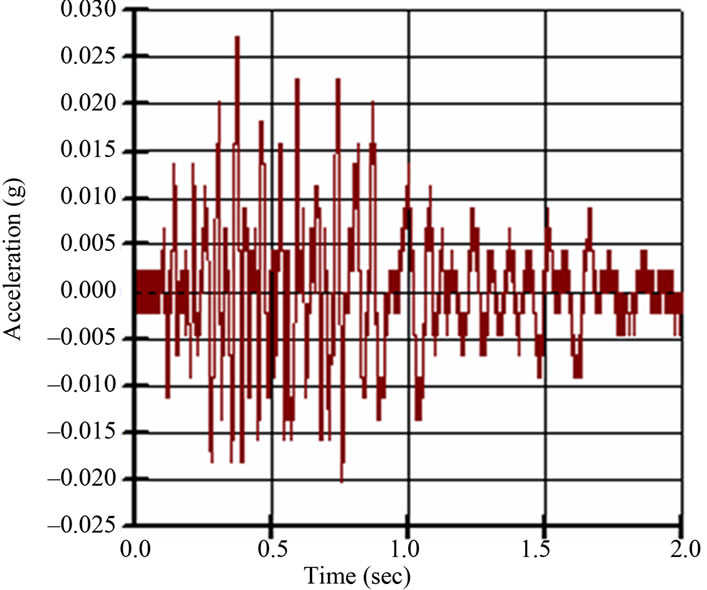
Figure 13. Initial acceleration time history curve of vertical direction.
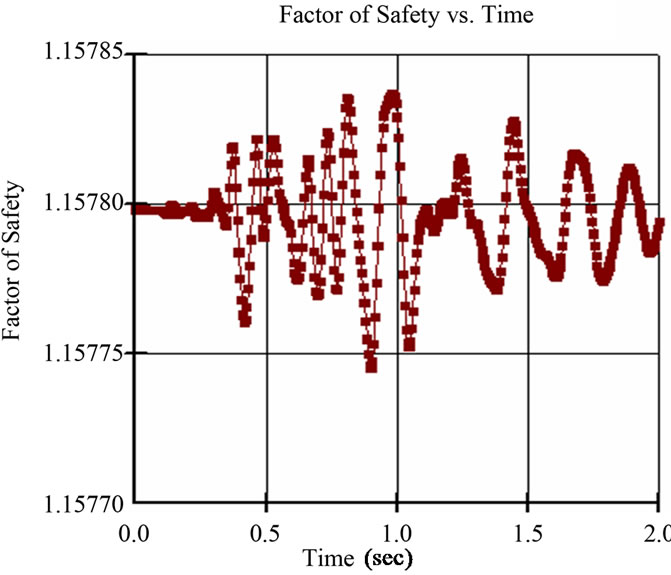
Figure 14. Safety factor time history curve of initial data.
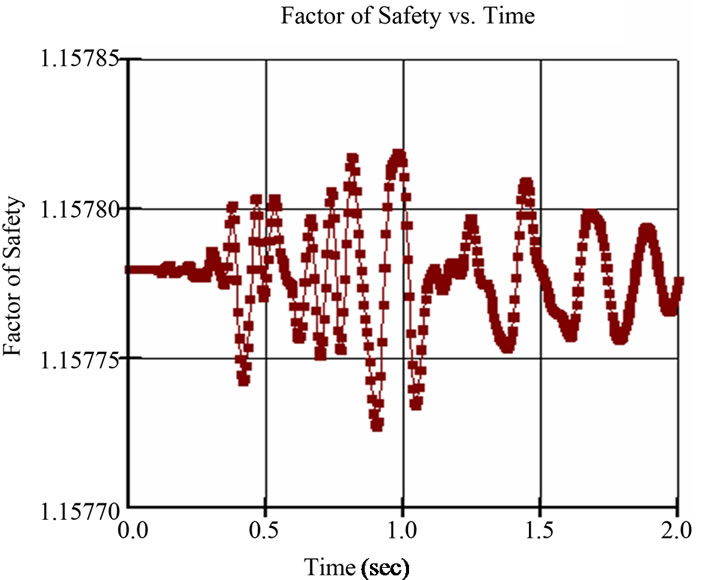
Figure 15. Safety factor time history curve with magnification of 10 times.
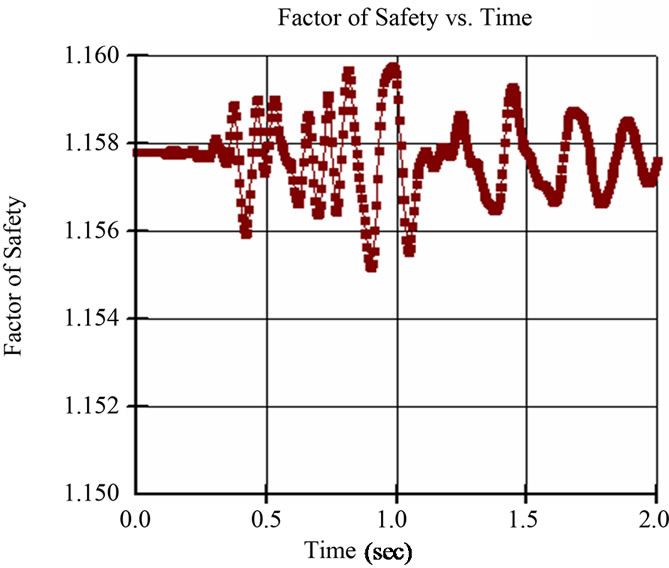
Figure 16. Safety factor time history curve with magnification of 50 times.
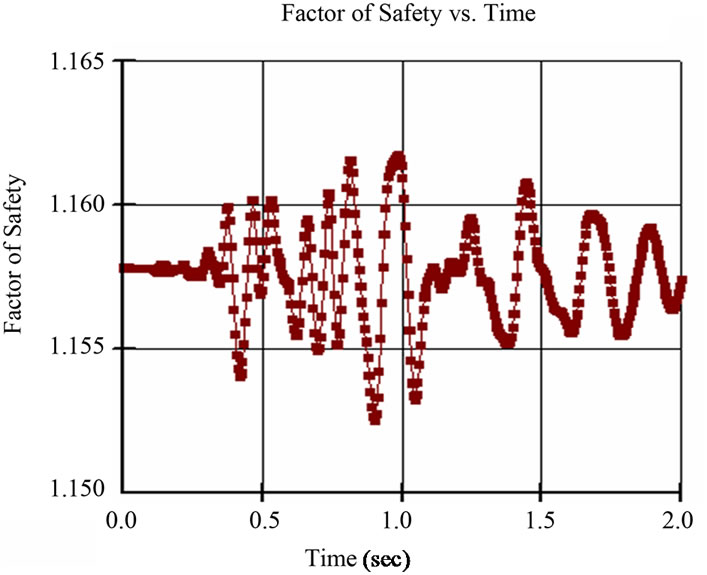
Figure 17. Safety factor time history curve with magnification of 100 times.
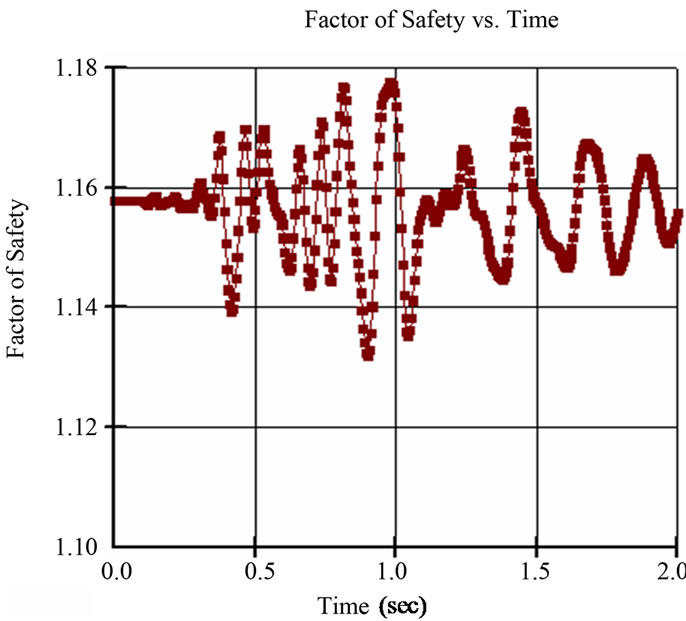
Figure 18. Safety factor time history curve with magnification of 500 times.
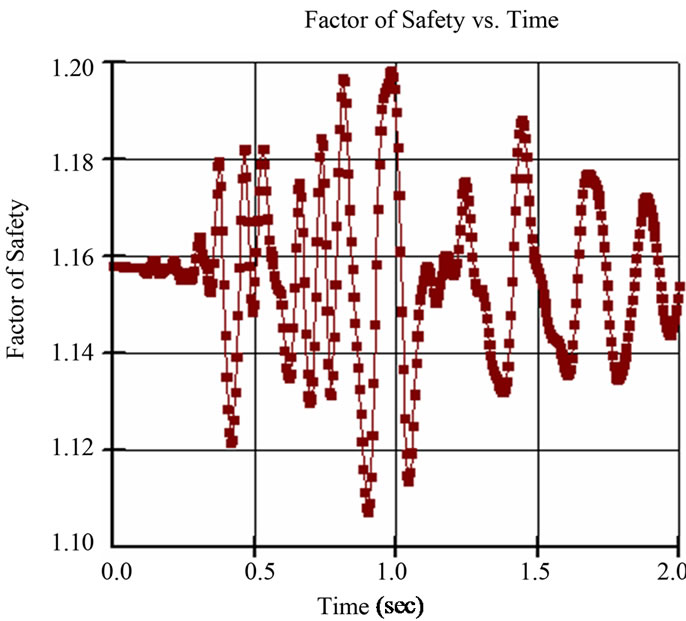
Figure 19. Safety factor time history curve with magnification of 1000 times.
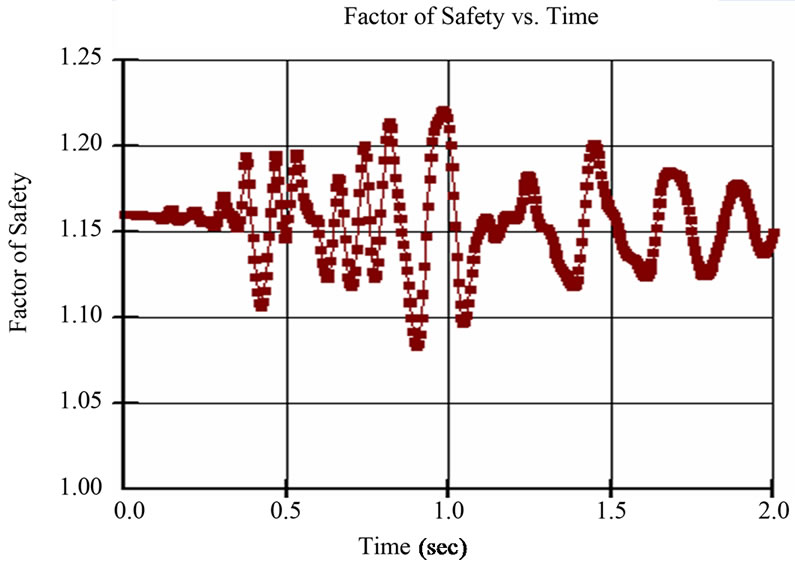
Figure 20. Safety factor time history curve with magnification of 2000 times.

Figure 21. Critical slip surface of dump under blasting vibration.

Table 4. Minimum safety factors related to different accelerations.
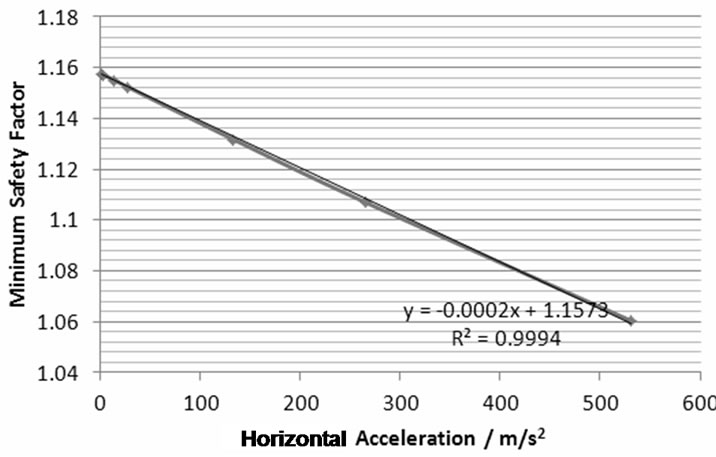
Figure 22. Relationship between horizontal acceleration and minimum safety factor.
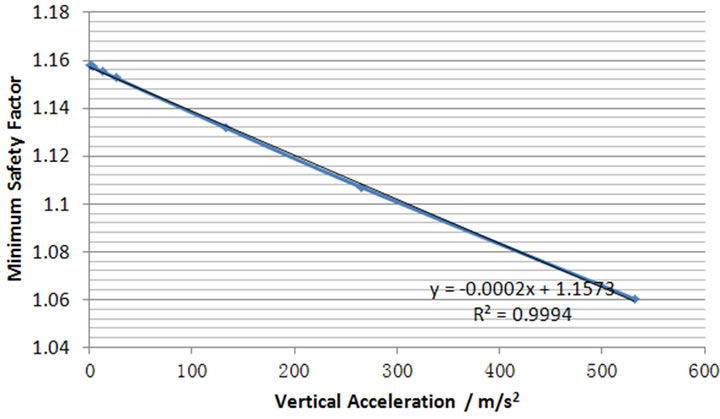
Figure 23. Relationship between vertical acceleration and minimum safety factor.
under blasting vibration linearly decreases with the increase of blasting vibration acceleration. And a linear equation between acceleration and the minimum safety factor can be drawn as follows.
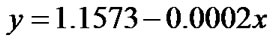 (1)
(1)
According to the regression treatment of tested data, the relationship between safety factor (Fs) and maximum single explosion charge (Q), the horizontal distance between testing points and blast source (R) and elevation difference (H) can be obtained as follows.
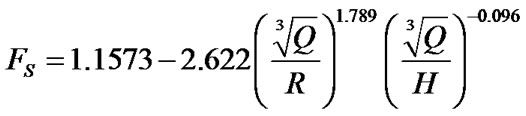 (2)
(2)
From the equation above, the safety factor of the dump under the production blasting can be calculated as long as the maximum single explosion charge, the horizontal distance between testing points and blast source, and elevation difference are known, which is an effective method to guide the production blasting of Jinduicheng molybdenum mine.
4. Conclusions
The dynamic stability of fully saturated Malugou dump under blasting vibration from Jinduicheng Molybdenum open pit mine is analyzed with Geo-studio software. And different safety factor time history curves with the change of accelerations are obtained from the simulation.
The results of the simulation indicate that under the blasting vibration of present production blasting, the Malugou dump is safe, and the present blasting vibration has little effect on the stability safety factor of the dump, which basically maintains a constant value of 1.158. And the minimum safety factor of dump under blasting vibration linearly decreases with the increase of blasting vibration acceleration.
An equation between the safety factor of dump and maximum single explosion charge, the horizontal distance between monitoring points and blast source, and elevation difference is obtained based on numerical simulation and regression analysis, which is helpful to the production blasting in Jinduicheng Molybdenum mine.
REFERENCES
- H. p. Liu, “Dynamic Stability Analysis of Manual-filling High Slope in Jinduicheng,” master thesis, Chang’an University, Xi’an, 2003.
- S. g. Sun and H. Yang, “Slope Stability Controlling Technology of Typical Dumps,” Metallurgical Industry Press, Beijing, 2011.
- G. w. Ma, “Stability Analysis of Jinduicheng Open-Pit Mine’s Dump,” Metal Mine, Vol. 338, No. 8, 2004, pp. 32-34.
- Z. h. Yin, “Analysis on the Stability of Superhighway Landslide in Earthquakes,” Journal of Chongqing Institute of Technology (Natural Science Edition), Vol. 21, No. 9, 2007, pp. 92-95.