Open Journal of Immunology
Vol.3 No.1(2013), Article ID:28674,7 pages DOI:10.4236/oji.2013.31003
Levels of TNF-α, IL-1β, TGF-β, and IL-6 in patients with chronic hepatitis C virus infection and hyperinsulinemia
![]()
1Department of Cell and Tissue Biology, Faculty of Medicine, National Autonomous University of Mexico, Mexico City, Mexico
2Department of Gastroenterology, H.R. “Lic. Adolfo López Mateos”, Institute of Security and Social Services for State Workers, Mexico City, Mexico
3Institute of Scientific Research “Hans Selye”, Querétaro, Mexico
4Department of Biochemistry, National Institute of Respiratory Diseases “Ismael Cosío Villegas”, Mexico City, Mexico
*Corresponding Author: nnooee@gmail.com
Received 5 November 2012; revised 23 December 2012; accepted 9 January 2013
Keywords: Hepatitis C; Inflammation; Hyperinsulinemia; Nitric Oxide; Type 2 Diabetes Mellitus
ABSTRACT
Background: Previous evidences support to inflammatory process associated with the IR those important factors in the development of fibrosis and hepatic damage in patients with HCV infection. Objectives: Determine the presence of immunological or histological differentces between hyperinsulinemic and non-hyperinsulinemic chronic HCV-infected patients with at least 10 years of evolution. Material and Methods: The body mass index, Child-Puigh score, liver function tests, and biochemical profile were evaluated in 30 control, 40 chronic HCV-infected patients with hyperinsulinemia, and in 40 normoinsulinemic chronic HCV-infected patients with at least 10 years of evolution. In addition, HCV genotype and viral load were established with the Amplicor System. In addition, nitrites in plasma, and TNF-α, IL-1β, TGF-β, IL-6, and insulin levels were determined. Results: No differences were found in BMI, Child-Pugh “A” scores, ALT, viral load, or genotype between the hyperinsulinemic (>25 IU/ml) and normoinsulinemic (<25 IU/ml) patients. Hyperinsulinemia patients had a higher HOMAIR value (13.6) than normoinsulinemia patients (3.4), and none had a glycemia > 126 mg/dl. Cytokines concentration did not show differences with respect to controls. Nitrites showed a slight increase only in patients with HCV infection. Conclusions: Absence of changes in the proinflammatory cytokines concentration or in some inflammation markers in chronic HCV patients with hyperinsulinemia suggests that long-term insulin levels, in presence of HCV, cannot explain by themselves the hepatic alterations observed in the patient with HCV infection, the presence of others elements (alcoholism, cirrhosis, etc.) is necessary to onset hepatic damage in these patients.
1. INTRODUCTION
Liver fibrosis, inflammation, pro-inflammatory or prothrombotic state, antiviral treatment failure, obesity, as well as insulin resistance (IR) have been observed in hepatitis C virus (HCV)-infected patients [1]. Additionally, HCV infection has been associated with type 2 diabetes mellitus (T2 DM), hypertension, and hyperlipidemia. Recent evidence has shown that abdominal obesity is an important element in the onset of IR and metabolic syndrome. Today, the relevance of adiposetissue as an important source of pro-inflammatory molecules, such as tumoral necrosis factor alpha (TNF-α) and interleukin-1β (IL-1β), which are linked to insulin resistance, is well known [2]. Insulin resistance and hyperinsulinemia have been reported in patients with T2 DM and chronic C hepatitis [3]. Likewise, insulin resistance and high HOMA scores have been determined in patients with hepatitis C [4]. On the other hand, the frequency of T2 DM is higher in patients with chronic HCV infection in comparison to hepatitis B patients [5]. Besides, insulin resistance has been linked with the presence of high levels of mRNA of genotypes 1 and 4 of HCV [6]. For this reason, the association between IR severities with high viral load has been suggested. In 2004, Lecube et al. [7], showed that patients chronically infected with HCV present an increased risk of developing impaired glucose metabolism when IR occurred during the very early hepatic damage.
Liver damage induced by HCV has been linked with the presence of reactive oxygen species (ROS), this increase in ROS synthesis activates the NF-kB pathway, leading to an increase in the synthesis of TNF-α and IL- 1β, which are linked to a diminishing sensitivity to insulin, as well as with the occurrence of liver steatosis in patients with hepatitis C [8]. The mentioned cytokines induce synthesis of nitric oxide (NO), which is another significant antiviral and oxidant agent, and is synthesized by mononuclear cells of HCV patients [9]. It is relevant to mention that IFN-α treatment of patients with hepatitis C is associated with a significant increase in nitric oxide synthase (NOS) activity, as well as with increased NOS antigen content and NOS mRNA content in mononuclear cells. Recent evidence supports the relevance of IR as one of the leading elements for severe fibrosis in patients infected with HCV [10]. In addition, high insulin concentration has been linked with harmful effects on the treatment of chronic infection by HCV [11]. In consequence, the role played by high insulin levels, IR, HCV, or proinflammatory cytokines in the development of T2 DM in the patient infected with HCV is not understood completely yet. The aim of this work was to determine the presence of immunological or histological differences between hyperinsulinemic and non-hyperinsulinemic chronic HCV-infected patients with at least 15 years of evolution.
2. MATERIAL AND METHODS
2.1. Patients
We selected from patients cared for at the Gastroenterology Department of the Hospital Regional “Lic. Adolfo López Mateos”, ISSSTE, during January 2009 to January of 2011, only those referring a history of chronic HCV-infection with at least 10 years of evolution (according to Hospital records) and who were not receiving medical treatment at the time of the study. The HCV infected patients were divided in two groups according to their serum insulin level; Cardona-Muñoz et al. [12], report that the cutoff value for healthy Mexican individuals has been set at 17 ± 4.5 µIU/ml, with the upper limit at 24 μIU/ml. Individuals with insulin fasting values equal or greater than 25 µIU/ml were considered hyperinsulinemic and were included in group A, those with lower values were included in group B. The diagnosis of HCV infection was re-confirmed in all patients by serologic and molecular diagnoses (PCR) for hepatitis C virus. The hepatic disease stage had been identified previously through the Child-Pugh score. Viral load was determined with the Amplicor System (Roche) with a cutoff value of <50 IU/ml. The presence of cirrhosis was corroborated by a liver biopsy in the patients with HCV infection. Thirty healthy individuals of similar age were selected, and who had an insulin value below 25 IU/ml served as control. Patients with HIV infection, autoimmune hepatitis, primary biliary cirrhosis, decompensated cirrhosis, overt hepatic failure, current alcohol misuse or history of alcohol misuse, psychiatric condition, or evidence of hepatocellular carcinoma were excluded from the study. The protocol was conducted in accordance with the Helsinki declaration and with the approval of the ethics committee of the Hospital Regional “Lic. Adolfo López Mateos”, ISSSTE. All patients and control individuals signed a written informed consent.
2.2. Body Composition
Patients were indicated to fast at least 8 h, to not carry out any type of exercise during 5 d before evaluation, and to empty the bladder and bowels before testing. Body mass index (BMI, kg/m2) was determined.
2.3. Biochemical Profile
Blood samples were obtained after an overnight fast (12 h minimum). A complete biochemical plasma profile (total cholesterol, triglycerides, liver function tests, i.e., aspartate amine transferase [AST], alanine amine transferase [ALT], total bilirubin, glucose, and insulin) was obtained. Routine biochemical tests were performed using manual enzymatic assays (Human Gesellschaft für Biochemica und Diagnostica mbH, Germany). Insulin levels were detected by enzyme immunoassay (Dako Cytomation Ltd., Denmark House, UK). Insulin resistance was evaluated by the “Homeostasis Model of Assessment” (HOMA) according to the formula described by Yokohama et al. [13].
2.4. Nitric Oxide (NO) Determination
The concentration of nitrites in patients and control individuals was determined in plasma using the Griess reagent (Sigma). Briefly, 96-multiwell tissue culture plates with 100 μl of plasma and 100 μl of the reagent were incubated for 15 min, and then absorbance was evaluated at 540 nm in a 96-multiwell plate EL-311 enzymelinked immunosorbent assay reader (Bio-Tek Instruments, Winooski, VT). The concentration of nitrites was obtained by comparison with a standard curve of sodium nitrite.
2.5. Serum Cytokines
Extracellular immunoreactive tumoral necrosis factor- α (TNF-α), interleukin-1β (IL-1β), transforming growth factor-beta (TGF-β), and interleukin-6 (IL-6) were determined with commercially available kits (R&D Systems, Minneapolis, MN, USA), following manufacturer’s instructions. The detection range of the assay is 3.1 - 300 pg/ml for IL-6 and 15.6 - 1000 pg/ml for TNF-α. Normal values for cholesterol are 140 - 239 mg/dl, triglycerides 35-135 mg/dl, albumin 3.8 - 5.1 g/dl, platelets 150 a 450 × 103/μl, ALT 10 - 40 IU/ml. At the end of the procedure, the plates were read at 450 nm with a 570 nm correction in the EL-311 ELISA reader. Results were expressed as nanogramsper milliliter (ng/ml) and analyzed with BioTek’s Gen5 software.
2.6. Statistical Analysis
Numeric data were grouped by means ±SD. Results were evaluated by Student’s t test using SPSS release 12, and by Kruskall Wallis test using GraphPad Prism v5.03. P < 0.05 was considered statistically significant.
3. RESULTS
Patient’s Characteristics
Two groups of 40 HCV-infected patients, based on their serum insulin concentration, were compared. The cut-off value was established at 25 IU/ml. The average insulin value of group A (hyperinsulinemic patients) was 65.7 ± 9.6 IU/ml, whereas group B patients and controls had a lower insulin concentration (16.2 ± 1.6 and 17.3 ± 0.7 IU/ml, respectively). The differences between group A values and group B or controls were statistically significant (P < 0.001). Figure 1(a) shows the insulin levels in plasma in controls and both HCV-infected group.
There were no gender or age differences among the groups. The mean body weight was higher in group A patients in comparison to the control group (P < 0.004); group B individuals had a higher value although not statistically significant in comparison to the control group (71.4 ± 2.4 and 67.8 ± 5.9 vs. 58.6 ± 2.0, P < 0.0001). Mean body mass index in the control group was lower than in both HCV-infected groups (28.2 ± 1.1 and 27.1 ± 1.7 vs. 22.3 ± 0.6, P < 0.004). The number of individuals with HCV genotype 1 or 2 was similar in both groups and there was no statistical difference in the amounts of HCV RNA values between both groups.
Although the number of patients with cirrhosis was higher in group B than in group A (11 vs. 8), the presence of liver damage assessed by ALT values was similar in both groups of patients with HCV infection, although a slightly increase in its concentration was determined in patients of group A (P < 0.003). Additionally, the evaluation by USG showed diffuse hepatic damage, gastritis and esophageal varices in 32 patients of group A as well as in 28 patients of group B, with clinical liver disease but without cirrhosis. The eight patients of group A and 11 patients of group B with cirrhosis has besides hepatic chronic damage, level IV esophageal varices and bleeding of digestive tube.
The HOMA value was statistically different among the three groups (13.6 ± 10.2 for group A, 3.4 ± 1.3 for group B, and 3.1 ± 0.6 for the control group; P < 0.0001). Cholesterol values did not show significant changes, whereas triglycerides were within normal values, although a higher concentration was observed in group B patients (Table 1). Albumin values were within the normal range in the three groups. Glucose was elevated only in four of the HCV patients of group A and in three of group B; glucose levels were within the ≥ 110 < 126 mg/dl threshold and none was receiving diabetes treatment.
The mean platelet count was statistically lower in both HCV-infected groups, being significantly lower in group A individuals (161 vs. 206 k/µl in group A vs. B patients), suggesting the a non-decompensated status of HCV patients.
Since an elevated BMI and a chronic viral infection have been linked with a chronic inflammatory status, we evaluated some of the most important inflammationrelated cytokines in patients with hepatitis C. However, we found that none of the patients included in group A or B had elevated serum values of TNF-α (Figure 1(b)), IL-1β (Figure 2(a)), TGF-β (Figure 2(b)), or IL-6 (Figure 3). Control individuals had similar detectable serum concentrations of these cytokines.
 (a)
(a)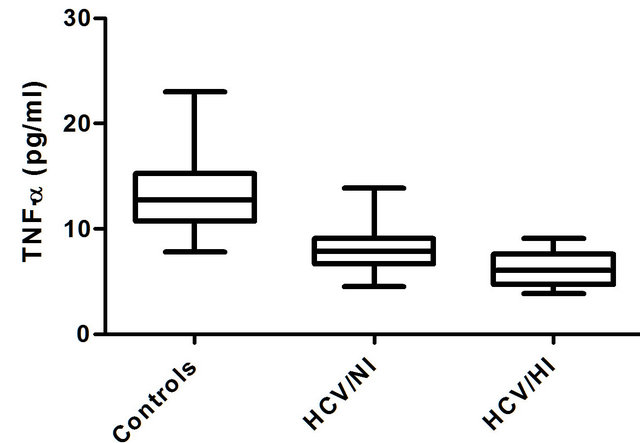 (b)
(b)
Figure 1. Plasma levels of insulin (a) in controls, hepatitis C virus normo-(HCV/ NI) or hyperinsulinemic (HCV/HI) patients. Plasma levels of TNF-α (b) in controls, HCV/NI or HCV/HI. Statistical analysis was made using Kruskall Wallis test. *P < 0.001.
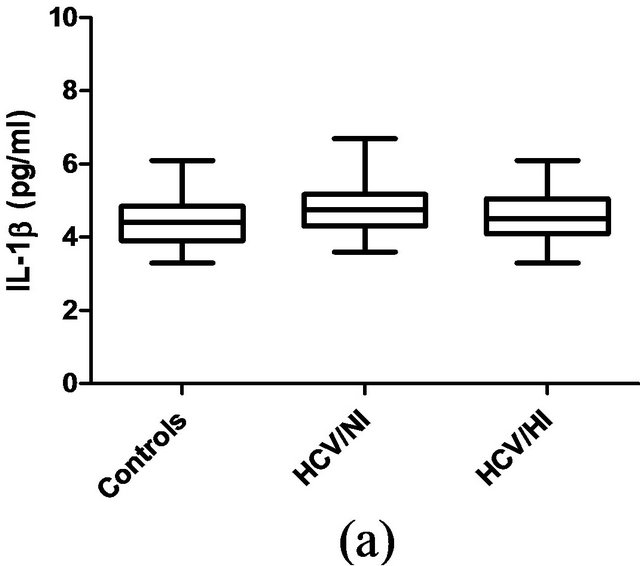
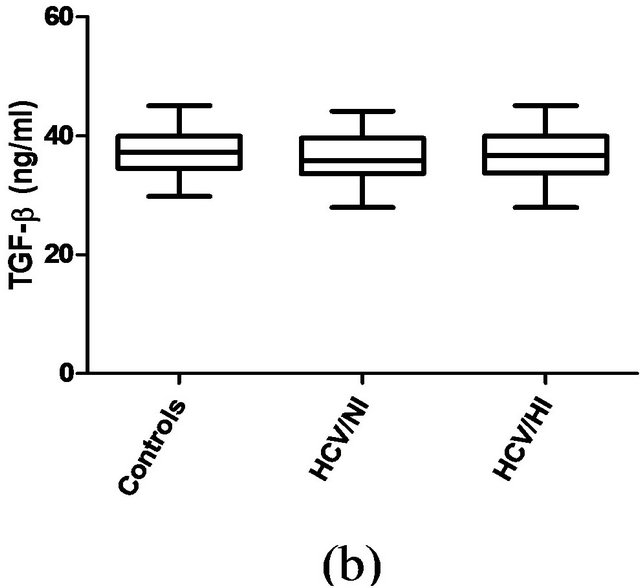
Figure 2. Plasma levels of IL-1β (a) or TGF-β (b) in controls, HCV/NI or HCV/HI patients. The statistical analysis by Kruskall Wallis test not showed significant differences. P > 0.05.
Table 1. Characteristics and serum values of hyperand normo-insulinemia HCV patients.

Normal values for cholesterol are 140 - 239 mg/dl, triglycerides 35 - 135 mg/dl, albumin 3.8 - 5.1 g/dl, platelets 150 a 450 × 103/μl, ALT 10-40 IU/ml. Statistical analysis was made using student T test, a is the comparison between A and B groups (P<0.001), b between groups A and the control group (P < 0.001), c between group B and the control group (P < 0.003).
Since insulin is known to regulate nitric oxide secretion and the latter may act as an antiviral and anti-inflammatory molecule, we decided to evaluate the serum concentration of metabolites derived from nitric oxide (nitrites are considered an adequate index of NO synthesis). Interestingly, there was a statistically significant diff erence between control and both HCV patient groups
(3.4 ± 0.4 vs. 11.0 ± 1.6 for group A and 11.3 ± 2.6 µmol/l for group B; P < 0.03).
4. DISCUSSION
Despite some evidence linking T2 DM to patients infected with HCV, other authors have failed to demonstrate this association [14]. It has been suggested that
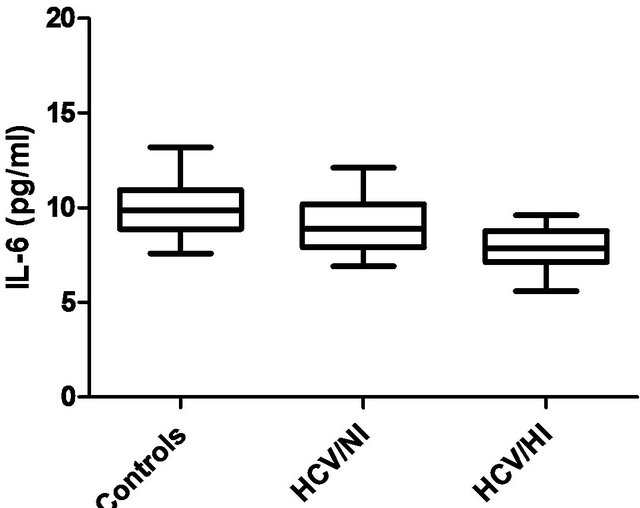
Figure 3. Plasma levels of IL-6 in controls, HCV/NI or HCV/HI patients. Plasma levels of IL-6 were analyzed using Kruskall Wallis test. *P > 0.05.
chronic infection with hepatitis C virus can induce insulin resistance (IR), thus contributing to steatosis, progression of fibrosis, onset of DM, and resistance to interferon therapy [7].
In addition, other factors associated with fibrosis progression in the HCV patient are older age, consumption of alcohol, viral coinfections, and duration of infection. It is relevant to mention that metabolic markers, such as insulin resistance or type 2 diabetes, have been considered lately as other important factors involved in the progression of hepatic damage [15], suggesting that progression of hepatic damage in patients with HCV infection can be a consequence of insulin resistance ratherthan the viral infection per se [16].
The contradictory results on the association between hepatitis C infection and T2 DM, have raised the interest in evaluating the presence of other elements, possibly linked with the inflammatory process in patients chronically infected with the HCV. For this reason, in our study, we evaluated patients coursing with the infection for at least 10 years, all without antiviral treatment in the last year, and who sought medical care because of reactivation of the clinical symptomatology. Although our results showed statistically significant differences between controls and HCV patients in the HOMA-IR and insulin concentration, only four patients of the hyperinsulinemic group (group A) and three of the normoinsulinemic group (group B) showed a slight increase in glucose concentration (glucose > 110 < 126 mg/dl). These levels of fasting plasma glucose are considered as impaired fasting glucose (IFG) according to the American Diabetes Association criteria. High concentration of insulin or HOMA-IR were observed mainly in the patients from group A, which showed more overweight and BMI compared to group B patients or controls. It is relevant to mention the presence of IR in obese patients in the absence of another pathologic entity [17].
Elevated ALT and nitrites are considered markers of inflammation and hepatic damage; however, doubts about the real clinical significance still exist. Some data have shown that 20 to 40% of hepatitis C virus RNA patients will have a normal ALT concentration [18]; this limits the usefulness of ALT levels as markers of liver damage in these patients. Our results show significant differences in ALT concentration. However, we did not achieve the levels reported in other works, which have shown levels of 167 IU/ml in non-diabetic patients with chronic hepatitis C [19]. The latter could suggest a milder inflammatory process [20]. TNF-α inhibits the function of the insulin receptor and promotes insulin resistance favoring a state of hyperglycemia, hyperin sulinemia, and enhanced liver steatosis [21]. We expected increased TNF-α values but, however, we did not find them. Nitrites were moderately increased in both the normoand hyper-insulinemic HCV patients as compared to control individuals (11.0 ± 1.6 and 11.3 ± 2.6 vs. 3.4 ± 0.4 μmol/l). Our results suggest an attenuated synthesis of NO in response to the presence of HCV.
It has recently been suggested that IR is induced by chronic HCV infection more than contributing to, which requires the coexistence of hepatitis, steatosis, and/or fibrosis [18]. Development of hepatic steatosis induces a faster progression of hepatic disease and reduces the sustained virological response to treatment with pegylated interferon plus ribavirin, which has been associated with insulin resistance in patients infected with HC [22]. Other major differences were the relatively higher ALT concentration, but slightly low platelet values of hyperinsulinemic patients vs. normoinsulinemic individuals. With such differences, we would expect a higher ChildPugh score in hyperinsulinemic patients but, interestingly, this was not the case.
The conflicting results, obtained regarding the association between T2 DM and chronic HCV infection still remain to be elucidated. It has been recognized that the control of excessive synthesis, as well as the response to TNF-α, can delay the development of T2 DM [23]. It could well be that the development of diabetes mellitus is a consequence of the hepatic damage in later phases of the disease, derived from the high insulin concentration and not as consequence of the presence of the virus. Behrendt and Ruiz [24] reported that hyperglycemia in patients with hepatitis C does no show the classical phenotype; also they emphasize the association between HCV patients and the family history of diabetes or the presence of diabetes mellitus. Moreover, they showed an inverse relation between HCV with the presence of impaired fasting glucose. It could suggest that hyperinsulinemia in early phases of the infection is a protection mechanism that decreases proinflammatory and increases anti-inflammatory cytokines synthesis and attenuates the inflammatory process. When this mechanism is inhibiting, it induces the onset of steatosis and fibrosis and later on the onset of diabetes mellitus in the HCV patient [25]. However, we cannot to ignore that recently has been showed at the increase in one unit of BMI, it is linked with the increase in the levels of insulin, which could be explain the insulin levels observed in the patients of group A.
Although the presence of hyperinsulinemia for long periods of time could be linked with the onset of hepatic damage in the patient with HCV type 1 and 2, the absence of changes in the levels of proinflamatory cytokines in our work, suggest the relevance of other factors associated with the onset of fibrosis (age, consumption of alcohol, viral coinfections, and duration of infection) [26], and with the onset of hepatic damage in the patient with chronic HCV infection. In conclusion, our results suggest the relevance of evaluate not one but numerous factors in the patient with chronic infection by hepatitis C virus, which help us to improve our comprehension about the evolution of disease in these patients
5. ACKNOWLEDGEMENTS
The authors are deeply grateful to Ms. Elba Medrano Corona for collecting the blood samples. This work was partially supported by grants IN-202508-3 from DGAPA-UNAM and CONACyT grant SALUD-2006-CO1-44569.
REFERENCES
- Imazeki, F., Yokosuka, O., Fukai, K., Kanda, T., Kojima, H. and Saisho, H. (2008) Prevalence of diabetes mellitus and insulin resistance in patients with chronic hepatitis C: Comparison with hepatitis B virus-infected and hepatitis C virus-cleared patients. Liver International, 28, 355-362. doi:10.1111/j.1478-3231.2007.01630.x
- Nieto-Vazquez, I., Fernandez-Veledo, S., Kramer, D.K., Vila-Bedmar, R., Garcia-Guerra, L. and Lorenzo, M. (2008) Insulin resistance associated to obesity: The link TNFalpha. Archives of Physiology and Biochemistry, 114, 183- 194. doi:10.1080/13813450802181047
- Oliveira, B.R., Magalhães, O., Furlanetto, T.W. and Bertoluci, M.C. (2008) Increased insulin resistance and hyperinsulinemia in patients with type 2 diabetes and chronic hepatitis C. Diabetes Research and Clinical Practice, 19, e11-e12. doi:10.1016/j.diabres.2007.08.003
- Moucari, R., Asselah, T., Cazals-Hatem, D., et al. (2008) Insulin resistance in chronic hepatitis C: Association with genotypes 1 and 4, serum HCV RNA level, and liver fibrosis. Gastroenterology, 134, 416-423. doi:10.1053/j.gastro.2007.11.010
- White, D.L., Ratziu, V. and El-Serag, H.B. (2008) Hepatitis C infection and risk of diabetes: A systematic review and meta-analysis. Journal of Hepatology, 49, 831-844. doi:10.1016/j.jhep.2008.08.006
- Sersté, T., Nkuize, M., Moucari, R., et al. (2010) Metabolic disorders associated with chronic hepatitis C: Impact of genotype and ethnicity. Liver International, 30, 1131- 1136. doi:10.1111/j.1478-3231.2010.02291.x
- Lecube, A., Hernández, C., Genescà, J., Esteban, J.I., Jardí, R. and Simó, R. (2004) High prevalence of glucose abnormalities in patients with hepatitis C virus infection: A multivariate analysis considering the liver injury. Diabetes Care, 27, 1171-1175. doi:10.2337/diacare.27.5.1171
- Ohmura, E., Hosaka, D., Yazawa, M., et al. (2007) Association of free fatty acids (FFA) and tumor necrosis factor-alpha (TNF-α) and insulin-resistant metabolic disorder. Hormone and Metabolic Research, 39, 212-217. doi:10.1055/s-2007-970421
- Hokari, A., Zeniya, M., Esumi, H., Ishikawa, T., Kurasima, Y. and Toda, G. (2005) Role of nitric oxide (NO) in interferon-alpha therapy for hepatitis C. Journal of Infection, 51, 47-53. doi:10.1016/j.jinf.2004.08.025
- Milner, K.L., van der Poorten, D., Trenell, M., et al. (2010) Chronic hepatitis C is associated with peripheral rather than hepatic insulin resistance. Gastroenterology, 138, 932-941. doi:10.1053/j.gastro.2009.11.050
- Basaranoglu, M. and Basaranoglu, G. (2011) Pathophysiology of insulin resistance and steatosis in patients with chronic viral hepatitis. World Journal of Gastroenteroogy, 17, 4055-4062. doi:10.3748/wjg.v17.i36.4055
- Cardona-Muñoz, G., Noriega-Arellano, J., HernándezChávez A, et al. (2003) Effect of ramipril on the glucose/ insulin coefficient and the ventricular mass index in patients with light to moderate arterial hypertension. Archivos de Cardiologia de Mexico, 73, 24-30.
- Yokoyama, H., Emoto, M., Fujiwara, S., et al. (2004) Quantitative insulin sensitivity check index and the reciprocal index of homeostasis model assessment are useful indexes of insulin resistance in type 2 diabetic patients with wide range of fasting plasma glucose. The Journal of Clinical Endocrinology and Metabolism, 89, 1481- 1484. doi:10.1210/jc.2003-031374
- Balogun, W.O., Adeleye, J.O., Akinlade, K.S., Kuti, M. and Otegbayo, J.A. (2006) Low prevalence of hepatitis-C viral seropositivity among patients with type-2 diabetes mellitus in a tertiary hospital. Journal of the National Medical Association, 98, 1805-1808.
- Petta, S., Cammà, C., Di Marco, V., et al. (2008) Insulin resistance and diabetes increase fibrosis in the liver of patients with genotype 1 HCV infection. The American Journal of Gastroenterology, 103, 1136-1144. doi:10.1111/j.1572-0241.2008.01813.x
- De Torres, M. and Poynard, T. (2003) Risk factors for liver fibrosis progression in patients with chronic hepatitis C. Annals of Hepatology, 2, 5-11.
- Hotamisligil, G.S. (2003) Inflammatory pathways and insulin action. International Journal of Obesity and Related Metabolic Disorder, 27, S53-S55. doi:10.1038/sj.ijo.0802502
- Tanaka, N., Nagaya, T., Komatsu, M., et al. (2008) Insulin resistance and hepatitis C virus: A case-control study of non-obese, non-alcoholic and non-steatotic hepatitis virus carriers with persistently normal serum aminotransferase. Liver International, 28, 1104-1111. doi:10.1111/j.1478-3231.2008.01737.x
- Hung, C.H., Lee, C.M., Chen, C.H., et al. (2009) Association of inflammatory and anti-inflammatory cytokines with insulin resistance in chronic hepatitis C. Liver International, 29, 1086-1093. doi:10.1111/j.1478-3231.2009.01991.x
- Lawson, A. (2010) Hepatitis C virus-infected patients with a persistently normal alanine aminotransferase: Do they exist and is this really a group with mild disease? Journal of Viral Hepatitis, 17, 51-58.
- Ohmura, E., Hosaka, D., Yazawa, M., et al. (2007) Association of free fatty acids (FFA) and tumor necrosis factor-alpha (TNF-α) and insulin-resistant metabolic disorder. Hormone and Metabolic Research, 39, 212-217. doi:10.1055/s-2007-970421
- Patton, H.M., Patel, K., Behling, C., et al. (2004) The impact of steatosis on disease progression and early and sustained treatment response in chronic hepatitis C patients. Journal of Hepatology, 40, 484-490. doi:10.1016/j.jhep.2003.11.004
- Knobler, H., Zhornicky, T., Sandler, A., Haran, N., Ashur, Y. and Schattner, A. (2003) Tumor necrosis factor-alphainduced insulin resistance may mediate the hepatitis C virus-diabetes association. The American Journal of Gastroenterology, 98, 2751-2756.
- Behrendt, C.E. and Ruiz, R.B. (2006) Hyperglycemia among persons with hepatitis C: Not the classical diabetic phenotype. Diabetes Research and Clinical Practice, 71, 68-74. doi:10.1016/j.diabres.2005.04.005
- Capeau, J. (2008) Insulin resistance and steatosis in humans. Diabetes and Metabolism, 34, 649-657. doi:10.1016/S1262-3636(08)74600-7
- Halfon, P., Pénaranda, G., Carrat, F., et al. (2009) Influence of insulin resistance on hepatic fibrosis and steatosis in hepatitis C virus (HCV) mono-infected compared with HIV-HCV co-infected patients. Alimentary Pharmacology & Therapeutics, 30, 61-70. doi:10.1111/j.1365-2036.2009.03995.x