Open Journal of Ecology
Vol.05 No.05(2015), Article ID:56464,11 pages
10.4236/oje.2015.55016
Ecophysiology of Lake Kinneret (Israel) Zooplankton
Moshe Gophen
Migal-Scientific Research Institute, Kiryat Shmone, Israel
Email: Gophen@Migal.org.il
Copyright © 2015 by author and Scientific Research Publishing Inc.
This work is licensed under the Creative Commons Attribution International License (CC BY).
http://creativecommons.org/licenses/by/4.0/


Received 8 March 2015; accepted 18 May 2015; published 20 May 2015
ABSTRACT
A summary of a long-term research of Lake
Keywords:
Kinneret, Zooplankton, Ecophysiology, Food-Web

1. Introduction
The first documented study of the Kinneret zooplankton was published by Richard in1890 in collaboration with Barrois. The next progress was done by Gurney during 1912-1913 who collaborated with Annandale. In 1935, Bodenheimer followed those studies and the next step was done during 1950 by H. Lissner, in collaboration with B. Komarovsky (Kimor). During 1956- 1961 A . Yashuv and M. Alhunis were responsible for the zooplankton monitoring in Lake Kinneret. In 1968 the Kinneret Limnological Laboratory initiated a multidisciplinary survey of Lake Kinneret of which the author was responsible for the research and monitoring of the Kinneret zooplankton. In this paper a summary of perennial integration of field data and experimental investigations of the Kinneret zooplankton is presented [1] .
2. Material and Methods
Information about monitoring, experimental conditions and biomass measurements are given in [2] -[4] and [5] . These data was implied for the computations of the total Lake population activities in relation to phytoplankton, and fish assemblages and temperature conditions [5] .
The following statistical procedures were used for the evaluations of the dynamic relations between zooplankton and phytoplankton and within zooplankton communities: ANOVA (p < 0.05), Polynomial and Linear Regressions, Fractorial Polynimial Prediction, LOWESS (0.8), and Paired t-test (p > 0.05) (STATA 9.1, Statistics-Data Analysis and Stat View 5.1, SAS Institute Inc).
3. Results
The total number of zooplankton species documented in Lake Kinneret is 34 of which 19 are the most common. The annual averages of zooplankton standing stock biomass varied between 15.6 - 48.0 g(ww)/m2, i.e. 2652 - 8160 tons (Water level 211 mbsl, surface area-164.5 Km2) for the entire lake and averaged fish stock is app. 5000 t/lake. Consequently, if daily consumption of fish is about 3% - 20% and zooplankton: 80% - 110% of their body weight zooplankton utilize much higher food quantity than fish. Population retention time of zooplankton is much shorter than that of Fish.
Species inventory: 8 species of Cladocera; 6 species of Copepoda; and 20 species of Rotifera [1] .
3.1. The Kinneret Food Web Structure
Metabolic parameters were experimentally measured and averaged for the Kinneret Food-Web compartments by incorporating published data of production, food consumption, respiration, excretion and biomass densities (concentrations) of zooplankton [1] [8] . These averaged parameters incorporated the data of the entire temperatures regime, seasonal variations, depths and locations (sampling stations). The measured parameters were converted to Carbon Content and four of them were used for the evaluation of carbon flow pattern within the food web structure: P/B―the ratio between production and biomass; Q/B―the ratio between food consumption and biomass; P/Q―the ratio between percentage efficiency and food consumption; EE―Ecological efficiency―the relative (%) portion of utilized biomass by other food web compartments from consumed energy for production. Results are given in Table 1.
The values given in Table 1 indicates the high rate of Bacterial and Protozoans’ activity: production is higher by 360 than their stock biomass and incorporation of “food”, 750 times higher than their stock biomass with high EE value. Moreover, most of the Production of Bacteria, Protozoa and Herbivorous zooplankton and Benthic Algae is consumed (>70% EE). The interrelationships within the food web [6] [7] [9] are the followings: Bacterial consumption of detritial particles; Protozoa prey Bactria, nano-phytoplankton and benthic algae; Her-

Table 1. Metabolic Ratios (see text) calculated on the basis of Carbon Content. NK = Not Known [6] -[8] .
bivorous Zoopalnkton consume nano-phytoplankton, bacteria, protozoa and detritus; Predator zooplankton prey Bacteria, Protozoa, small zooplankters and detritus; The most common fishes (Bleaks) consume zooplankton [2] [10] [11] ; Herbivore fishes consume mostly phytoplankton [12] [13] . Analysis of food requirements during 1969-1991 by the entire lake population of herbivorous zooplankton indicates an algal (edible nano-phytop- lanktonic biomass) deficit during the first century and exceeded during the next one (Figure 1 & Figure 2). Those conditions of food availability were similar between summer and winter months: comparative Paired t- test (p > 0.05) analysis between summer and winter indicated no statistical differences between summer and winter (p = 0.4890). Consequently it is concluded that during 1969-1980 complementary food resources (bacteria, protozoa, detritus) were intensively utilized by herbivore zooplankters. An experimental study of the feeding of zooplankton on Protozoa was therefore carried out. The experimental design and procedures are not given here and the principle results are presented.
3.2. Zooplankton Feeding on Protozoa
Experimented organisms were cyclopoid copepods (Mesocyclops ogunnus) cladocerans (Ceriodaphnia spp. Di-
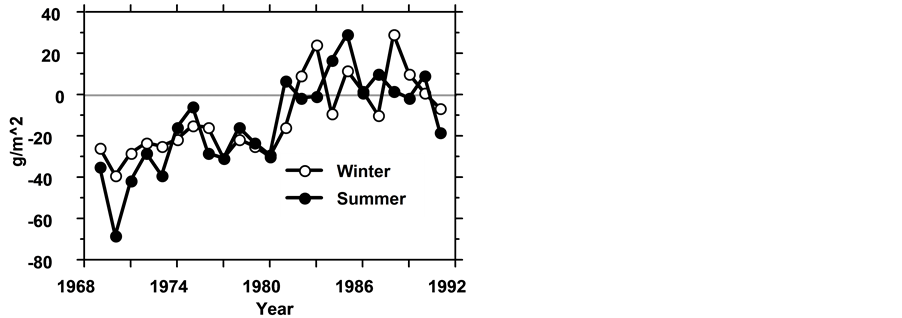
Figure 1. The Difference between annual averages of food Requirements of herbivorous zooplankters and available nano-phytoplankton [g(ww)/m2)] in winter (11, 12 & 1 - 5) and summer months (6 - 10) during 1969-1992.

Figure 2. Comparative ANOVA test (p < 0.05) of food deficiency for herbivorous zooplankters in two periods: 1) 1969- 1980; 2) 1981-1991.
aphanosoma sp. and Bosmina spp.) freshly collected in the Lake. The following parameters of zooplankton were monitored: Life span, % survival, egg production, growth rate, and number of molted exuviae. The experimental protozoans were the ciliate Colpoda sp. and not identified colorless flagellates cultured in the Algal medium SCM diluted by filtered (0.45 µ filter paper) lake water and cultured bacteria were given as food. The food given to the zooplankters included mostly Ciliates and flagellates and bacteria. Comparative feeding trial were carried out where zooplankters were given Scenedesmus spp. cultured on SCM media diluted by filtered lake water. The major results are listed: 1) When Protozoa were the only food source, cladocerans survival was 22% after 5 days whilst under same conditions but with algal food―43% survival. The molting rate (number of daily molts) of Ceriodaphnia given only protozoa was lower than those fed by Scenedesmus: 8 × 10⁻² molts per individual per day for algal feeding and 3.4 - 6.2 × 10⁻² molts per individual per day when fed protozoa. The lower rate of molting was documented also when Protozoa were given as mixture with Scenedesmus. In a 6 days incubation trial Ceridaphnia was given 4 types of food: 1) Control-no food; 2) Scenedesmus; 3) Protozoa; 4) Mixed Protozoa and Scenedesmus. Sub-samples were taken at zero time and after 6 days and body size was measured and specific growth rate (additional ww in µg per individual per day) was calculated: No food-2.70 µg (ww)/Ind./day; Scenedesmus-3.38 µg (ww)/Ind./day; Protozoa-2.68 µg (ww)/Ind./day; Mixture-3.13 µg (ww)/ Ind./day. When Ceriodaphnia was fed by Protozoa, rate of growth was higher and therefore molting rate was slower, lower number of molts and higher increase of specific growth of body size in between molts. Body size was measured as biovolume converted to mass (sg = 1). Another set of trials were carried out (7 days each) with adult females of M. ogunnus which were given 3 types of food: 1) Ceriodaphnia prey; 2) Protozoa; 3) No Food Control. Two parameters were monitored: Survival and ovaries development and/or eggs production. When food was Ceriodaphnia prey, 60% of the females developed dark ovaries with eggs, and survival was 90%. When Protozoa was the sole food source, 25% of the females developed dark ovaries and 70% survived; In the “no food” control jars 20% developed dark ovaries and 60% survived. Conclusively it is indicated that Ceriodaphnia and adult females of M. ogunnus consume protozoa but algal food sources induce higher growth and production rates. Calculations for the entire lake based on published data [5] resulted in the composition of natural food availabilities for herbivorous zooplankton, excluding phytoplankton, as followos: 27% are due to Protozoa, Bacteria, Pico-plankton and suspended particles, and 38% to degraded Peridinium during the periods it was dominant (1969-1995).
3.3. The Impact of Fish on Zooplankton Populations
In previous studies the interaction between zooplankton and fish food composition of Kinneret fishes were documented [6] [7] . The major conclusions were: Most of the Kinneret fishes are planktivorous; Piscivory level among Kinneret fishes is low, Most of the Kinneret fishes prey zooplankton intensively and only few of them (Tilapias, especially Sarotherodon galilaeus;) [7] [14] consume Peridinium efficiently. Fish predation pressure on zooplankton is mostly due to the two endemic Bleak species Mirogrex terraesanctae terraesanctae and Acanthobrama lissneri [2] [3] [7] [11] [15] . As a result of changes in the structure of the Kinneret eco-system due to Peridinium reduction [4] the diet of phytoplanktivorous species like S. galilaeus was shifted towards zooplankton consumption. Moreover it was also documented that reduction in Bleaks fishery resulted by lowered market demands, enhanced pressure on zooplankton which responded by biomass decline. Experimental study in 6 m 3 outdoor tanks loaded by lake water and plankton indicated that S. galilaeus and surplus nutrients (N & P), solely and combined, enhanced Phytoplankton production. A combination of Bleaks, and surplus Phosphorus suppressed zooplankton and enhanced phytoplankton density. The summer epilimnetic conditions in lake Kinneret was imitated in those trials confirming enhancement of nano-phytoplankton as a result of zooplankton predation by Bleaks or S. galilaeus and followed by zooplankton suppression which reduced algal consumption [12] . Similar conditions were implied during Summer (July-August) and Winter (December) Months: additional of zooplanktivorous Bleaks and Phosphorus. During winter time (20˚C - 22˚C) suppression of zooplankton by Bleaks predation together with additional P resulted significant enhancement of nano-phytoplankton densities. During Summer months (29˚C - 32˚C), the high temperature probably caused decline of food consumption by Bleaks (Bleaks in the lake inhabiting mostly deep and colder layers in summer), and inspite of surplus P, nano-phytoplankton decreased due to normal capacity of algal consumption by zooplankton. A study of the impact of Bleak biomass (6, 12, and 24 individuals per tank) was carried out in duplicates twice: 1) In spring time (March-April; 20˚C - 24˚C); and 2) In summer (July August 29˚C - 32˚C). The phytoplankton density was measured by chlorophyll determination. Significant decline of zooplankton and significantly related (p < 0.05) to fish biomass and chlorophyll enhancement whereas in summer trial chlorophyll and zooplankton declined. Conclusively, the impact of zooplankton predation by fish is indicated as factor of phytoplankton enhancement [7] [16] .
3.4. Body Size Measurements
Body size measurements were carried out during early 1970’s [8] . Twenty years later several species of Cladocera, Rotifera, adults and copepodites of M. ogunnus were measured again. The calanoid Eudiaptomus drieschi which became after 1987 a regular inhabitant of Lake Kinneret was also measured. Results are given in Table 2.
Results presented in Table 2 indicates a minor size reduction (excluding copepodites IV-V of M. ogunnus) in 1992 which probably due to intensification of fish predation pressure on zooplankton.
3.5. Long-Term Fluctuations of Zooplankton Biomass
Long-term fluctuations of zooplankton biomass were previously presented [12] [13] and indicated decline trend from 1969 to 1995 and increasing later (Figure 3). Therefore I evaluated monthly changes during 1969-1995. Results are presented in Table 3.
The long-term gradual decline of the biomass of copepods, cladocerans and consequently Total Zooplankton are clearly shown in Table 3. This statistical method indicated annual changes of monthly means of rotifer biomass as not significant.
Because adult stages of M. ogunnus are raptorial feeders which commonly prey cladocerans the biomass relations between those zooplankter groups was analyzed (Figure 4). Figure 4 represent monthly biomass relations between cladocerans and copepods which are not typical to predator-prey trait. The outcome of such relationships is predicted to be inversely related which is not the case here.
The biomass distribution of zooplankton was also expressed as concentration (g/m3) during the period of decline (1969-1995). The value ranges (Maximum-Minimum) were: Copepoda―0.02 - 3.9 g/m3; Cladocera―0.04 - 3.29 g/m3; Rotifera―0.01 × 10⁻⁴ - 1.47 g/m3; Total Zooplankton―0.21 - 7.23 g/m3; The trend of changes of zooplankton biomass concentration was evaluated by simple regression between monthly mean biomass and years, resulted the followings:
Rotifera―Not significant decline; Copepeoda―Decline, r2 = 0.235 and p < 0.0001; Cladocera, decline, r2 = 0.066, p < 0.0001; and total zoo-mass decline, r2 = 0.162, p < 0.0001. It is likely that the most affected zoop-
Table 2. Body size measurements [(mg(ww)/Ind] carried out in 1992 [mg(ww)/ind, (SD) in comparison with measurements done in 1970. Eudiaptomus drieschi measurements done in 1970 only.
Table 3. Simple regression of monthly means of zooplankton (Copepoda, Cladocera, Rotifera, Total Zooplankton) biomass (g(ww)/m2) during 1969-1995. For each month r2 (upper number) and probability (lower number) are given: S = Significant; NS = Not Significant; D = Decrease Trend; I = Increase Trend.
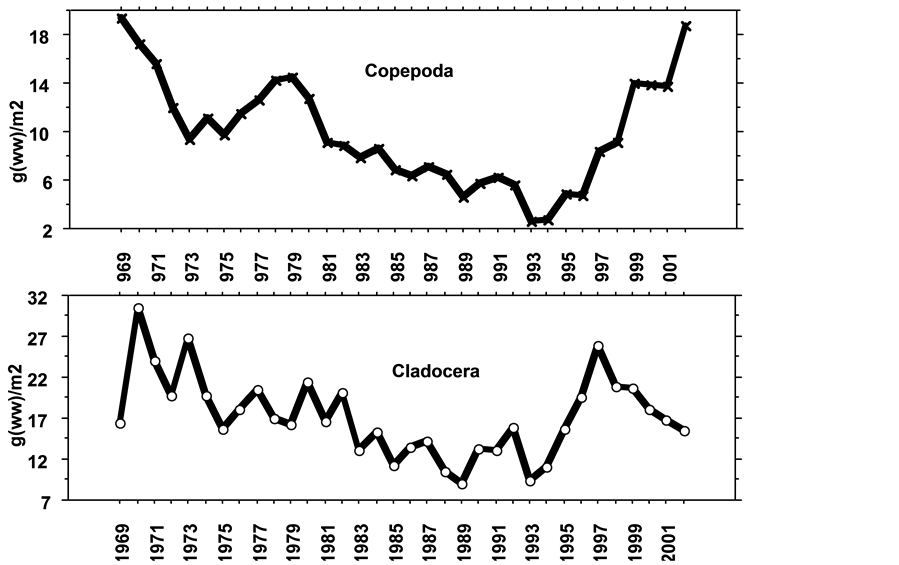
Figure 3. Annual averages of Cladocera (lower panel) and Copepoda (upper panel) biomass (g(ww)/m2) during 1969-2002 in Lake Kinneret.
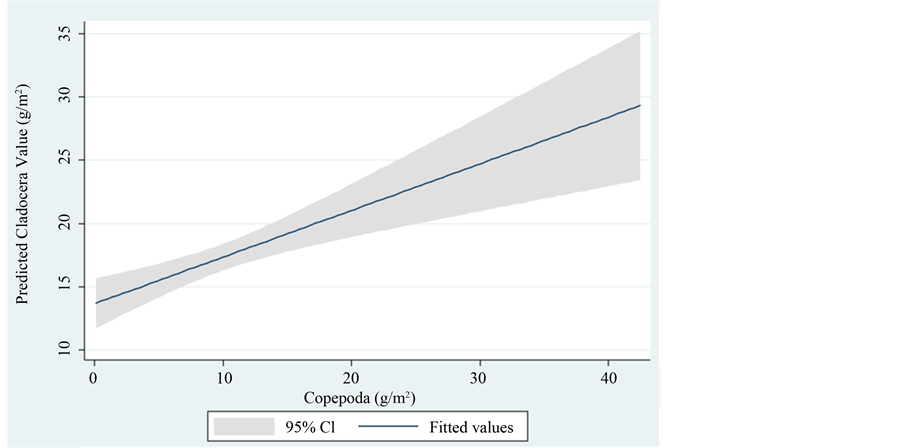
Figure 4. Linear prediction of Cladocera Biomass (g/m2) (dependent) vs. Copepoda Biomass (g/m2) (independent) in Lake Kinneret.
lankton group was Copepoda and cladocerans were also suppressed. Consequently, it is conclude that the major impact of top-down fish predation effect is dominant in controlling zoo-mass.
3.6. Zooplankton-Phytoplankton Relations
The zooplankton assemblages in Lake Kinneret are comprised of mostly herbivores (all cladocerans. copepod nauplii and copepodite 1 - 4, and rotifers) and partly of raptorial adult cyclopoid copepods. The phytoplankton populations are comprised of two functional groups: edible and non-edible organisms. The preferred food for herbivorous zooplankters are the chlorophytes and diatoms whilst Pyrrhophyta (Peridinium) and large size colonial (filamentous and other shapes) cyanophytes are not edible. Therefore the relations between zooplankton and its algal food refer to chlorophytes and diatoms [9] . Cyanophytes and Pyrrhophyta were therefore excluded. The total Phytoplankton/zooplankton (P/Z) ratio during 1969-1995 was averaged as 3.2 and later −2.7. This decline of P/Z ratio is due to lower edible phytoplankton biomass. The total averaged P/Z ratio for the entire period is 3.1. If only Cladocerans are included the ratio is 1.6. It means that a big part of the food web production is not channeled through zooplankton but probably incorporated by the Microbial-Loop (pico-phytoplankton-bacte- ria-protozoa) and fish or both. Figure 5 & Figure 6, prominently indicates the positive relation between zooplankton and available algal food. On the other hand inverse relation between those zooplankters and Cyanophyta is documented in Figure 7 & Figure 8.
3.7. Chemical Composition and Zooplankton Homeostasis
Experimental study of the impact of N/P ratio in algal cultures mediums on the compositions of the algal cells, Selenastrum spp., zooplankton body and their excretion was carried out. Three levels of N/P mass ratio were tested, 6, 12, and 36 achieved by additional ammonia to filtered (0.45 µ filter paper) lake water. Test organisms were Ceriodaphnia spp. (biomass 16.1 µg/ind), Bosmina spp. (11.4 µg/ind). The algae was cultured in medium containing the three N/P mass ratios and later algal cells were collected and given as food to zooplankton. One hundred zooplankter (Ceriodaphnia and Bosmina) were incubated in 50 ml filtered lake water and the algal food was mixed inside. Fifty other animals were killed (CO2) and their body mass was measured (biovolume converted to mass). After 2 days of incubation the animals were collected, and the content of P & N in their body and in the medium (excreted) and the animal weight (biovolume converted to mass) were measured. Results are given in Table 4.
The results presented in Table 4 indicates several remarkable conclusions: The body N/P mass ratio of Ceriodaphnia is lower than that of Bosmina while these two zooplankters were fed the same type of food. Not
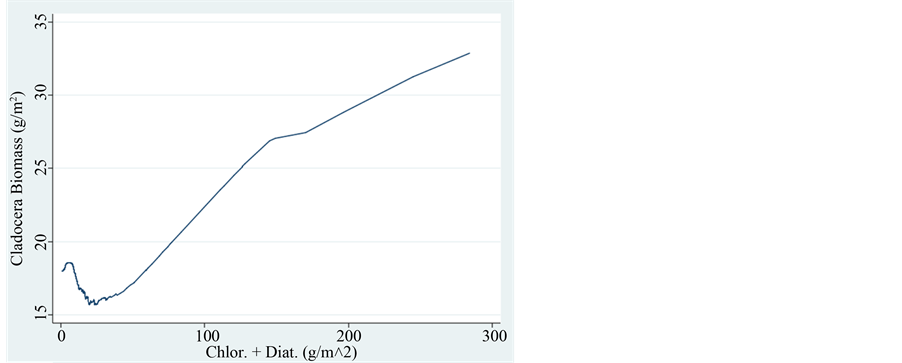
Figure 5. Trend of changes (LOWESS: 0.8) of Cladocera Biomass (g/m2) in relation to the biomass of Chlorophyta + Diatoms.
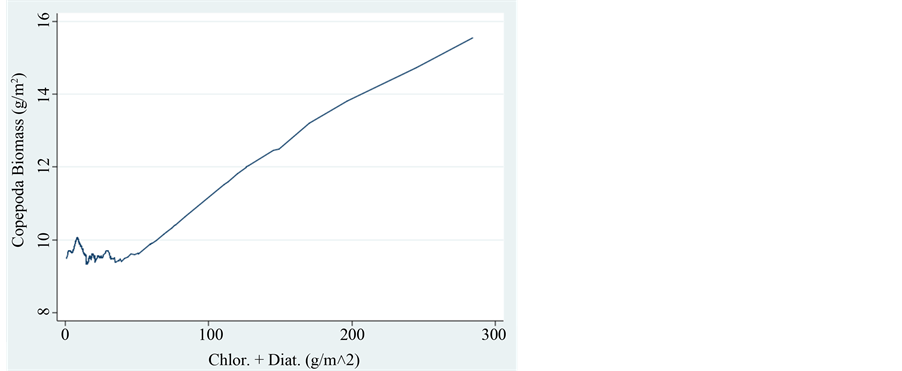
Figure 6. Trend of changes (LOWESS: 0.8) of Copepoda Biomass (g/m2) in relation to the biomass of Chlorophyta + Diatoms.
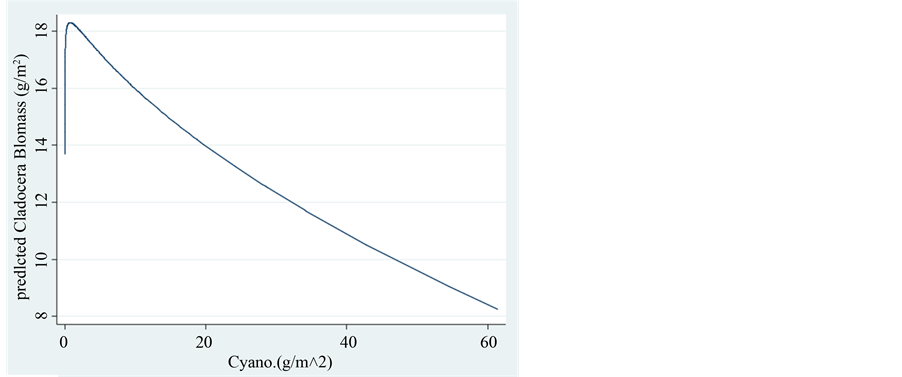
Figure 7. Fractional polynomial plot of the relations between Cladocera Biomass (g/m2) and the Biomass of Cyanophyta (g/m2).
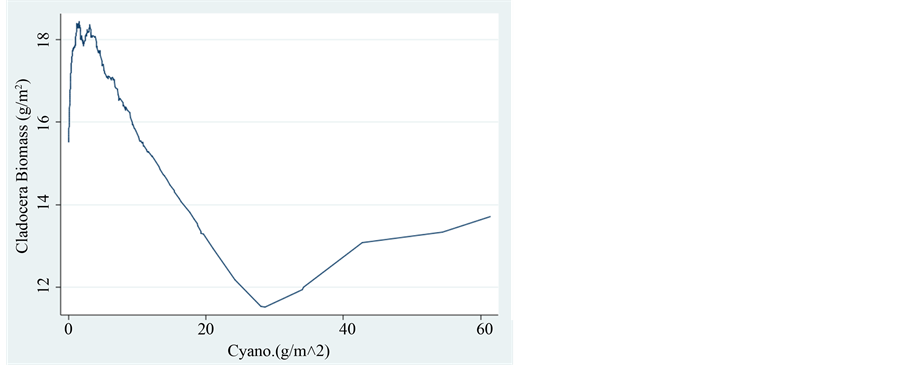
Figure 8. Trend of changes (LOWESS: 0.8) of Cladocera Biomass (g/m2) in relation to the biomass of Cyanophyta (g/m2).
only different N/P ratio but also percentage composition of N and P in Ceriodaphnia is lower than in the body of Bosmina probably because biovolume (converted to mass) of Ceriodaphnia is higher than that of Bosmina and consequently dry weight percentage of Ceriodaphnia is therefore lower. P content in the body of Ceriodaphnia is higher whilst N content in Bosmina is higher. It is likely that Bosmina excreted more ammonia and less Nitrates than Ceriodaphnia. A clear evidence for the existence of Homeostatic response is emerged from the close values of N/P body ratios. When the initial N/P food ratio was low (6) representing N deficiency, excretions included mostly Nitrate which is probably less involved in body tissues degradation by both species. Under Nitrogen deficiency, which is lack of N in the food, excretions of N diminished and N/P ratio was not changed.
4. Discussion
The species diversity of zooplankton in Lake Kinneret is larger than in temperate lakes and typical to the tropics. Thirty-two years of monitoring record indicated multi-annual numerical (No./L) averages of zooplankton concentrations: Cyclopida: Nauplii―75/L; I-IV copepodite stages―66/L; Raptorial Stages (Copepodit IV, V, adult males and females)―36/L; Calanoida (all stages)―2/L; Cladocera―72/L; Small rotifers (Brachionidae, Synchaetidae, Gastropidae,)―87/L; Large rotifers (Asplanchnidae, Testudinellidae, Trichocercidae, Hexartridae)―17/L. Conversion of numerical values to biomass indicated the following multiannual averages of zooplankton densities: Copepoda-550 (±420) mg(ww)/m3; Cladocera-940 (±640) mg(ww)/m3; Rotifera-120 (±180) mg(ww)/m3 The Hypsometric curve of Lake Kinneret indicates water surface area at 211 mbsl as 164.5 km2. Phytoplankton and zooplankton wet biomass were 76 mg(ww)/m2 and 29 mg(ww)/m2 respectively. Data given in Table 4 documented percentages of Phosphorus as 0.072% and 0.13% in wet biomass of Phytoplankton [17] . and zooplankton respectively. If multiannual average of epilimnetic TP in Lake Kinneret is 30 t (excluding fishes which are not sampled routinely) algal and zooplankton fraction are 9 t (30%) and 6 t (20%) respectively whilst the rest of 50% is abiotic dissolved and particulate fractions. It has to be considered that fish are not included in routine samples and their biomass that was measured independently by acoustic method was found to be averaged as 5000 tons [6] [7] . If annual fish landings are averaged as 1500 tons (91 Kg/ha) it is a removal of app. 11 t of P from the lake. These values exemplify prominently the significant status of zooplankton within the Kinneret ecosystem. Moreover, food web manipulations should be accounted towards fish compartment thoroughly. What are the potential implications of Homeostasis on the nutrient dynamics? When N/P ratio is high (P limitation) as was in Lake Kinneret during the 1970’s and 1980’s [4] high dominant biomass of Cladocera might have a positive impact within the ecosystem because cladoceran excretions are also N rich. As a result of N rich recycled zooplankton consumption, the incorporation of N by algae is enhanced and less limited. Therefore cladocerans might be considered as Cyanobacteria prevented factor. Under such conditions without enhancement of N recycling, the N supply will be insufficient the Blue-greens might be flourished [18] . Cladocerans enhance N recycling and limitation is prevented. In ecosystems where N/P is low (N limited) small bodied Cyclopoid copepods are dominant. They recycle nutrients rich in P and their low N/P excreted is favored by
Table 4. N and P contents and N/P mass ratio in animals body, in cultured algal medium and in the medium after 2 days of incubation of Ceriodaphnia spp. (Ceriodaph.) and Bosmina spp. (Bosmin).
Cyanobacteria which can get N from other sources (N fixation). Results in Figure 3 documented the decline of Cladocera and Copepods enhancement after 1997 when Cyanobacteria flourished [19] -[21] . It is also emphasized that the enhancement of metabolic activities of zooplankton is partly due to temperature elevation. Measurements of Δ13C in three of the key food-web Fishes (S. galilaeus, O. aureus. Bleak), Mixed zooplankton material, nano-phytoplankton and Peridinium were carried out. Results are given as negative number of per mills, where, the more the number is negative, (farer from zero), less 13C is contained. Moreover, if numbers of two organisms are close to each other it is an indication that one of them is a food item preference for the other.
Here are a selected results of Δ13C from a wide survey:
Peridinium-20.6; S. galilaeus before 1997-21.7; after 1997-24.1
O. aureus-23.8; Bleaks-25.3; zooplankton-26.2; Nano-phytoplankton-28.8.
These data indicates high consumption rate of Peridinium by S. galilaeus; high rate of zooplankton consumption by bleaks; and high rate of nano-phytoplankton by zooplankton. All these feeding-relations were also confirmed by microscopical observations. As documented previously [4] during late 1990’s the Kinneret ecosystem shifted from P to N limitation as a result of Nitrogen decline. Consequently Peridinium dimished and its best consumer, S. galilaeus, chaged its diet from Peridinium to zooplankton. One other modification documented in the Kinneret ecosystem was temperature increase. As presented in [14] [22] [23] the reason for that change was water level decline combined with stable Albedo parameter which induced a higher specific heat capacity. The increase of temperature enhanced metabolic activity of zooplankton. Nevertheless it is suggested that the principle impact on zooplankton densities is due to fish zooplanktivory, mostly produced by bleaks. Food resources for zooplankton in Lake Kinneret is probably un-limited due to the wide range of food resources spectrum including beside preferential nano-phytoplankton also Bacteria, Protozoa, and detritus. As a result of zooplankton decline during the 1980’s and 1990’s and the predator-prey relations with bleaks it was recommended to subsidy removal of un-wanted Bleaks. During 8 years about 6000 tons of Bleaks were withdraw. The zooplankton reclaimed partly because later non-edible colonial cyanobacteria enhanced. Within the zooplankton communities there are raptorial animals which partly prey herbivorous zooplankters. Nevertheless long-term analysis of densities relations between herbivorous and raptorial zooplankters did not confirm predator-prey relations except for a short period in early 2000’s (Figure 3).
5. Summary
Zooplankton distribution in Lake Kinneret was studied during 32 years resulting in the following conditions as major controllers of its density: 1) Food availability and composition: top preference is due to nano-phyto- plankton, Chlorophytes and Diatoms, Bacteria and Protozoa and detritus are consumed as well. 2) Temperature increase resulted by Water Level decline and higher heat capacity of the Epilimnion enhanced metabolic activity of zooplankton. 3) As a result of changes of the external loads (quantity and quality) nutrient inputs the Kinneret shifted from P to N limited ecosystem and predation pressure of fish on zooplankton was intensified but Homeostasis response might contribute a positive impact. 4) The stock of the zooplanktivorous Bleak population dramatically enhanced. It was accompanied by intensification of zooplankton consumption by the previously known as phytoplanktivorous fish, S. galilaeus. The food composition of this fish presently contains more zooplankton than previously due to the absence of Peridinium.
References
- Gophen, M. (1978) Zooplankton. In: Serruya, C., Ed., Lake Kinneret, Monographiae Biologicae Vol. 32, Dr. W. Junk Publishers, The Hague, 297-311. http://dx.doi.org/10.1007/978-94-009-9954-1_11
- Gophen, M. (2003) Water Quality Management in Lake Kinneret (Israel): Hydrological and Food Web Perspectives. Journal of Limnology, 62, 91-101. http://dx.doi.org/10.4081/jlimnol.2003.s1.91
- Gophen, M. (2008) Long Term (1970-2001) Eco-Hydrological Processes in Lake Kinneret and Its Watershed. In: Zereini, H., Ed., Climatic Changes and Water Resources in the Middle East and in North Africa, Invited Chapter, Springer, Berlin, 373-402.
- Gophen, M. (2011) The Cladoceran Trophic Status in the Nitrogen Limited Ecosystem of Lake Kinneret (Israel). Journal of Environmental Biology, 32, 455-462.
- Berman, T., Serruya, C., Gophen, M., Sukenik, A. and Zohary, T., Eds. (1970-2013) LKDB-KLL-1969-2013. Annual Reports.
- Walline, P., Pizanty, S., Gophen, M. and Berman, T. (1990) The Ecosystem of Lake Kinneret, Israel. ICES.C.M. 1990/L:39, 1-8.
- Serruya, C., Gophen, M. and Pollingher, U. (1980) Lake Kinneret: Carbon Flow Patterns and Ecosystem Management. Arch. Hydrobiol., 88, 265-302.
- Gophen, M. and Azoulay, B. (2002) The Trophic Status of Zooplankton Communities in Lake Kinneret (Israel). Verh. Internat. Verein. Limnol., 28, 836-839.
- Gophen, M. and Pollingher, U. (1985) Relationships between Food Availability, Fish Predation and the Abundance of the Herbivorous Zooplankton Community in Lake Kinneret. Arch. Hydrobiol. Beih. Ergebn. Limnol., 21, 397-405.
- Gophen, M. and Serruya, S. (1993) Effects of Fish and Nutrients on Long-Term Changes of Plankton Communities in Lake Kinneret (Israel). In: Schroder, J.H., Bauer, J. and Schartl, M., Eds., Trends in Ichthyology, an International Perspectives, Blackwell Scientific Publications, Boston, 371-380.
- Gophen, M. (2004) Ecohydrological Management of Lake Kinneret: A Case Study. Ecohydrology and Hydrobiology, 4, 397-408.
- Gophen, M. (1992) Long-Term Changes of Plankton-Communities in Lake Kinneret, Israel. Asian Fisheries Science, 5, 291-302.
- Gophen, M. (2000) Lake Kinneret (Israel) Ecosystem: Long-Term Instability or Resiliency? In: Belkin, S., Ed., Water, Air, and Soil Pollution, Special Section: Environmental Challenges, Vol. 123, No. 1-4, Kluwer Academic Publisher, Dordrecht, 323-335.
- Gophen, M. (2014) Competitive Consumption of the Lake Kinneret (Israel) Plankton by Hypophthalmichthys molitrix and Sarotherodon galilaeus. Open Journal of Ecology, 4, 532-542. http://dx.doi.org/10.4236/oje.2014.49043
- Gophen, M. (1984) The Impact of Zooplankton Status on the Management of Lake Kinneret (Israel). Hydrobiologia, 113, 249-258. http://dx.doi.org/10.1007/BF00026613
- Gophen, M. (2015) Thermal Preference by Mesocyclops ogunnus (Onabamiro 1957). Open Journal of Ecology, 5, 15- 21. http://dx.doi.org/10.4236/oje.2015.52002
- Berman, T. (1978) Peridinium cinctum fa. westii (Lemm. Lef.: 2. General Biochemical Features. In: Lake Kinneret Monographiae Biologicae, Vol. 32, Dr. Junk bv Publishers, The Hague, 269-270.
- Gophen, M., Smith, V.H., Nishri, A. and Threlkeld, S.T. (1999) Nitrogen Deficiency, Phosphorus Sufficiency, and the Invasion of Lake Kinneret, Israel, by N2-Fixing Cyanobacterium Aphanizomenon Ovalisporum. Aquatic Sciences, 61, 293-306.
- Sterner, R.W. (1990) The Ratio of Nitrogen to Phosphorus Resupplied by Herbivores: Zooplankton and the Algal Competitive Arena. The American Naturalist, 136, 209-229. http://dx.doi.org/10.1086/285092
- Hessen, D.O. (1992) Nutrient Element Limitation of Zooplankton Production. American Naturalist, 140, 799-814. http://dx.doi.org/10.1086/285441
- Andersen, T. and Hessen, D.O. (1991) Carbon, Nitrogen and Phosphorus Content in Freshwater Zooplankton. Limnology and Oceanography, 36, 807-814. http://dx.doi.org/10.4319/lo.1991.36.4.0807
- Gophen, M. (2014) Land-Use, Albedo and Air Temperature Changes in the Hula Valley (Israel) during 1946-2008. Open Journal of Modern Hydrology, 4, 101-111. http://dx.doi.org/10.4236/ojmh.2014.44010
- Gophen, M. (2014) The Impact of Water Level Decline on Water Quality in the Epilimnion of Lake Kinneret (Israel): Perennial Perspectives. Open Journal of Ecology, 4, 892-906. http://dx.doi.org/10.4236/oje.2014.414075
- .