Open Journal of Ecology
Vol.2 No.1(2012), Article ID:17704,8 pages DOI:10.4236/oje.2012.21003
Photosynthetic toxicity and oxidative damage induced by nano-Fe3O4 on Chlorella vulgaris in aquatic environment
![]()
1Laboratory of Environmental Sciences and Hubei Key Laboratory of Genetic Regulation and Integrative Biology, College of Life Sciences, Huazhong Normal University, Wuhan, China; #Corresponding Author: yangxu@mail.ccnu.edu.cn
2Institute for Clean Energy & Advanced Materials, Southwest University, Chongqing, China
Received 28 November 2011; revised 26 December 2011; accepted 15 January 2012
Keywords: Nano-Fe3O4; Chlorella vulgaris; Photosynthetic Toxicity; Oxidative Damage; Ecotoxicity
ABSTRACT
With the rapid development of nanotechnology and widespread use of nanoproducts, concerns have arisen regarding the ecotoxicity of these materials. In this paper, the photosynthetic toxicity and oxidative damage induced by nanoFe3O4 on a model organism, Chlorella vulgaris (C. vulgaris) in aquatic environment, were studied. The results showed that nano-Fe3O4 was toxic to C. vulgaris and affected its content of chlorophyll a, malonaldehyde and glutathione, CO2 absorption, net photosynthetic rate, superoxide dismutase activity and inhibition of hydroxyl radical generation. At higher concentrations, compared with the control group, the toxicity of nano-Fe3O4 was significantly different. It suggested that nano-Fe3O4 is ecotoxic to C. vulgaris in aquatic environment.
1. INTRODUCTION
Nanomaterials have unique physicochemical properties, high strength, and good magnetic properties, which has led to their use in electronic, magnetic, optical, biomedical, pharmaceutical, cosmetic, energy, sensor, and catalytic applications. Rapid development of nanotechnology and nanomaterials, and continual expansion of their applications have resulted in widespread biosafety concerns [1].
Compared with bulk Fe3O4, nano-Fe3O4 has unique characteristics as superparamagnetism, size and quantum tunnel effects, and so on [2-6]. As an important member of the spinel ferrite family, Fe3O4 is among the most widely used soft magnetic materials. It is commonly used as a recording material, pigment, magnetic fluid material, catalyst, and in magnetic polymer microspheres and electronic materials. It also has wide applications in biotechnology and medicine.
There are concerns about potential pollution of the aquatic environment through mass leakage of nanomaterials during their production, transportation, use, or disposal. Nanomaterials may also be released to the environment through pharmaceuticals, cosmetics and sunscreens that end up in the sewage treatment system from patient’s feces, laundry or bathing [7]. As primary producers, phytoplankton play a key role in aquatic ecosystems. Consequently, the toxicity of nanomaterials on phytoplankton and accumulation of nanoparticles in phytoplankton can directly or indirectly affect the entire aquatic ecosystem. However, to date, there have been few reports on the aquatic toxicity of nano-Fe3O4 [8-12].
As excellent aquatic models, microalgae are prevalent in lakes and seas, easy to culture and propagate, and sensitive to pollutants. Chlorella vulgaris (C. vulgaris) is distributed widely in freshwater and seawater and has a short growth cycle, which make it ideal for aquatic ecotoxicity studies and it can be used to directly observe toxicity at the cellular level [13].
In this study, C. vulgaris was used to study the photosynthetic toxicity and oxidative damage induced by nano-Fe3O4. This preliminary data could be used to support a thorough ecological safety assessment of nanomaterials.
2. MATERIALS AND METHODS
2.1. Materials and Equipment
C. vulgaris (Figure 1) was supplied by Laboratory of Aquatic Biology, College of Life Sciences, Huazhong Normal University, Wuhan, China. Nano-Fe3O4 (ø < 50 nm) (Figure 2) was supplied by Sigma-Aldrich (St.
Louis, MO). Malonaldehyde (MDA) and superoxide dismutase (SOD) kits were supplied by Nanjing Jiancheng Bioengineering Institute, Nanjing, China. Glutathione (GSH) and hydroxyl radical (·OH) kits were supplied by Nanjing KeyGen Biotech. Co., Ltd., Nanjing, China. The instruments used in this study included a high-speed refrigerated centrifuge (AVANTI J-30I, Beckman Coulter, Brea, CA), microplate reader (BioTek, Winooski, VT), 96 well polystyrene microtiter plates, fluorescence microscope (DM4000B, Lecia, Solms, Germany), light incubator (LRH-250-GII, Yiheng Instruments Co., Lit., Shanghai, China), ultrasonic homogenizer for cell disruption (UP200S, Hielscher Ultrasonics, Teltow, Germany), and light oscillation incubator (HZQF, Nanjing Ascent Technology Development Co., Ltd., Nanjing, China).
2.2. Methods
1) Inoculation and cultivation of C. vulgaris Under sterile conditions, C. vulgaris was inoculated into SE medium and cultured for a week. The incubation was continued under a 12:12 h light-dark cycle with an illumination intensity of 3000 lx at 25 ± 1˚C until the logarithmic growth phase reached. The C. vulgaris test solution was prepared using an established method [14-16]. The initial density of C. vulgaris was adjusted to OD540 = 0.1 - 0.2, then cultured in a light incubator with shaking three times a day at regular intervals until the optical density of C. vulgaris reached OD540 = 1.0.
2) Treatment of C. vulgaris Appropriate amounts of nano-Fe3O4 powders (Figure 3) were added to the C. vulgaris culture flasks. The final nano-Fe3O4 concentrations were 0, 50, 100, 200, 400, 800, and 1600 mg·L–1 and the corresponding Fe concentrations were 0, 37.5, 75, 150, 300, 600 and 1200 mg·L–1, respectively. Five parallel samples were prepared for each concentration. The C. vulgaris treated with nanoFe3O4 was cultured in the light incubator at 25˚C with shaking for 72 h. The size distribution of nano-Fe3O4 was determined by scanning electron microscopy (Figure 4).
3) Determination of photosynthetic toxicity a) Determination of the chlorophyll a content Phytoplankton biomass is an important indicator in aquatic ecosystems. As can be quickly estimated from the phytoplankton biomass, the phytoplankton chlorophyll a content is often used as an important index of phytoplankton biomass [17]. Internationally accepted extraction methods for the determination of the chlorophyll a content include hot-ethanol and acetone methods, which are followed by spectrometry. Ethanol extraction has gradually become more common than acetone extraction, because ethanol is less harmful than acetone [18]. In this study, the hot-ethanol extraction method was
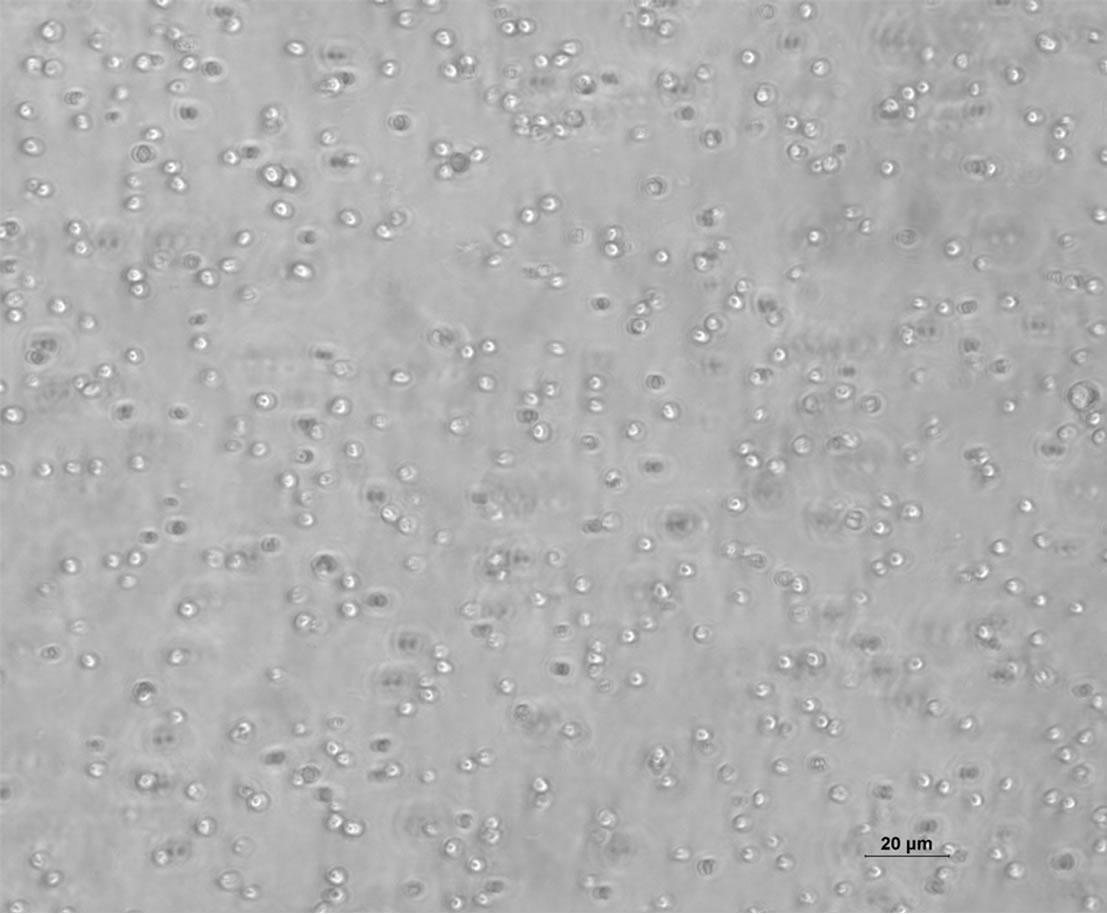
Figure 1. Fluorescence microscope images of C. vulgaris.
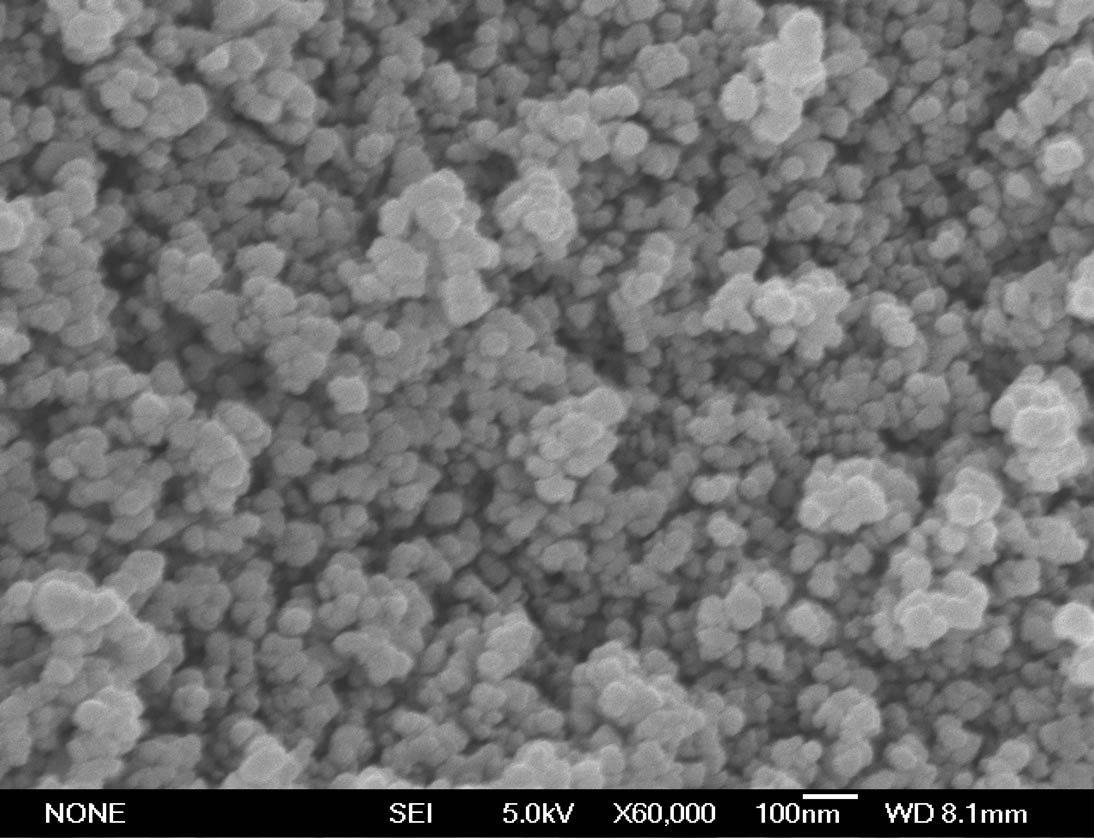
Figure 2. Scanning electron microscopy images of nano-Fe3O4.
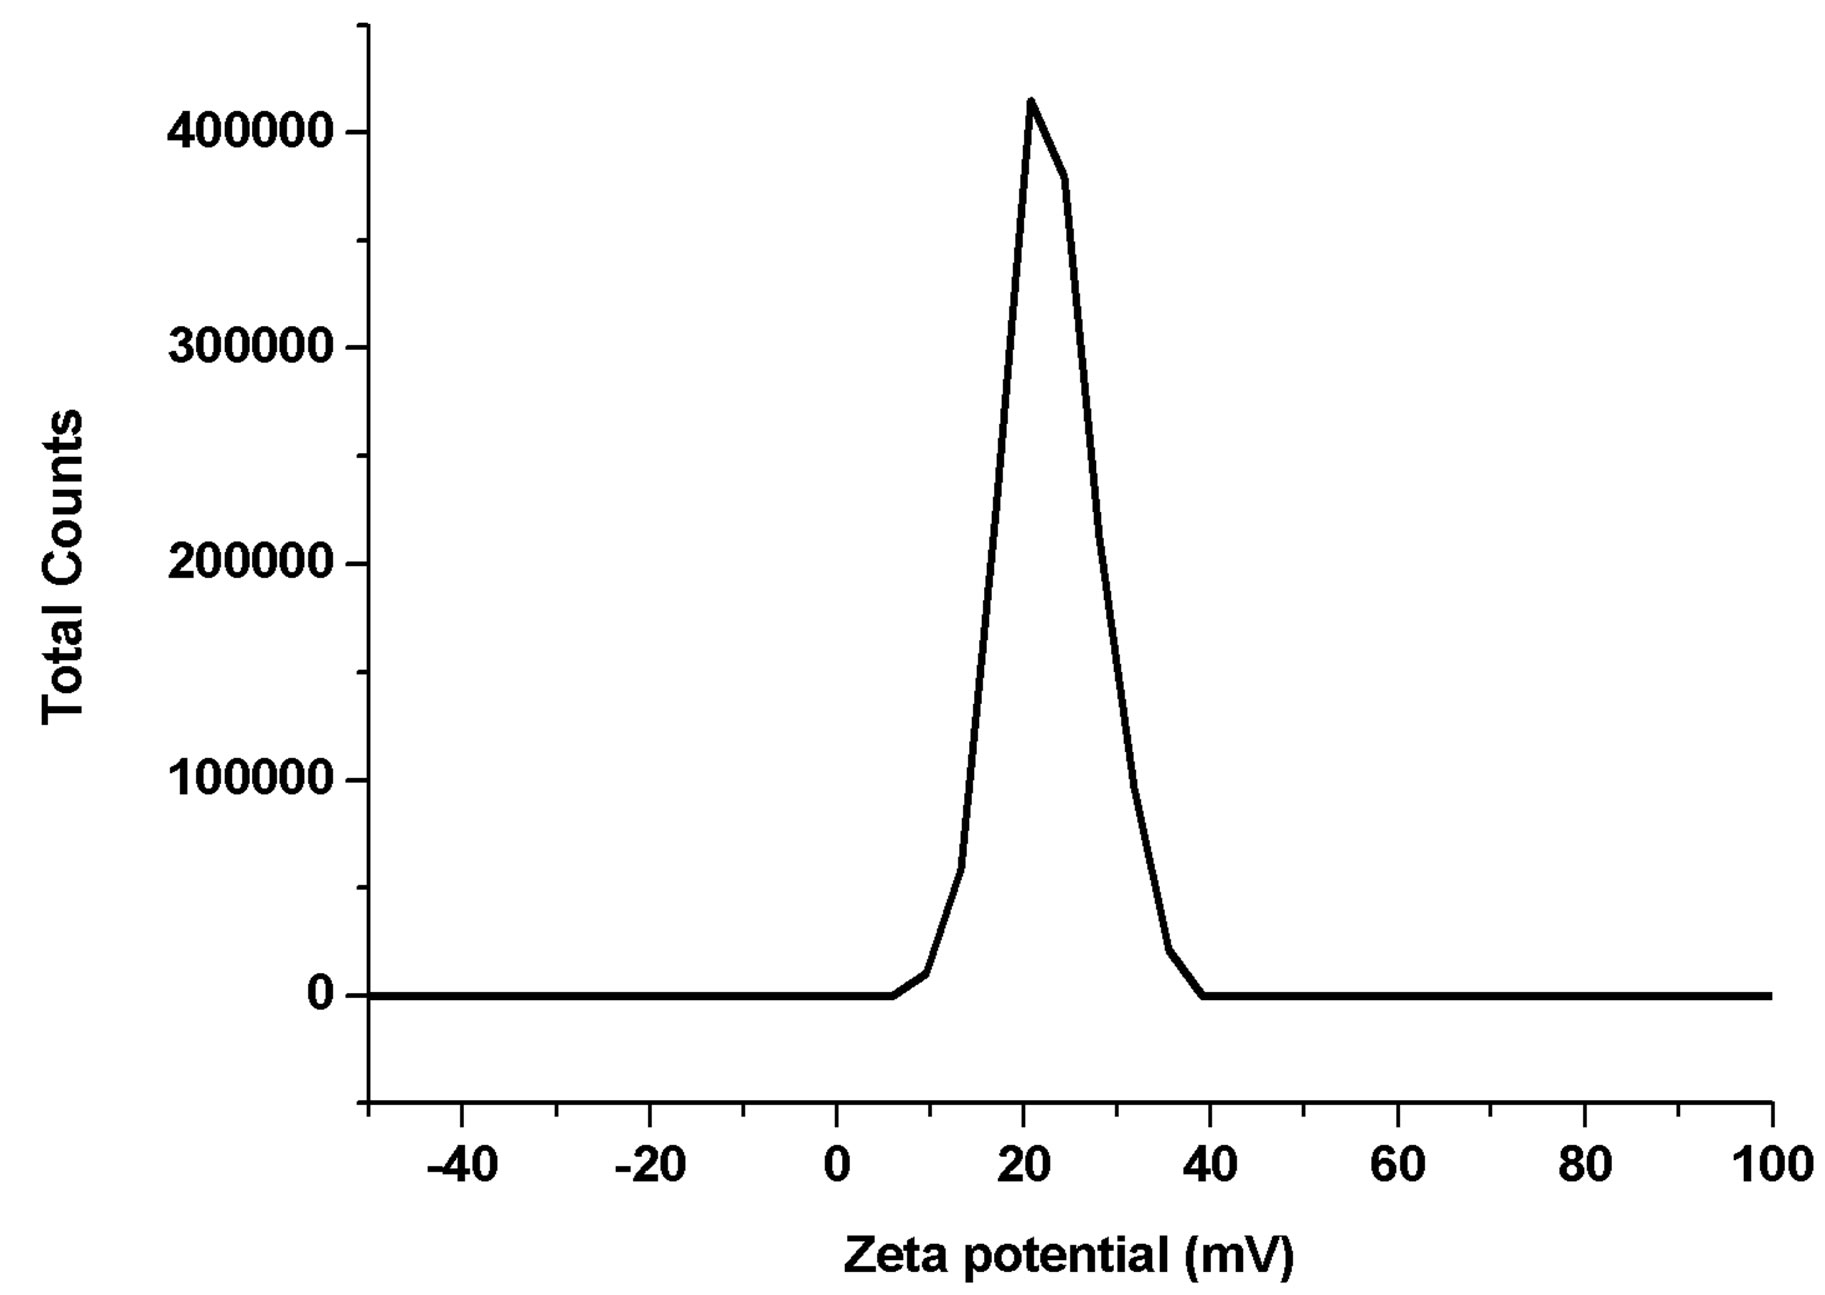
Figure 3. Zeta potential of nano-Fe3O4.

Figure 4. Size distribution in the nano-Fe3O4 stock solution.
used to determine the chlorophyll a content. The chlorophyll a content was calculated using the ethanol extraction method [17] and the following formula:

where Chla refers to the chlorophyll a concentration (mg·m–3), Vethanol is the constant volume of the extract (mL), Vwater is the volume of filtered water (L), A665 is the absorbance of the samples in 665 nm wave, similar to A750. E665 indicates the absorbance of the samples acidified with 1 mol/L HCl in 665 nm wave, similar to E750.
b) Determination of the net photosynthetic rate The CO2 absorption rate of plants during photosynthesis can be quantitatively determined using an infrared gas analyzer. The net photosynthetic rate of plants (Pn) is usually expressed using the amount of absorbed CO2 (mg·dm–2·h–1). In the present study, flasks containing C. vulgaris were placed in a closed bell with a known volume. The CO2 levels were recorded at 0, 2, 4, 6, 8, 10 min, and the net photosynthetic rate (Pn) was calculated as follows:
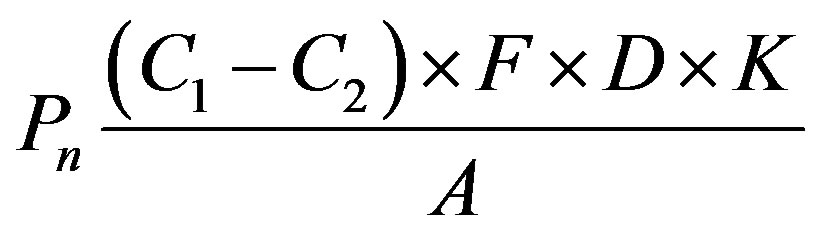
where Pn is the net photosynthetic rate [CO2 absorption (mg·dm–2·h–1)]; C1 is the CO2 content in the air (ppm); C2 is the CO2 content of discharged air after photosynthesis (ppm); F is the gas flow rate (L·h–1), which was fixed in this experiment and equal to the bell volume (3 L·h–1); D is the CO2 density at the experimental temperature (mg·L–1); K is the pressure correction factor, which was equal to 1; A is the leaf area (dm2), which corresponds to the area of the base of the conical flask (1 dm2) used in this experiment.
4) Determination of oxidative damage Kit instructions were followed to determine the MDA and GSH contents, SOD activity, and inhibition of ·OH generation.
2.3. Statistical Analysis
The data were analyzed by one-way analysis of variance using SPSS 13.0 (IBM, Endicott, NY), and the LSD test package. Statistical significance was evaluated using significance levels of 0.01 and 0.05.
3. RESULTS
3.1. Changes in the Chlorophyll a Content
Figure 5 shows the effects of different concentrations of nano-Fe3O4 on the chlorophyll a content in C. vulgaris. Compared with the control group, the chlorophyll a concentrations of the exposure groups decreased as the nano-Fe3O4 concentration increased. At the low nanoFe3O4 concentrations (50 mg·L–1 and 100 mg·L–1), the chlorophyll a concentration decreased but not significantly. At nano-Fe3O4 concentrations of 200 mg·L–1 to 1600 mg·L–1, the chlorophyll a concentration decreased significantly (p < 0.05). The decreases at 400 mg·L–1, 800 mg·L–1 and 1600 mg·L–1 were only slightly different to that in the 200 mg·L–1 group.
3.2. Changes in the Amount CO2 Absorbed during Photosynthesis
Figure 6 shows the effect of different concentrations of nano-Fe3O4 on the amount of CO2 absorbed during C. vulgaris photosynthesis. The vertical axis represents the CO2 content in the container where C. vulgaris in, and the abscissa represents time, so the CO2 absorptions

Figure 5. Effects of nano-Fe3O4 on the chlorophyll a content in C. vulgaris (F = 5.78; *p < 0.05, compared with the control group).
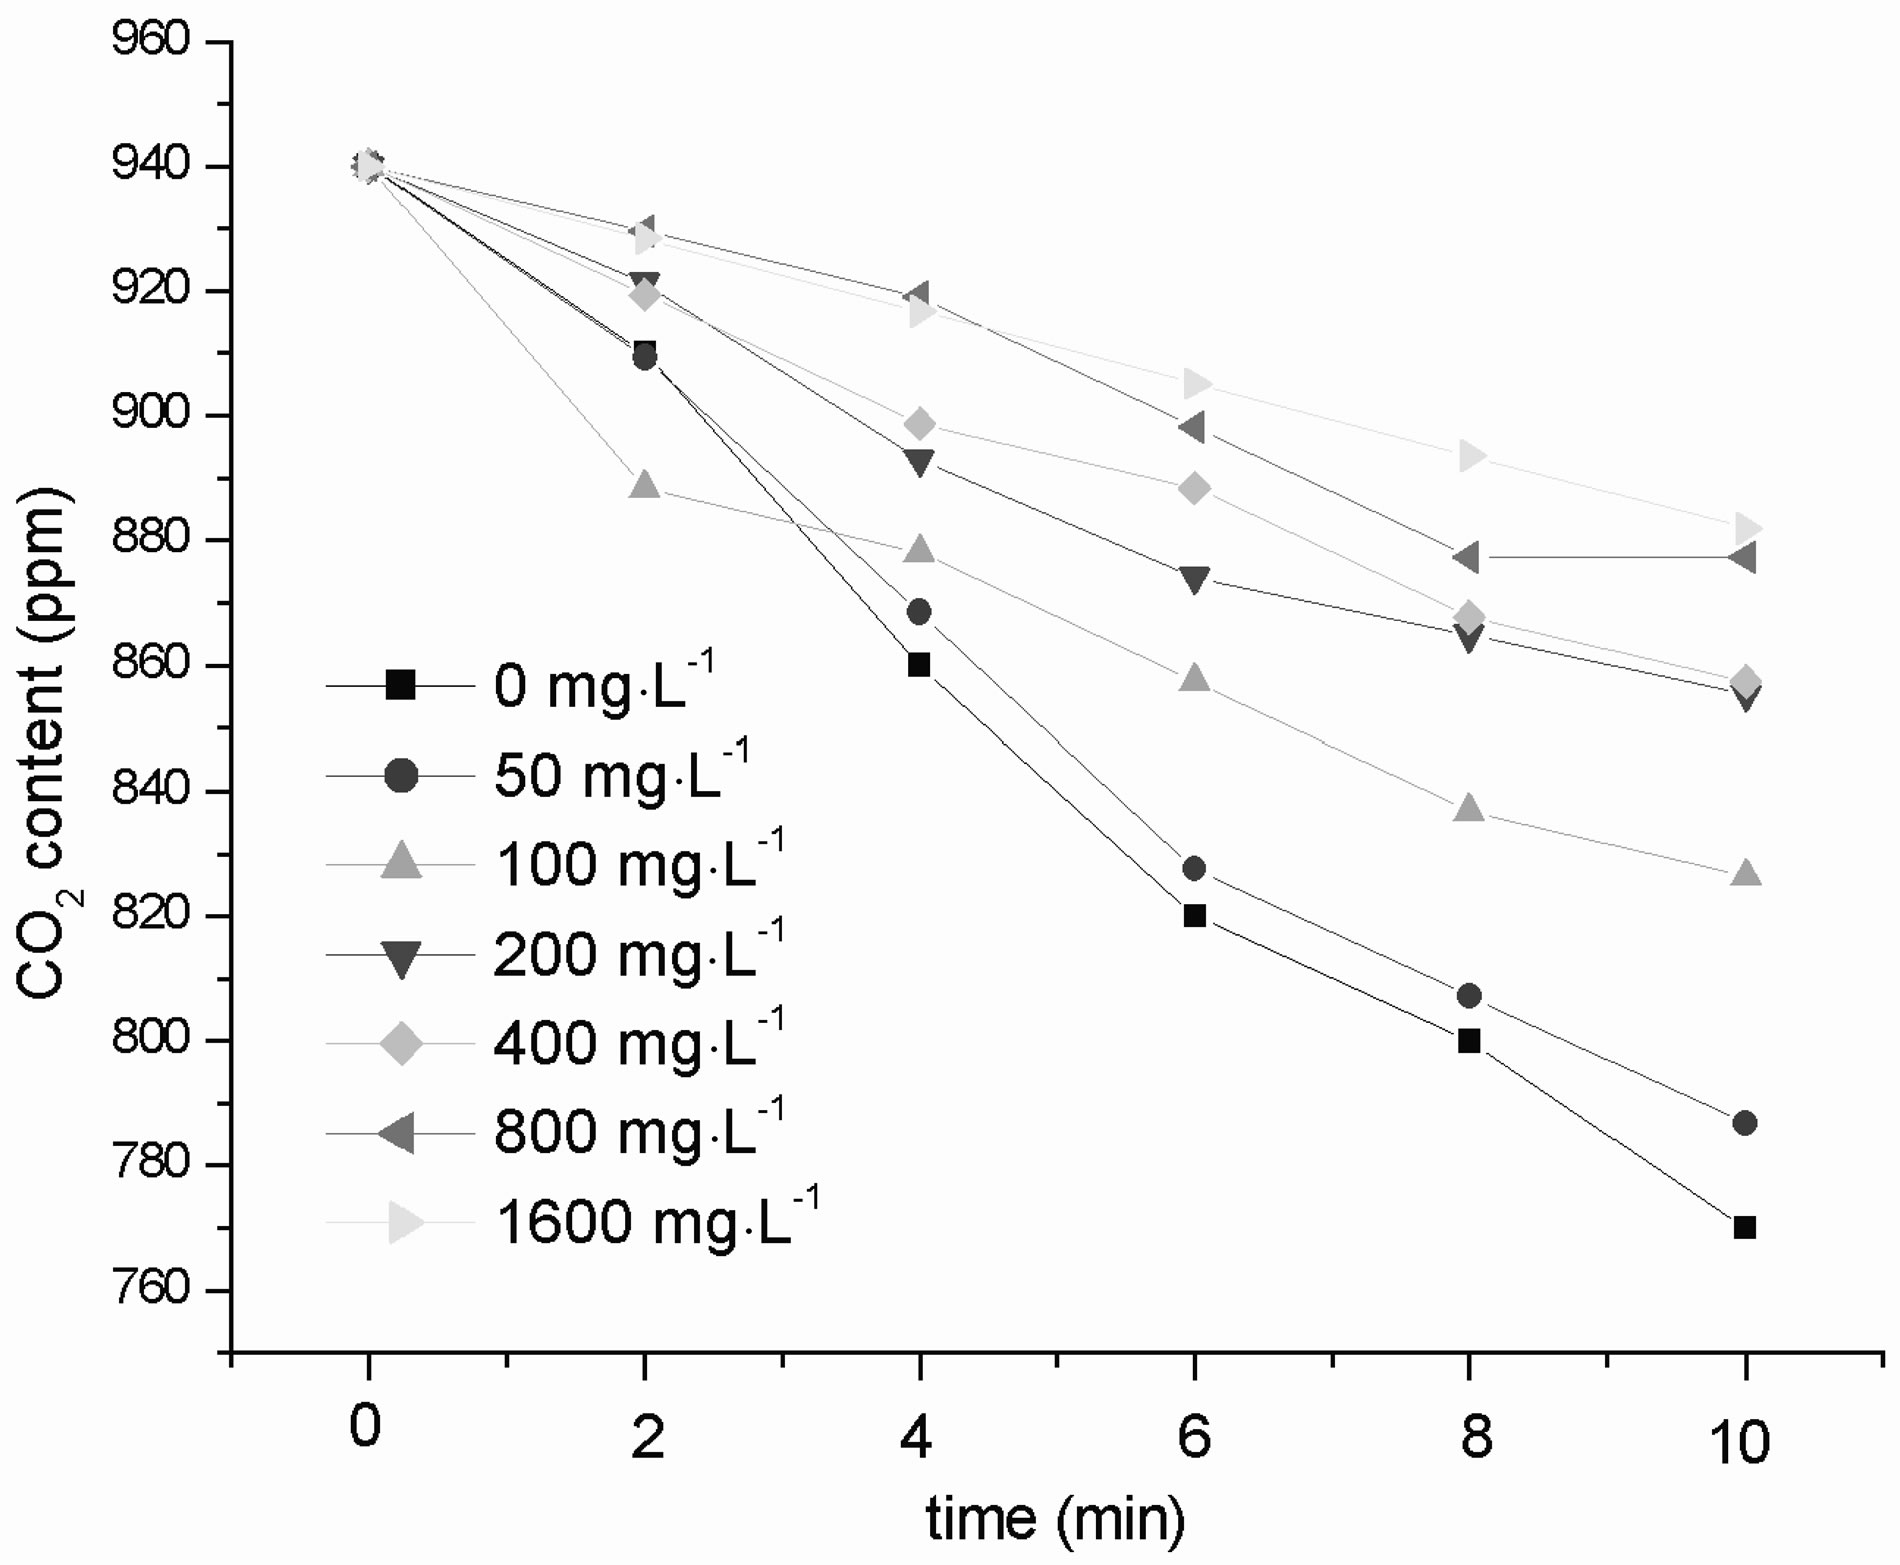
Figure 6. Effects of nano-Fe3O4 on the amount of CO2 absorbed in C. vulgaris photosynthesis.
equals the initial concentration of CO2 minus the final concentration of CO2. Compared with the control, in all exposure groups, the CO2 absorption decreased as the nano-Fe3O4 concentration increased over the 10 min that samples were analyzed.
3.3. Changes of the Net Photosynthetic Rate
Figure 7 shows the effect of different concentrations of nano-Fe3O4 on the net photosynthetic rate of C. vulgaris. As the nano-Fe3O4 concentration increased, the net photosynthetic rate decreased. This decrease was significant (p < 0.01) in all exposure groups except for the lowest concentration (50 mg·L–1) exposure group.
3.4. Changes in the MDA Content
Figure 8 shows the effects of different concentrations of nano-Fe3O4 on the MDA content in C. vulgaris. Compared with the control group, as the nano-Fe3O4 concentration increased the MDA content also increased. However, in the 50 - 400 mg·L–1 groups the increases in the MDA content were not significant. In the 800 mg·L–1 and 1600 mg·L–1 groups, the increases in the MDA content were significant (p < 0.05 for 800 mg·L–1, and p < 0.01 for 1600 mg·L–1).
3.5. Changes in the GSH Content
Figure 9 shows the effects of different concentrations of nano-Fe3O4 on the GSH content in C. vulgaris. Compared with the control group, as the nano-Fe3O4 concentration increased, the GSH content decreased. In 50 - 200 mg·L–1 groups the decreases were not significant, whereas in the 400 - 1600 mg·L–1 groups the decreases were significant (p < 0.01).
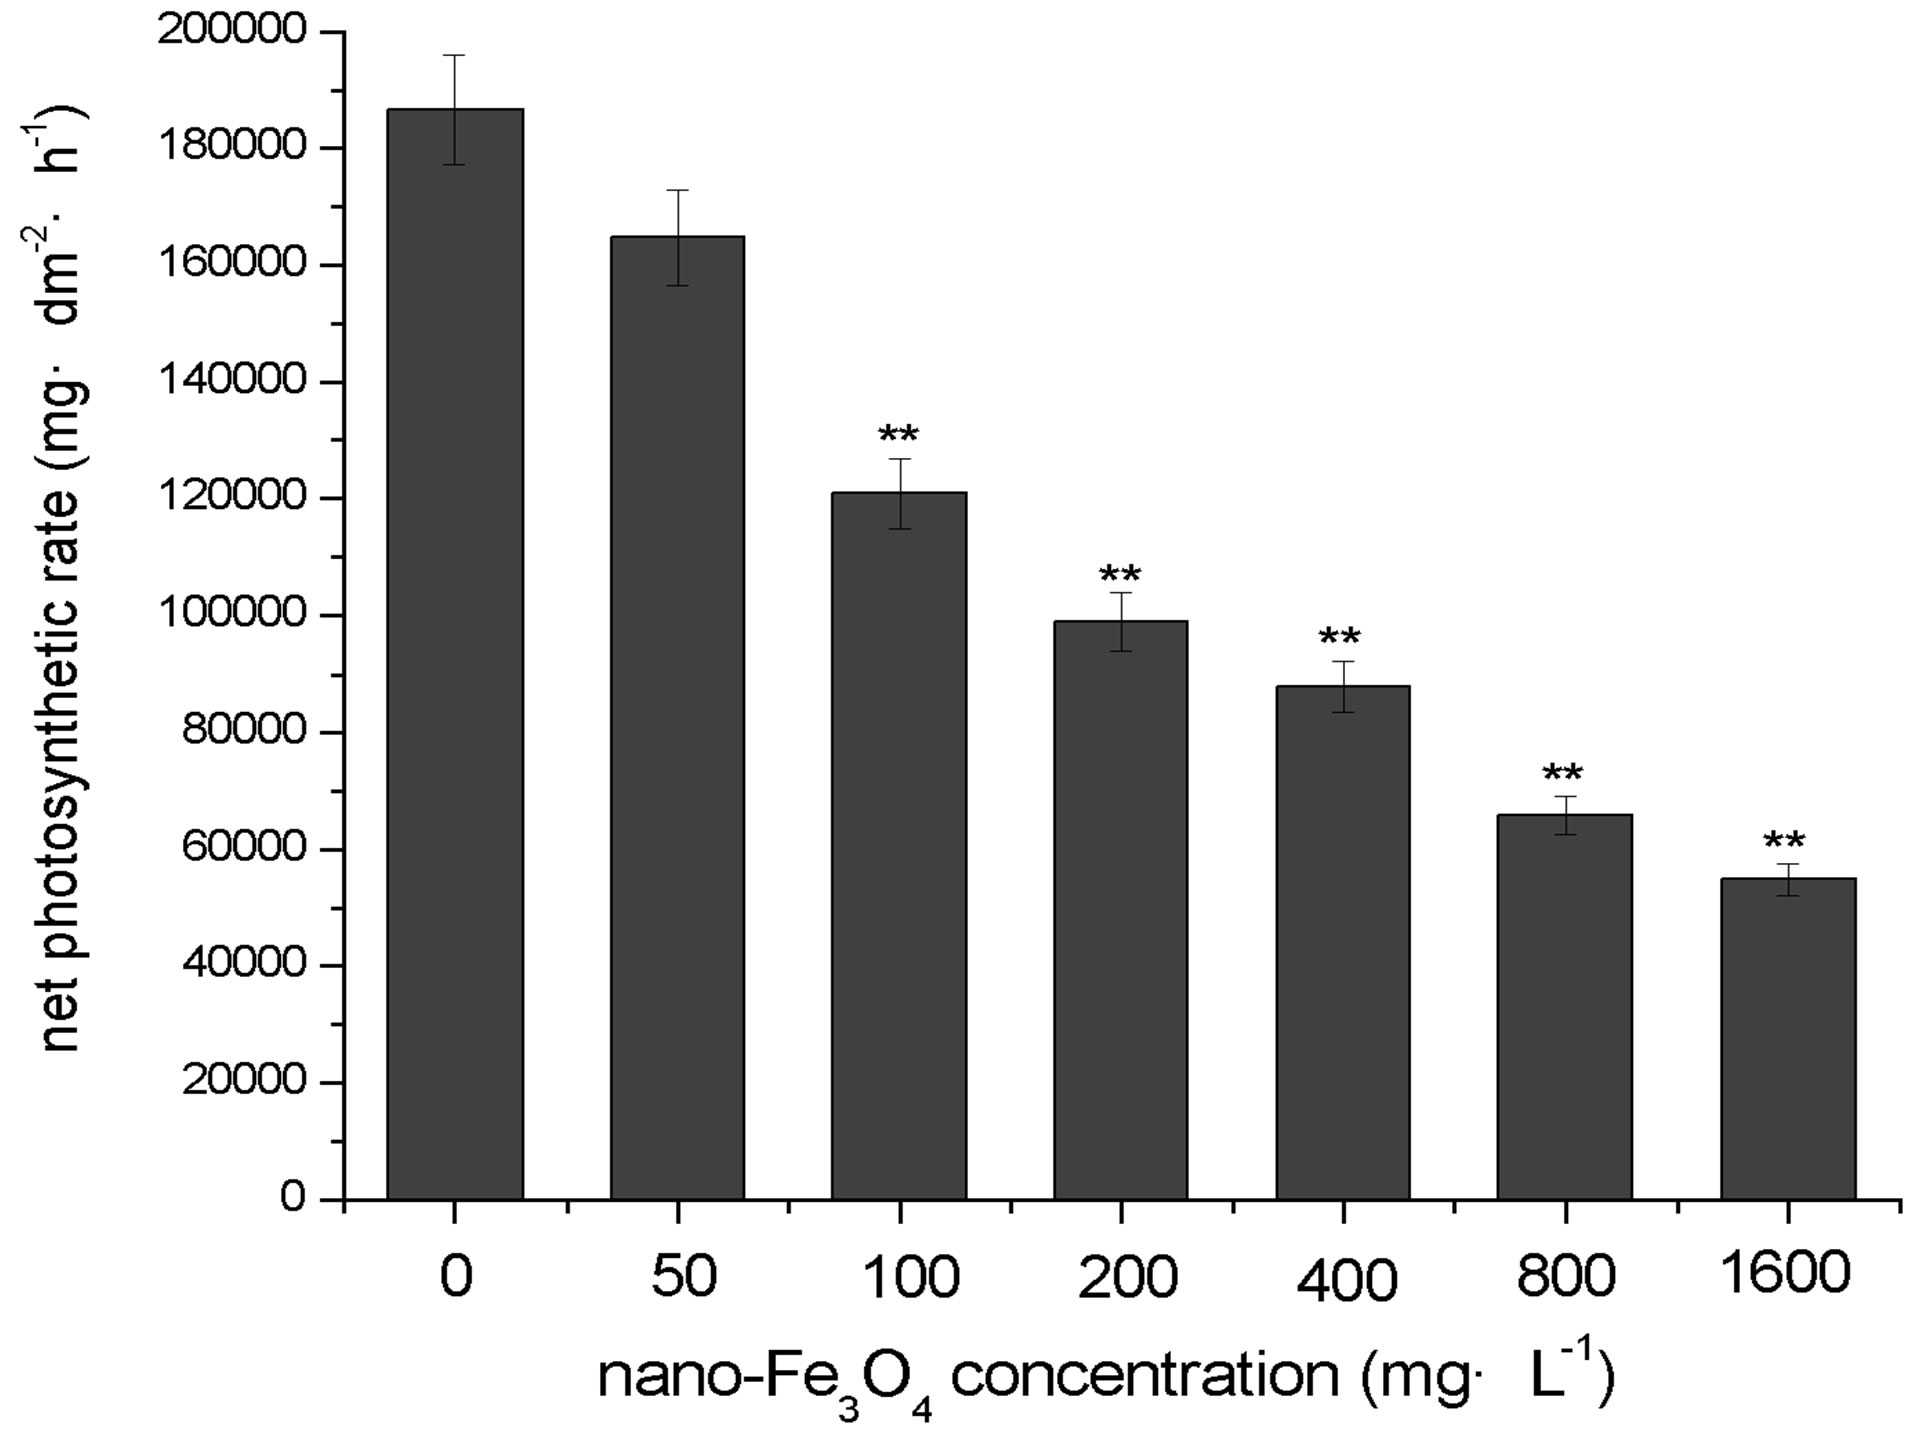
Figure 7. Effects of nano-Fe3O4 on the net photosynthetic rate in C. vulgaris (F=3.69; **p < 0.01, with the control group).

Figure 8. Effects of nano-Fe3O4 on MDA content in C. vulgaris (F = 2.61; *p < 0.05 and **p < 0.01, compared with the control group).

Figure 9. Effects of nano-Fe3O4 on GSH content in C. vulgaris (F = 3.31; **p < 0.01, compared with the control group).
3.6. Changes in the SOD Activity
Figure 10 shows the effects of different concentrations of nano-Fe3O4 on SOD activity in C. vulgaris. When the nano-Fe3O4 concentrations were <400 mg·L–1, the SOD activity significantly increased (p < 0.01). With nano-Fe3O4 concentrations > 400mg·L–1, the SOD activity decreased, and in the 1600 mg·L–1 group the SOD activity was significantly lower than that of the control group (p < 0.05).
3.7. Changes in the Inhibition of ·OH Generation
Figure 11 shows the effects of different concentrations of nano-Fe3O4 on the inhibition of ·OH generation in C. vulgaris. When the nano-Fe3O4 concentrations were <200 mg·L–1, inhibition of ·OH generation slightly increased. With >200 mg·L–1 nano-Fe3O4, inhibition of ·OH generation decreased. In the 400 mg·L–1 and 800 mg·L–1 groups (p < 0.05) and 1600 mg·L–1 group (p < 0.01) the inhibition of ·OH generation was significantly lower than that of the control group.
4. DISCUSSION
Nanomaterials are new type of pollutant, and they can affect organisms at all levels in aquatic ecosystems. Many
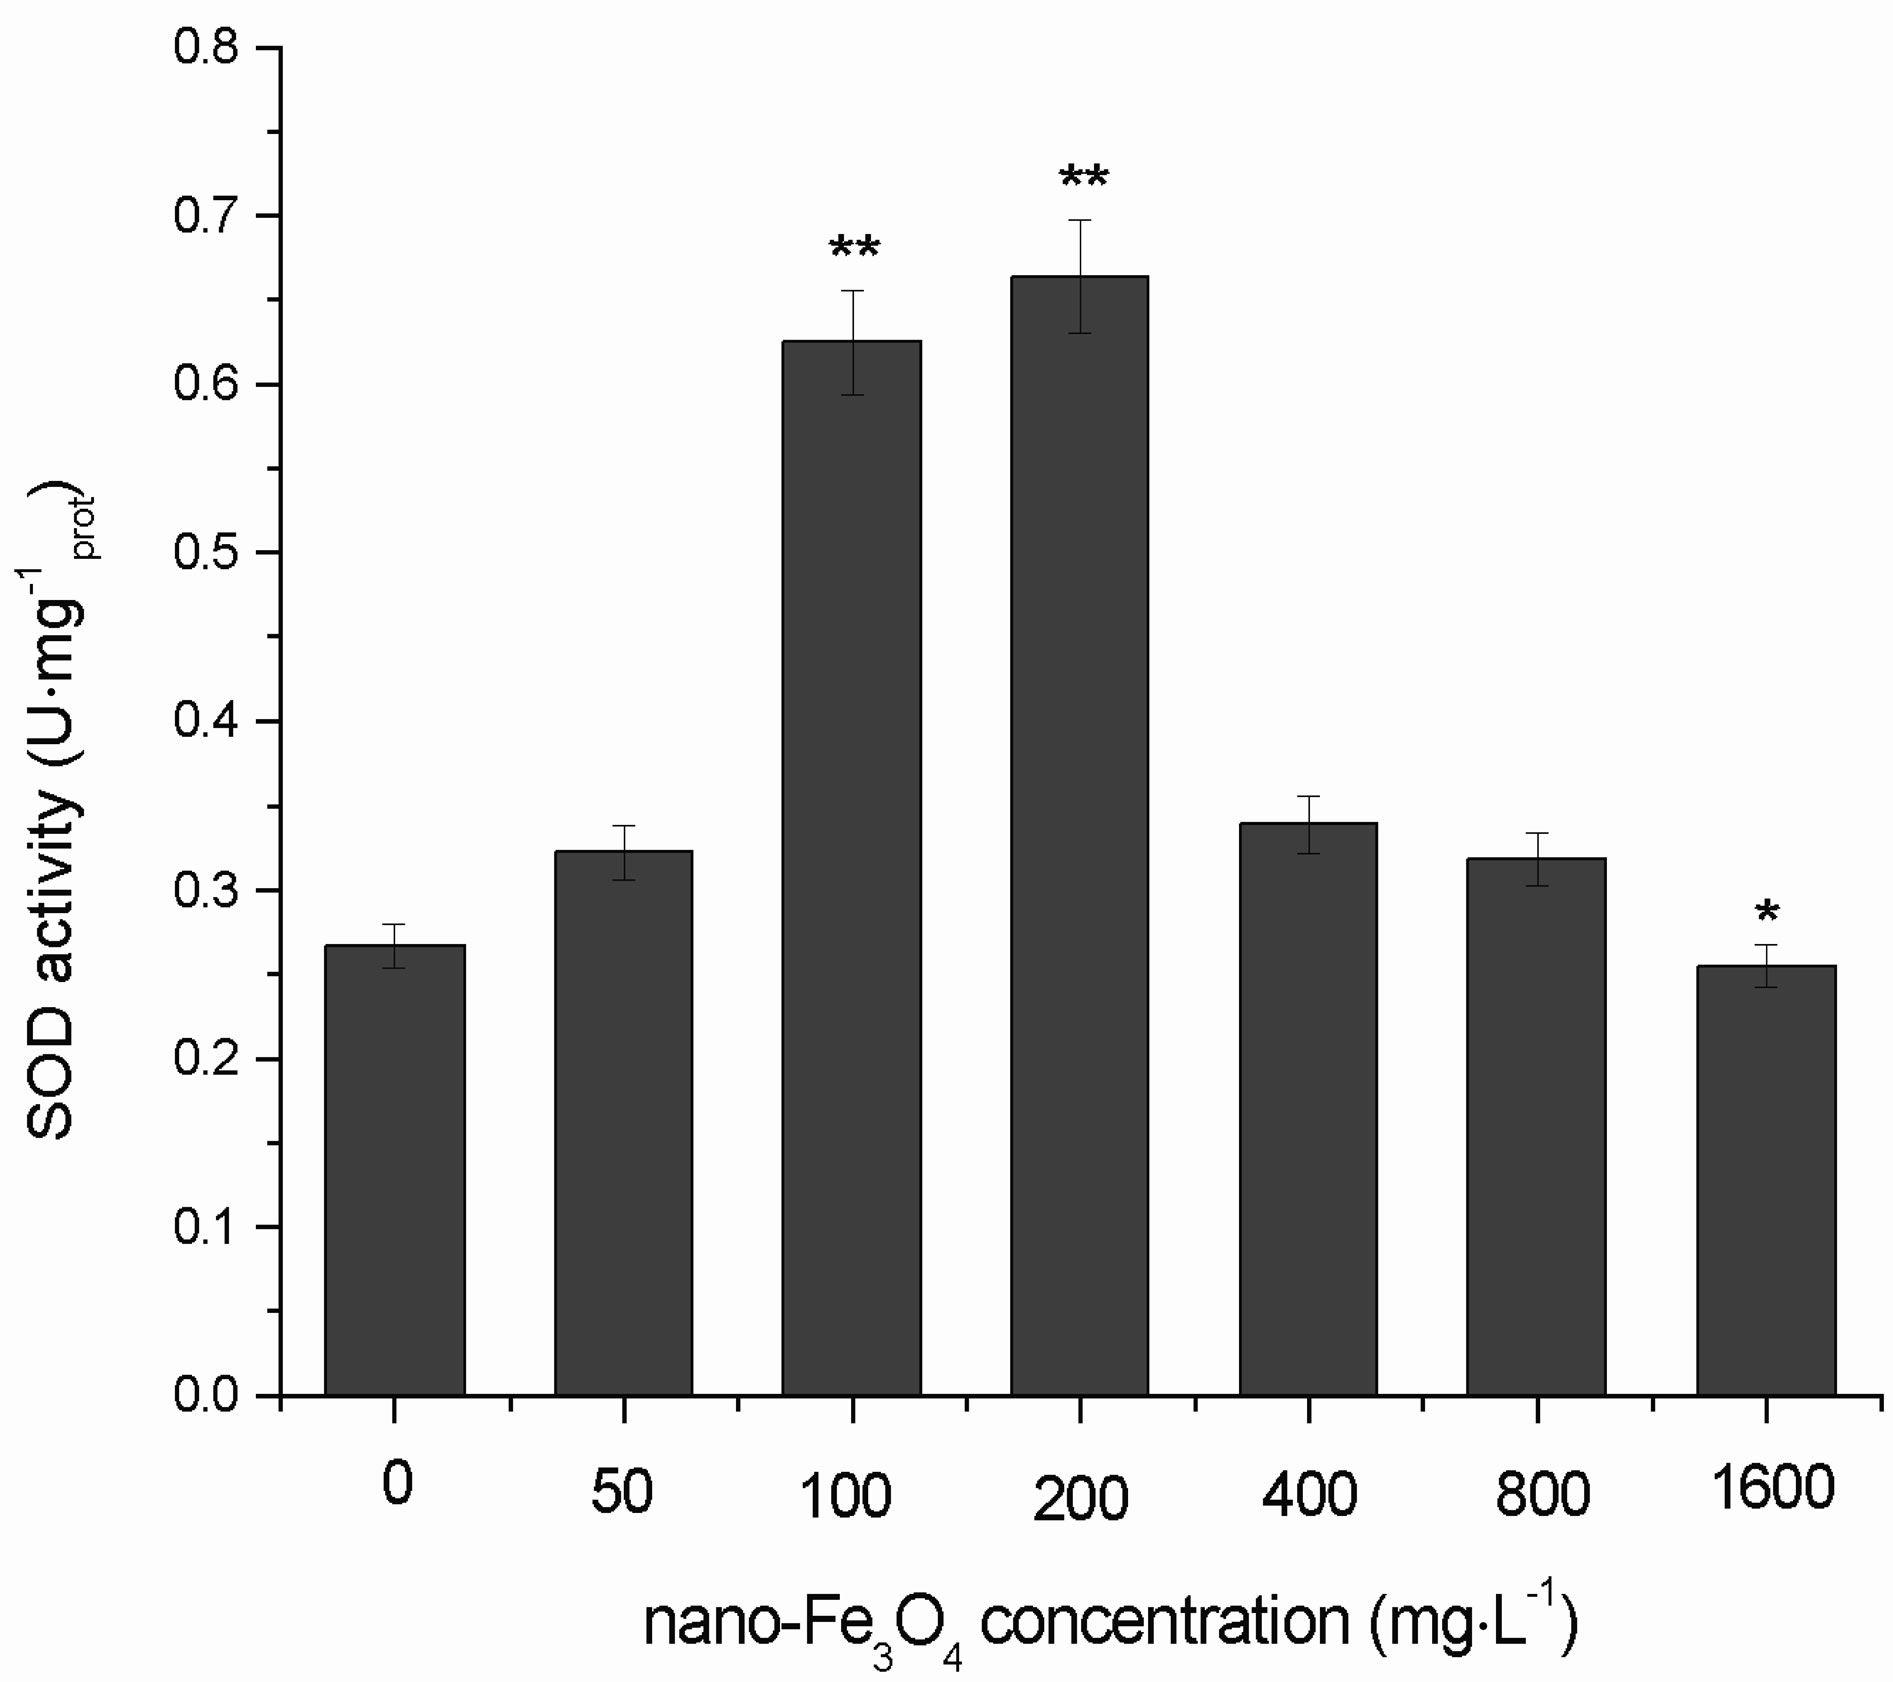
Figure 10. Effects of nano-Fe3O4 on SOD activity in C. vulgaris (F = 6.40; *p < 0.05 and **p < 0.01, compared with the control group).
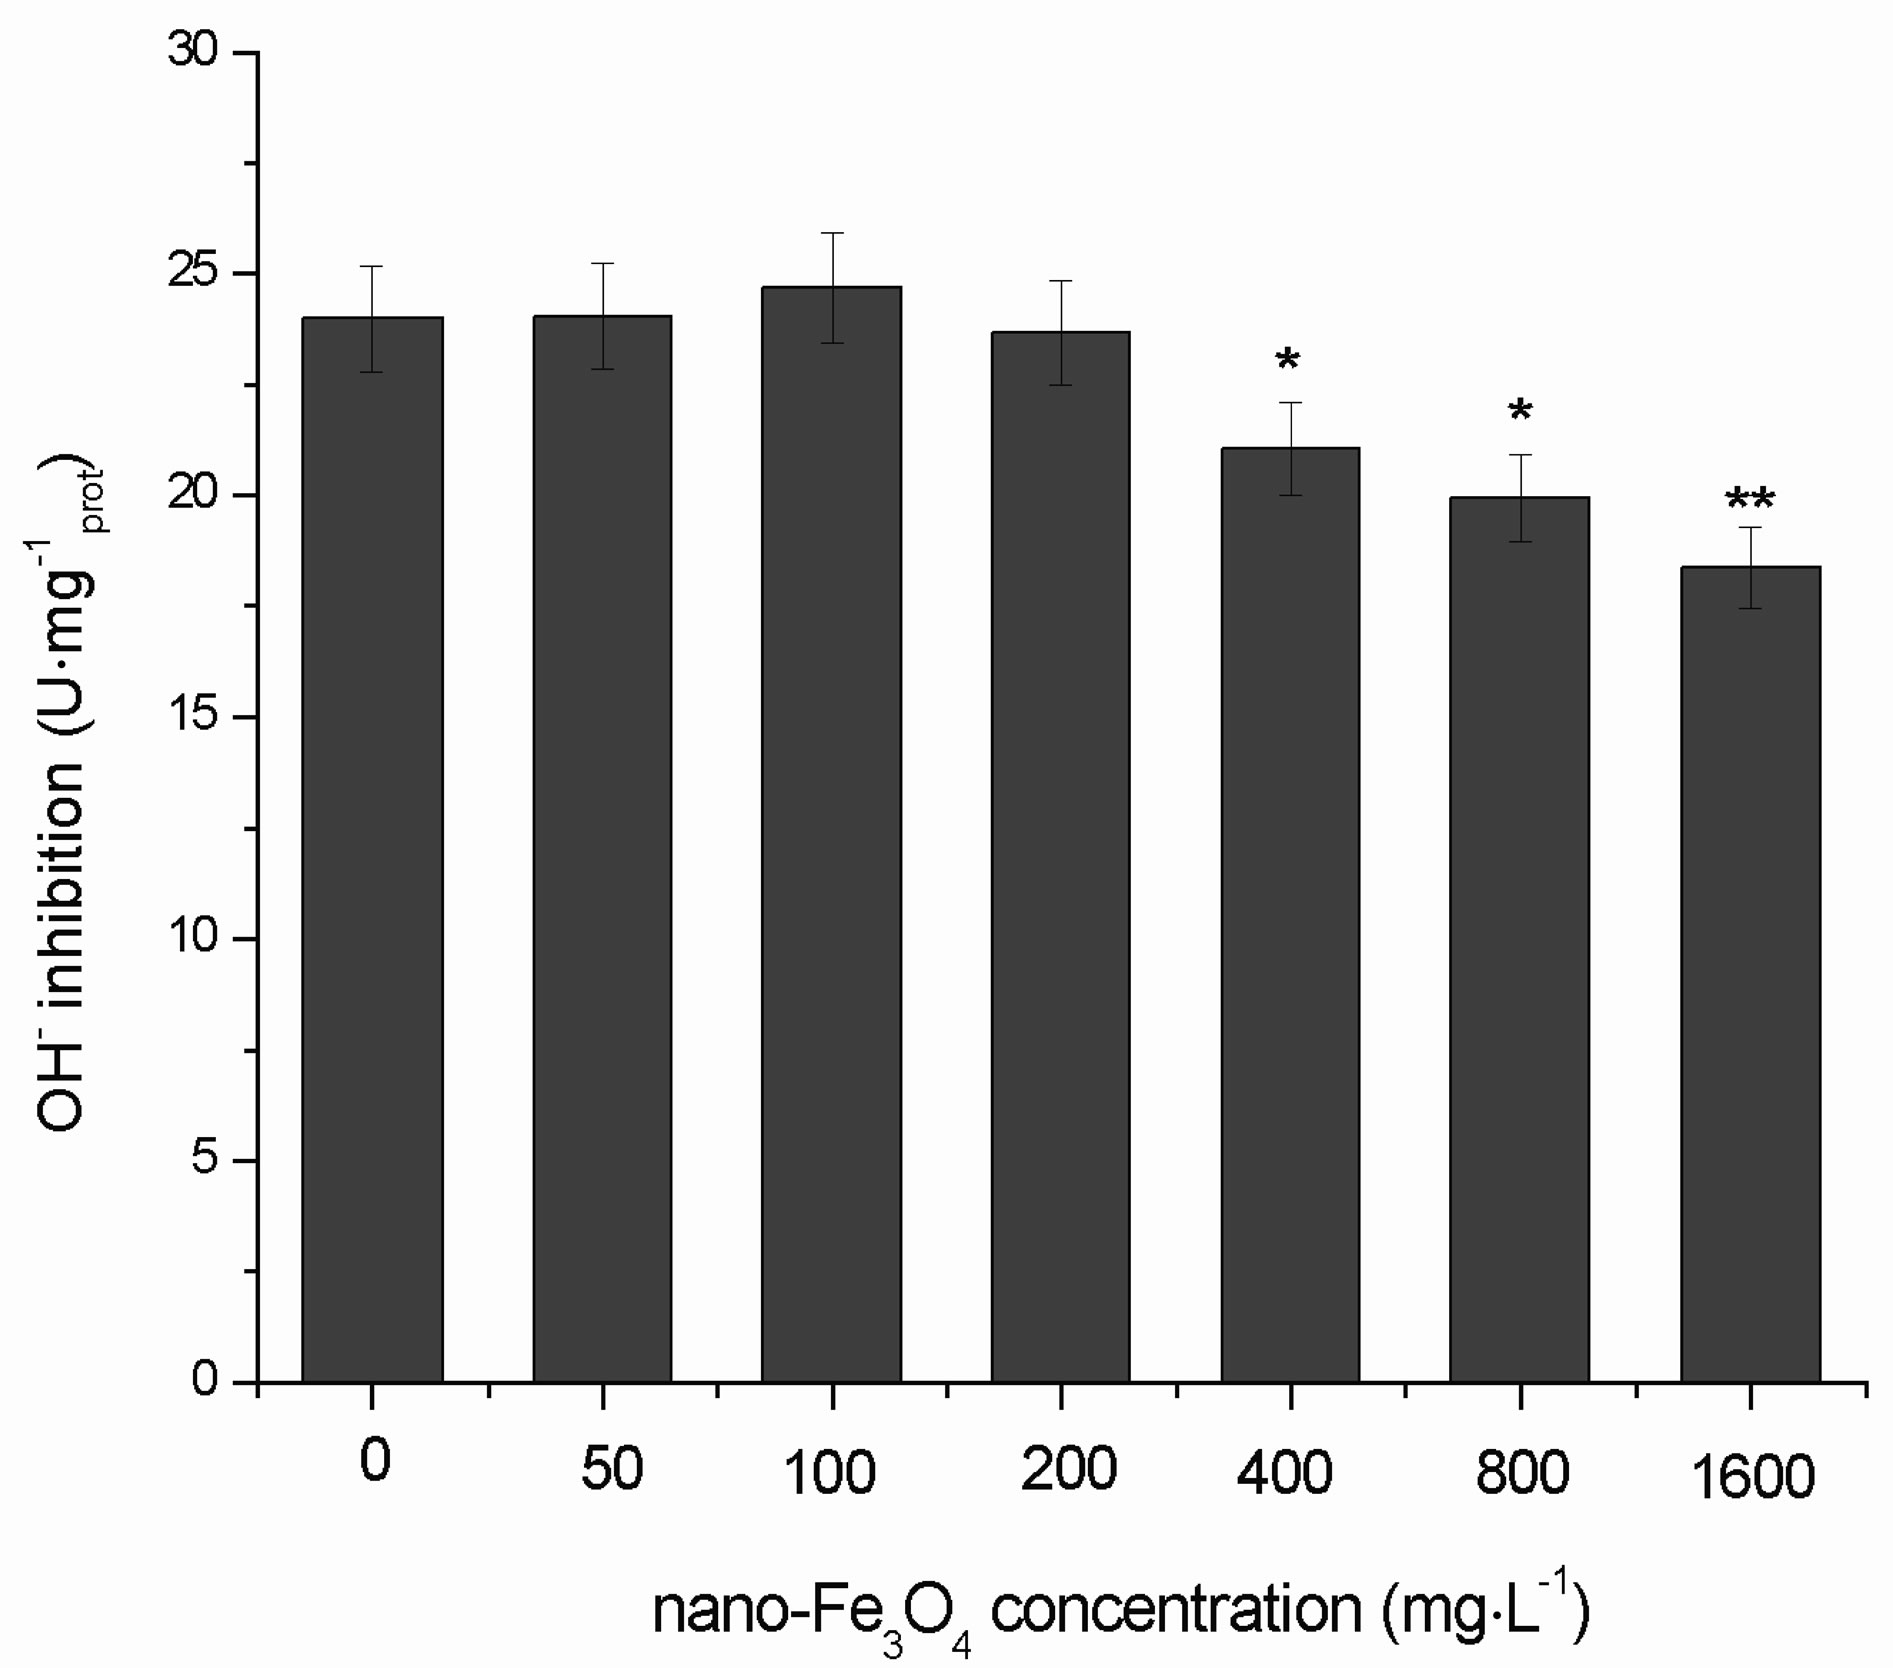
Figure 11. Effects of nano-Fe3O4 on inhibition of ·OH generation in C. vulgaris (F = 5.11; *p < 0.05 and **p < 0.01, compared with the control group).
studies have investigated the toxicity of nanomaterials on mammals, fish and other higher forms of life [19-21]. Toxicity of nano-Fe3O4 and photosynthetic effects of nanomaterials have also been reported [22], but few. In the present study, the toxicity of nano-Fe3O4, which is an important nanomaterial, to C. vulgaris was investigated.
As primary producers in aquatic ecosystems, algae can utilize solar energy for photosynthesis. Chloroplasts in the algae use the solar energy to covert CO2 and water into glucose while generating oxygen.
This process is crucial for the survival of almost all organisms in aquatic ecosystems. If the photosynthetic balance is upset, both the oxygen supply and nutrient balance of carbon in aquatic ecosystems are directly affected. Therefore, photosynthesis is essential to the stability of the entire aquatic environment.
Chlorophyll is an important participant in the photosynthetic reaction. The main chlorophyll species involved in phytoplankton photosynthesis are chlorophyll a, b and c. Chlorophyll a is present in all types of phytoplankton, and its concentration is related to the level of photosynthesis and is an important indicator of phytoplankton biomass. The amount of chlorophyll a is routinely determined in biological monitoring of lakes, reservoirs, and other water bodies.
In this study, the chlorophyll a content was observed to decrease as the nano-Fe3O4 concentration increased. However, among exposure groups with nano-Fe3O4 concentrations > 100 mg·L–1 the changes were relatively flat. These results show when the concentrations are higher than a certain level (100 mg·L–1), nano-Fe3O4 has a significant toxic effect on the chlorophyll a content in C. vulgaris. And as the concentration (200 mg·L–1) increase, the toxicity change is relatively flat.
CO2 is a raw material in photosynthesis, and its concentration and amount absorbed directly affect the efficiency of photosynthesis. The net photosynthetic rate (Pn) is an important index in plant photosynthesis research, and is usually expressed as the amount of CO2 absorbed by the plant during photosynthesis per unit area and unit time (mg·dm–2·h–1). In this study, as the nano-Fe3O4 concentration increased, both the amount of CO2 absorbed over a certain period and the net photosynthetic rate decreased in C. vulgaris. These results illustrate that nanoFe3O4 has a significant toxic effect on CO2 absorption and the net photosynthetic rate. These results agree with the chlorophyll a results on the toxic effect of nanoFe3O4 in C. vulgaris.
It was noted that when the nano-Fe3O4 concentration was only 50 mg·L–1, the photosynthetic toxicity of nanoFe3O4 in C. vulgaris was not significant. Therefore, we propose that 50 mg·L–1 is a safe concentration for nanoFe3O4 to avoid photosynthetic toxicity.
One of the commonly accepted mechanisms of nanomaterial toxicity is through induced reactive oxygen species (ROS) generation [21] and subsequent oxidative stress [23].
Oxidative stress can be quantitatively evaluated using three types of markers. The first category includes ROS such as superoxide anions (O2–), ·OH, and hydrogen peroxide (H2O2). In our study, ·OH was selected as a marker for quantitative evaluation of oxidative stress. The Fenton reaction produces ·OH from H2O2, and the amount of H2O2 used in the reaction is proportional to the amount of ·OH produced. The second category includes lipid peroxidation products such as ketones and other carbonyl compounds, hydroxyl compounds, and malondialdehyde (MDA). MDA is an important marker of lipid peroxidation and cellular oxidative damage. Lipid peroxidation turns ROS into the active chemical agents by non-free radical decomposition products of lipids, and amplifies the role of ROS by chain or branched chain reactions. ROS induces cell damage by peroxidation of polyunsaturated fatty acids in the biomembrane, and through the decomposition products of lipid hydroperoxide. Determination of the MDA content can reflect the extent of lipid peroxidation and indirectly reflect the degree of cell damage. The third category includes enzymes that are active in the ROS elimination system and non-enzymatic and enzymatic antioxidants. Non-enzymatic antioxidants include vitamin C, vitamin E, and glutathione (GSH). GSH is a low molecular weight scavenger for species such as the O2– and H2O2. GSH is a major non-protein thiol and a substrate for erythrocyte glutathione peroxidase and glutathione Stransferase, indispensable for their decomposition of hydrogen peroxide. GSH can also stabilize thiol-containing enzymes. Therefore, it is important to determine the GSH content when evaluating the antioxidant capacity. Superoxide dismutases (SODs) are important enzymatic antioxidants that catalyze the reaction of superoxide with hydrogen ions to generate H2O2 and O2. SODs scavenge superoxide anion radicals to prevent cell damage, and play a vital role in the balance between oxidation and antioxidation. Under normal conditions, antioxidants will eliminate excess oxygen free radicals and achieve a dynamic balance. However, under external stress, the level of oxygen free radicals in the cell will increase, which will in turn increase enzyme activity in the antioxidation system to effectively remove the excess harmful substances. Once the oxygen free radical content exceeds a certain level, the free radicals are not efficiently removed by the antioxidation system, and excess free radicals accumulate and decrease the enzyme activity in antioxidation [24].
The MDA content in C. vulgaris gradually increased as the nano-Fe3O4 concentration increased, and the MDA content was significantly different to that in the control group with >400 mg·L–1 nano-Fe3O4. These results indicate that nano-Fe3O4 stress increases the MDA content in C. vulgaris, exacerbates lipid peroxidation of C. vulgaris, and leads to membrane damage in the algal cells.
The GSH content in C. vulgaris decreased as the nano-Fe3O4 concentration increased, and GSH content was significantly different to that in the control group with >200 mg·L–1 nano-Fe3O4. In the low concentration of nano-Fe3O4 stress, small increases in GSH content were observed, which may be an adaptative response of C. vulgaris to the stress. By increasing formation of GSH, C. vulgaris enhances its resistance to ROS damage by increasing the efficiency of ROS scavenging. By contrast, the GSH content decreased in the high concentration of nano-Fe3O4 stress, which may be attributed to the consumption of a large amount of the GSH in a variety of detoxification processes. In the high concentration of nano-Fe3O4 stress, destruction of antioxidation structures and a decrease in the level of antioxidants probably occurs, which results in rapid accumulation of ROS.
As the nano-Fe3O4 concentration increased, the SOD activity change in a unimodal manner. When the nanoFe3O4 concentrations were <400 mg·L–1, the SOD activity significantly increased. This shows that at low nanoFe3O4 concentrations, production of SOD is induced in C. vulgaris to remove excess ROS and protect the organism. When the nano-Fe3O4 concentrations were >400 mg·L–1, the SOD activity decreased gradually. This indicates that at high nano-Fe3O4 concentrations, the C. vulgaris cell structure is destroyed because the self-protection systems of the organism cannot function at this level.
The curve for the change in inhibition of ·OH generation as the nano-Fe3O4 concentration increased was also unimodal. When the nano-Fe3O4 concentrations were <200 mg·L–1, the inhibition of ·OH generation slightly increased. This indicated that under stress of low concentrations of nano-Fe3O4, the self-scavenging capacity of C. vulgaris for ·OH improves to protect the organism. The changes in the inhibition of ·OH generation at nanoFe3O4 concentrations > 200 mg·L–1 were significant, which suggested that significant oxidative damage occured. This concentration (200 mg·L–1) can be taken as safe concentration to avoid oxidative damage of ·OH generation induced by nano-Fe3O4.
5. CONCLUSIONS
This is the first study to investigate the ecotoxicity of nano-Fe3O4 in a model organism, C. vulgaris. NanoFe3O4 was found to have a significantly effect on the contents of chlorophyll a, MDA and GSH, amount of CO2 absorbed, net photosynthetic rate, SOD activity and inhibition of ·OH generation in C. vulgaris. At higher concentrations, compared with the control group, the toxicity of nano-Fe3O4 was significantly different.
To date, most studies have focused on the toxicological effects of nanomaterials on fish, but studies on other aquatic organisms such as phytoplankton have been limited, and there have been no studies on the photosynthetic toxicity effects of nanomaterials. As primary producers in the aquatic environment, algae provide energy for the entire aquatic ecosystem. Adverse effects of nanomaterials on algal photosynthesis could directly damage the ecological balance in aquatic environments and negatively impact the entire ecosystem.
Because of rapid development in the nanotechnology industry, the use of nano-Fe3O4 has gradually become more common in catalysis, biomedicine, and microwave absorbing materials. However, there is a lack of data on the toxicological effects of nano-Fe3O4. A preliminary investigation of these effects was conducted in the present study, and it can be concluded that the ecotoxicity and environmental effects of nanomaterials cannot be ignored. Further studies of nanomaterial pollution are required to determine the pathway and extent of pollution, to systematically determine the ecotoxicity of nanomaterials, and to establish guidelines for evaluation of the ecological safety of nanomaterials. This will help reduce the environmental and health risks associated with widespread use of nanomaterials, and ultimately allow scientific and effective management of nanomaterial use. This will ensure that the development of nanotechnology can meet actual needs without undermining the principles of sustainable development.
6. ACKNOWLEDGEMENTS
This work was supported by the grants of the Chinese National Natural Science Foundation (21103059), the Chinese National Program for High Technology Research and Development (863 program) (2006AA03Z330) and Key Project of Chinese National Program for Fundamental Research and Development (973 program) (2010CB 933904).
REFERENCES
- Brumfiel, G. (2003) A little knowledge. Nature, 423, 246-248. doi:10.1038/424246a
- Konishi, Y., Nomura, T. and Mizoe, K. (2004) A new synthesis route from spent sulfuric acid pickling solution to ferrite nanoparticles. Hydrometallurgy, 74, 57-65. doi:10.1016/j.hydromet.2004.01.007
- Franger, S., Benhet, P. and Benhon, J. (2004) Electrochemical synthesis of Fe3O4 nanoparticles in alkaline aqueous solutions containing complexing agents. Journal of Solid State Electrochemistry, 8, 218-223. doi:10.1007/s10008-003-0469-6
- Wan, S.R., Huang, J.S., Yan, H.S., et al. (2006) Sizecontrolled preparation of magnetite nanoparticles in the presence of graft copolymers. Journal of Materials Chemistry, 16, 298-303. doi:10.1039/b512605c
- Wu, M.Z., Xiong, Y. and Jia, Y.S. (2005) Magnetic fieldassisted hydrothermal growth of chain-like nanostructure of magnetite. Chemical Physics Letters, 407, 374-379. doi:10.1016/j.cplett.2004.11.080
- Yao, K.L., Tao, J., Liu, Z.L., et al. (2004) Preparation and characterization of polymer-coated core-shell structured magnetic microbeads. Journal of Materials Science Letters, 20, 417-420.
- Handy, R.D., Kammer, F., Lead, J.R., Hassellöv, M., Owen, R. and Crane, M. (2008) The ecotoxicology and chemistry of manufactured nanoparticles. Ecotoxicology, 17, 287-314. doi:10.1007/s10646-008-0199-8
- Baun, A., Rasmussen, R.F., et al. (2008) Toxicity and bioaccumulation of xenobiotic organic compounds in the presence of aqueous suspensions of aggregates of nanoC60. Aquatic Toxicology, 86, 379-387. doi:10.1016/j.aquatox.2007.11.019
- Navarro, E., Baun, A., Behra, R., et al. (2008) Environmental behavior and ecotoxicity of engineered nanoparticles to algae, plants, and fungi. Ecotoxicology, 17, 372- 386. doi:10.1007/s10646-008-0214-0
- Pramanik, S., Banerjee, P., Sarkar, A., et al. (2008) Sizedependent interaction of gold nanoparticles with transport protein: A spectroscopic study. Journal of Luminescence, 128, 1969-1974. doi:10.1016/j.jlumin.2008.06.008
- Thill, A., Spalla, O., Chauvat, F., et al. (2006) Cytotoxicity of CeO2 nanoparticles for Escherichia coli: A physico-chemical insight of the cytotoxicity mechanism. Environmental Science and Technology, 40, 6151-6156. doi:10.1021/es060999b
- Handy, R.D., Kammer, F., Lead, J. R., et al. (2008) The ecotoxicology and chemistry of manufactured nanoparticles. Ecotoxicology, 17, 287-314. doi:10.1007/s10646-008-0199-8
- Wong, S.L., Nakamoto, L. and Wainwright, J.F. (1997) Detection of toxic organometallic complexes in wastewaters using algal assays. Archives of Environmental Contamination and Toxicology, 32, 358-366. doi:10.1007/s002449900197
- Grobbelaar, J.U., Kroon, B.M.A., Burger-Wiersma T. and Mur, L.R. (1992) Influence of medium frequency light/ dark cycles of equal duration on the photosynthesis and respiration of Chlorella pyrenoidosa. Hydrobiologia, 1, 53-62.
- Rai, L.C., Husaini, Y. and Mallick, N. (1998) pH-altered interaction of Aluminium and Fluoride on nutrient uptake, photosynthesis and other variables of Chlorella vulgaris. Aquatic Toxicology, 42, 67-84. doi:10.1016/S0166-445X(97)00098-2
- Seren, F., Krlov, K. and Blahov, M. (2008) Photosynthesis of Chlorella vulgarisas affected by diaqua (4-chloro-2- methylphenoxyacetato)copper(II) complex. Biologia Plantarum, 38, 71-75. doi:10.1007/BF02879638
- Jespersen, A.M. and Christoffersen, K. (1987) Measurements of chlorophyll-a from phytoplankton using ethanol as extraction solvent. Archiv für Hydrobiologie, 109, 445-454.
- Papista, E., Acs, E. and Boddi, B. (2002) Chlorophyll-a determination with ethanol-a critical test. Hydrobiologia, 485, 191-198. doi:10.1023/A:1021329602685
- Lam C.W., James J.T., McCluskey R. and Hunter R.L. (2004) Pulmonary toxicity of single-wall nanotubes in mice 7 and 90 days after intratracheal instillation. Toxicological Sciences, 77, 126-134. doi:10.1093/toxsci/kfg243
- Lin, W.S., Huang, Y.W., Zhou, X.D. and Ma, YF. (2006) In vitro toxicity of silica nanoparticles in human lung cancer cells. Toxicology and Applied Pharmacology, 217, 252-259. doi:10.1016/j.taap.2006.10.004
- Nel, A., Xia, T., Madler, L. and Li, N. (2006) Toxic potential of materials at nanolevel. Science, 311, 622-627. doi:10.1126/science.1114397
- Ji J., Long Z.F. and Lin D.H. (2011) Toxicity of oxide nanoparticles to the green algae Chlorella sp. Biochemical Engineering Journal, 170, 525-530.
- Donaldson K. and Tran C.L. (2002) Inflammation caused by particles and fibers. Inhalation Toxicology, 14, 5-27. doi:10.1080/089583701753338613
- Oncel, I., Yurdakulol, E., et al. (2004) Role of antioxidant defense system and biochemical adaptation on stress tolerance of high mountain and steppe plants. International Journal of Ecology, 26, 211-218.
NOTES
*These authors contributed equally to this work.