Open Journal of Molecular and Integrative Physiology
Vol.3 No.2(2013), Article ID:31303,10 pages DOI:10.4236/ojmip.2013.32010
Age dependent expression and distribution of nitric oxide (NO) synthase isoforms in the ovine kidney
![]()
1Department of Physiology & Pharmacology, Alberta Children’s Hospital Research Institute for Child and Maternal Health, University of Calgary, Calgary, Canada
2Department of Surgery, McCaig Institute for Bone and Joint Health, University of Calgary, Calgary, Canada
Email: fsmith@ucalgary.ca
Copyright © 2013 Devin W. Davis et al. This is an open access article distributed under the Creative Commons Attribution License, which permits unrestricted use, distribution, and reproduction in any medium, provided the original work is properly cited.
Received 3 April 2013; revised 3 May 2013; accepted 10 May 2013
Keywords: Postnatal; Kidney; Newborn; iNOS; eNOS; nNOS; Nitric Oxide
ABSTRACT
The aim of the present study was to measure intrarenal spatial and temporal localization of all three nitric oxide synthase (NOS) isoforms in the developing ovine kidney. Reverse transcriptase-polymerase chain reaction (RT-PCR), Western Blot analyses, and in situ hybridization techniques were performed for NOS I - III isoforms in renal tissue obtained from sheep aged ~24 h, one, three, six, and 12 weeks post natally (N = 3). RT-PCR performed on cortical and medullary kidney tissue revealed the presence of all three NOS isoforms from day one to 12 weeks postnatally. NOS I and NOS II mRNA levels were greater in cortex compared to medulla during the first three weeks whereas NOS III mRNA levels were predominantly transcribed within the medulla. In all NOS isoforms, there was a decrease in cortical mRNA levels after three to six weeks. Protein levels confirmed the presence of all three NOS isoforms over the first three months of postnatal life. By demonstrating NOS isoform transcripts to be more abundant in the early post natal period, these findings may provide insight into the age dependent role of NO in modulating kidney function during ontogeny.
1. INTRODUCTION
The endothelial derived relaxing factor, nitric oxide (NO), is a gaseous free radical that functions as an endogenous mediator of a variety of physiological processes. Through its effects on vascular smooth muscle, NO is involved in the maintenance of organ blood flow and blood pressure regulation. In addition, NO modulates renal hemodynamics and function, possesses immunomodulatory as well as cytotoxic effects, and may act as a neurotransmitter in the central nervous system. NO production is regulated by NO synthases (NOS), of which there are three distinct isoforms: neuronal NOS (nNOS, or NOS I), inducible NOS (iNOS, or NOS II), and endothelial NOS (eNOS, or NOS III). Numerous transcriptional, translational, and post-translational controls govern the timing, magnitude, and spatial distribution of NO release [1].
In previous studies carried out in conscious, chronically instrumented lambs, we provided evidence that some of the physiological effects of NO are developmentally regulated [2-4]: Administration of the L-arginine analogue, NG-nitro-L-arginine methyl ester, L-NAME, which prevents NO production from NOS isoforms, is associated with age-dependent effects on renal hemodynamics and function: After treatment with L-NAME, there is a marked increase in renal vascular resistance (RVR), which is greatest at one-week, and least at six weeks, post natally [3]. Also, after administration of L-NAME to one-week old lambs, glomerular filtration rate (GFR) and filtration fraction (FF) decrease by ~50% whereas in six-week old lambs, GFR and FF remains constant after L-NAME [5]. In lambs aged ~six weeks, proximal fractional Na+ reabsorption decreases after L-NAME administration, resulting in a prompt natriuresis; in contrast, there are no effects on proximal fractional Na+ reabsorption at one-week. These findings demonstrate that, in conscious lambs, endogenously produced NO modulates glomerular and tubular function in an age-dependent manner [5].
The renal distribution of NOS I and III also appears to be developmentally regulated, at least in some species: For example, renal NOS I [6] and NOS III mRNA [7] in piglets and adult pigs showed developmental patterns of expression. Fischer et al. [8] measured the post natal development of NOS I expression in the rat kidney and found that it follows a cortico-medullary pattern ranging from single cell expression in the immature nephron to its full presence in the macula densa of nephrons in the mature kidney [8]. Similarly for NOS III, Hanm et al. [9] demonstrated a unique corticomedullary pattern in the newborn rat kidney which was distinct from that observed in the adult rat kidney.
To date, any age-dependent changes in NOS expression in the ovine kidney which could explain the aforementioned physiological findings have not been investigated. Moreover, there have been no previous investigations into the developmental patterns of renal expression for all three NOS isoforms. Therefore, the aim of the present experiments, was to measure mRNA and protein expression for NOS I, II and III from day one to 12 weeks of post natal life in the developing ovine kidney. In addition, NOS transcripts were localized using in situ hybridization techniques in order to evaluate the localization of the three NOS isoforms during this post natal period.
2. METHODS
Sheep (ovis aries) were obtained from a local vendor (Woolfitts, Acres, Olds, Alberta, Canada) and euthanized in accordance with the “Guide to the Care and Use of Experimental Animals” provided by the Canadian Council on Animal Care and with the approval of the Animal Care Committee of the University of Calgary. There were three experimental protocols which evaluated: 1) mRNA expression using RT-PCR, 2) immunoreactive protein levels using Western Blot analyses, and 3) mRNA localization using in situ hybridization techniques. Each protocol was carried out in different tissue and from different groups of animals as detailed below.
2.1. Experimental Protocol I
2.1.1. Tissue Preparation
Sheep of either sex and aged 24 h, one, three, six, and twelve weeks of post natal life (N = 3 at each age group) were humanely euthanized (see Table 1 for demographic details). Either kidney was rapidly excised and divided
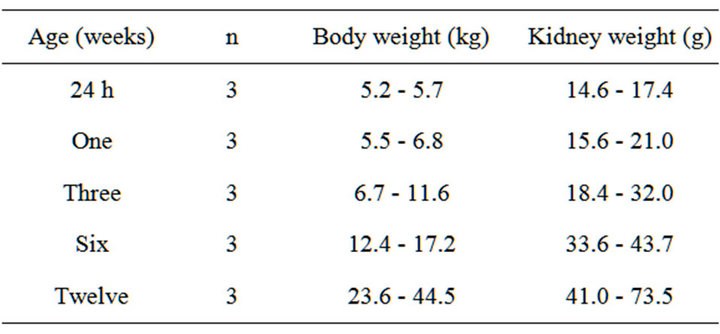
Table 1. Demographic data.
sagittally along pyramidal borders. Cortical and medullary regions were separated, rinsed in sterile, phosphate-buffered saline (PBS) to remove blood, blotted on filter paper, weighed, and snap frozen in liquid nitrogen for storage at −80˚C until RNA extraction, as detailed below.
2.1.2. RNA Extraction and RT-PCR
The TRIspin method was used to measure total RNA [10]: Frozen tissue was powdered in a liquid nitrogen-cooled Braun Mikro-Dismembrator Vessel, TRIZOL reagent (1 mL·100 mg·tissue−1) was added to the homogenate, and the sample incubated at room temperature to allow for complete dissociation of nucleoprotein complexes and then combined with chloroform (0.3 mL). Samples were vortexed and centrifuged at 12,000 rpm for 15 min at 4˚C, and the upper layer transferred and ethanol added. The precipitate was obtained, solubilized, and total RNA isolated using the RNeasyÒ Total RNA Kit (Qiagen, Chatsworth, CA). The yield of RNA was quantified fluorometrically using a reagent (Sybrgreen II; Mandel, Guelph, Ontario, Canada) [11], over the linear range 100 to 800 ng·mL−1 and stored at −80˚C until analyzed.
Total RNA (1 μg) was reverse-transcribed (RT) into cDNA using the Reverse Transcription Kit with random primers (Omniscript RT Kit; Qiagen, Mississauga, Ontario, Canada), according to the manufacturer’s protocol. The newly synthesized cDNA, stored at −20˚C, was amplified by polymerase chain reaction (PCR) [12-14] using sheep-specific primers designed using Primer Express Software (Applied Biosystems). For details of gene of interest, primer sequences, base pairs, sources, annealing temperature and cycle numbers, see Table 2. This PCR protocol was designed to result in product yields within the linear range of the PCR amplification. All samples were reverse transcribed and subjected to PCR simultaneously to avoid any potential variation in the efficiency of the procedures. PCR product was purified using a Qiagen PCR purification kit and subsequently verified by sequencing. PCR products were visualized by electrophoresis of 20 mL of reaction mixture on a 2% agarose gel at 60 V/cm in TAE buffer. Gels were stained with ethidium bromide, destained in distilled water, photographed and analyzed using a BioRad GelDoc (BioRad Corporation) with Discovery Series Quantity One 1-D Analysis software (version 4.5.1). Integrated density values were normalized to the housekeeping gene β-actin, to yield a semi-quantitative assessment of individual transcript levels. In another system, recent direct comparisons of mRNA levels using the rigorously controlled semi-quantitative methods described above to real-time PCR results (BioRad iCycler) have revealed nearly identical outcomes (Hart DA and Reno CR; unpublished observations).
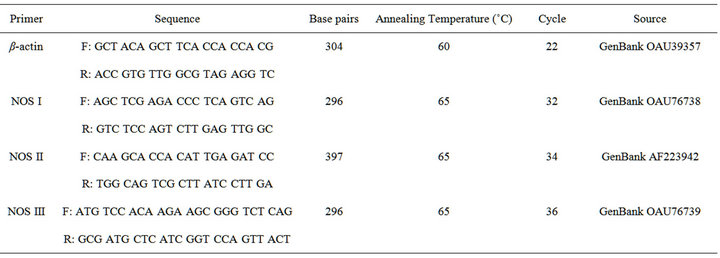
Table 2. Primer sequences and PCR conditions.
2.2. Experimental Protocol II
Protein was isolated and quantified using a RCDC BioRad Protein Reagent Kit (BioRad Laboratories Ltd, Mississauga, ON) on a cuvette compatible Cary 300 UVVisible Spectrophotometer (Agilent Technologies, Mississauga, ON). Electroblotting and a 7.5% sodium dodecyl sulfate plyacrylamide gel electrophoresis (SDS-PAGE) were used to separate proteins with gels made from 30% Protogel (National diagnostics, Diamed, Mississauga, ON) onto 0.45 µm nitrocellulose membranes (BioRad Laboritories Ltd, Mississauga, ON). There is a high sequence homology (90% - 95%) for the same NOS isoform across species [15,16]. In the present study, proteins were exposed to rabbit polyclonal antibodies (Santa Cruz, USA) against human NOS I (epitope corresponding to amino acids 2 - 300 mapping at the N-terminus, 155 kDa), NOS II (amino acid 1 - 20 mapping at the N-terminus, 130 kDa) and NOS III (amino acids 2 - 160 mapping at the N-terminus, 140 kDa) at a dilution of 1:400 in 5% skimmed milk PBST and subsequently, goat anti-rabbit IgG HRP-conjugated secondary antibody (1: 1000). Immunoreactive proteins were visualized using chemiluminescence reagents (Immobolin Western Chemiluminscent HRP Substrate) and blots analysed using densitometric analysis software (Discovery Series Quantity One, version 4.5.1). GAPDH was used as loading control to normalize NOS expression. To verify that GAPDH was not regulated by development, the level of each NOS isoform was also normalized for the amount of protein loaded.
2.3. Experimental Protocol III
2.3.1. Tissue Preparation
Upon euthanization as described for Protocol I, the kidney was rapidly excised and the renal capsule was removed. Kidneys were then cut in coronal sections and dissected into columns which were immediately embedded in Fisher Histo Prep frozen tissue embedding media (Fisherbrand Scientific), and frozen at −80˚C. Kidney tissue samples were obtained at the same ages as for Protocol I.
2.3.2. Riboprobe Synthesis
Subcloning of unique PCR fragments for NOS I, II and III, was performed using PCR 2.1-TOPO (Invitrogen, Carlsbad, CA). Sequences of forward and reverse primers for the three NOS isoforms are shown in Table 2. The resulting plasmids were sequenced using the DNA Services Core Facility of the University of Calgary, to confirm orientation and heterogeneity of nucleotide sequences and to rule out cross talk between riboprobes, using NOS II sense as a negative control. Bacteria were cultured and selected after growth on agar plates containing ampicillin, at 37˚C overnight. Bacterial colonies were further amplified and plasmids extracted using QIAprep Spin Miniprep Kit (Qiagen). Probe synthesis was then performed following linearization of the plasmid with BamH1, and in vitro transcription for synthesis and digoxigenin (DIG)-labelling using T7 RNA polymerase. Evaluation of BLAST searches for each isoform sequence confirmed the specificity of the probes.
2.3.3. In Situ Hybridization
Cryosections of 10 mm were cut onto superfrost plus slides (Fischer), and heated to 65˚C for 2 h, rinsed in PBS, and fixed in 4% paraformaldehyde. Sections were then permeabilized in proteinase K (10 mg·mL−1 in PBS) at 37˚C for 30 min, post-acetylated in 200 mL of 0.1 M TEA with 1 mL of acetic anhydride, and twice rinsed in standard saline citrate (SSC). The transcribed riboprobe was verified using Dot-blot analysis and concentrations were determined using spectrophotometry (Ultrospec™ 2100 pro UV/Visible Spectrophotometer). Approximately 300 ng·mL−1 of probe was placed in hybridization buffer (formamide 100%, 20 × SSC, 50 × Denhardts solution (Sigma)), denatured salmon sperm DNA (5 mg·mL−1), yeast tRNA (20 mg·mL−1, Roche), 50% dextran sulphate) and immersed onto tissue sections at 48˚C for 16 h. Negative controls consisted of tissue sections treated with RNAse A pre-hybridization buffer only, hybridization buffer without probe, and hybridization buffer containing NOS III sense probe. After rinsing in RNAse A and blocking via sheep serum, antibody solution (1/500 anti-DIG antiphosphatase, Roche) was applied and sections incubated at 28˚C for 3 h. After rinsing in PBS, sections were processed for detection by the addition of nitro-blue tetrazolium (NBT) and 5-bromo-4- chloro-3-indolyl-phosphate (BCIP). Following the chromogenic reaction, slides were rinsed in ddH2O, followed by eosin Y counterstaining, stepwise dehydration in graded ethanol, clearing in Citri Solv (Fisherbrand Scientific), and mounted using Cytoseal XYL (Fisherbrand Scientific). Sections were viewed using a microscope (Zeiss Axiostar plus; Zeiss Instruments.) with the assistance of a renal pathologist.
2.4. Data Analyses
For protocol I and II, measurements were averaged and statistical analyses carried out using one-way ANOVA followed by Holm-Sidak multiple comparisons, using a confidence interval of 95%. Data are presented as mean ± SD. For protocol III, photographs (n = 248) were taken from tissue sections (n = 192) and evaluated in a blinded qualitative analysis by two independent scorers, according to previously published methods [17]. Values represent averages of scoring as absent (−), low (+), moderate (++), and high (+++).
3. RESULTS
3.1. Experimental Protocol I
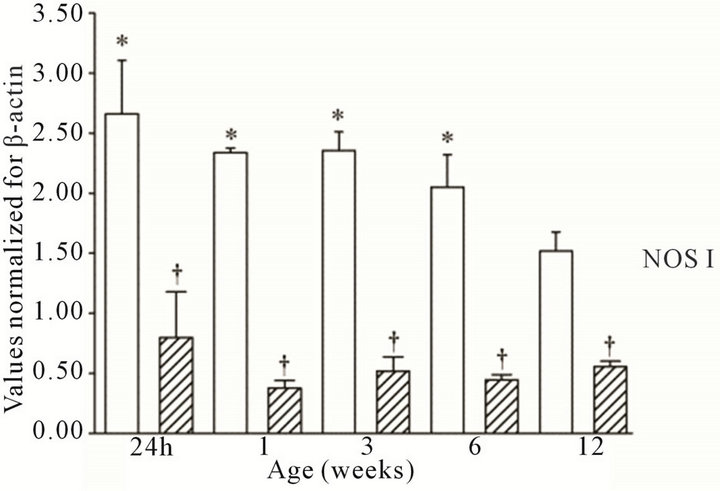
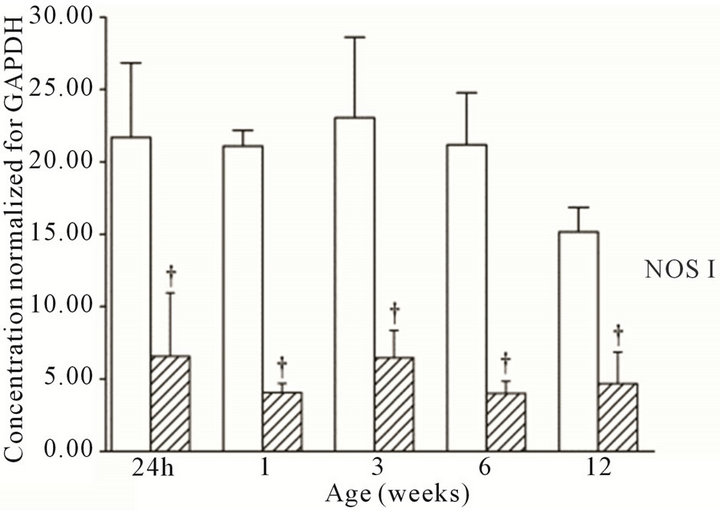
All three NOS isoforms were expressed in the cortex and medulla of the developing ovine kidney over the first three months of post natal life. NOS I mRNA was higher in the cortex as compared to the medulla at all age groups (Figure 1(a)). Cortical mRNA levels decreased from six to 12 weeks of age whilst medullary levels remained low. NOS II mRNA levels were higher in cortex than medulla during the first three weeks post natally; both cortical and medullary levels decreased after three weeks (Figure 1(b)). Medullary levels fluctuated in a defined pattern. NOS III mRNA was predominantly transcribed within the medulla, with higher levels as compared to the cortex at 24 h, and again from three to 12 weeks (Figure 1(c)). Cortical mRNA levels decreased after six weeks. Representative images (n = 3) of NOS
 (a)
(a)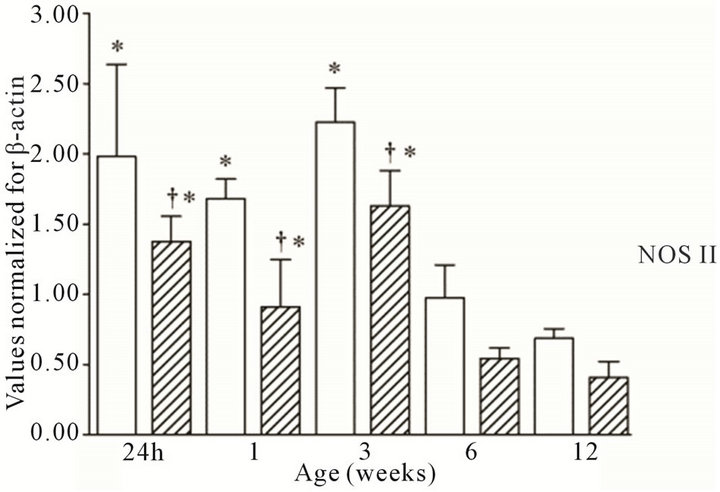 (b)
(b)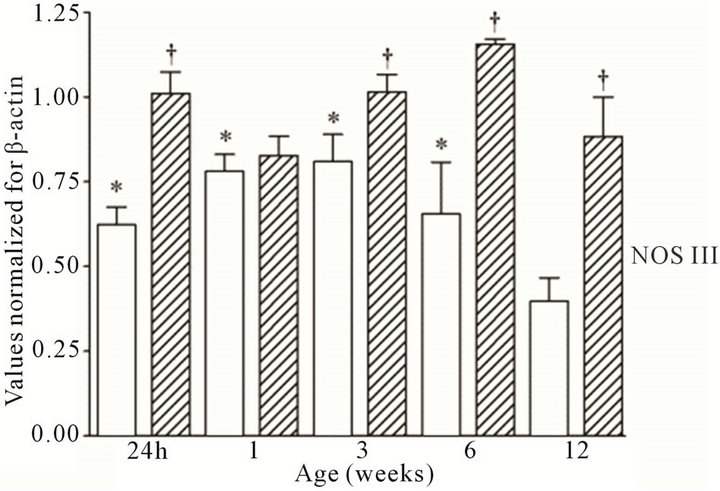 (c)
(c)
Figure 1. NOS mRNA expression cortex, open bars; medulla hatched bars. †p < 0.05 compared to cortex; *p < 0.05 compared to 24 h.
I-III in cortex and medulla from 24 h to 12 weeks are presented in Figure 2. Results for non-reverse transcriptase controls were negative indicating undetectable levels of genomic DNA.
3.2. Experimental Protocol II
Immunoreactive proteins for all three NOS isoforms
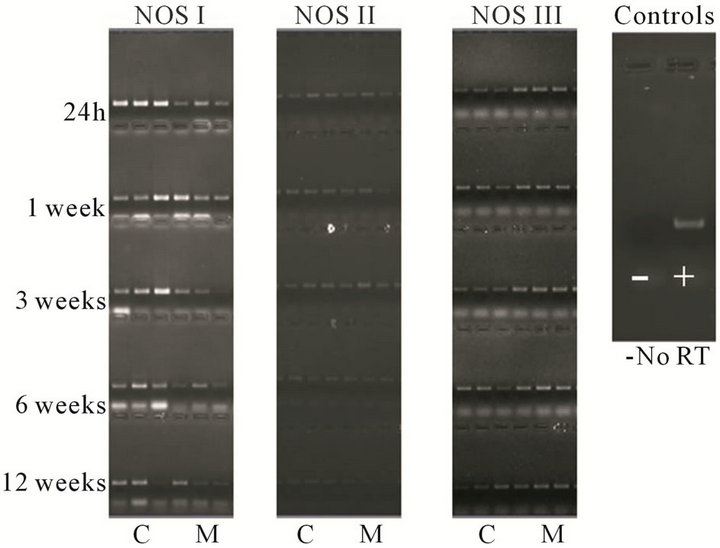
Figure 2. Representative RT-PCR images for each isoform NOS I, II, and III, the first three lanes are cortex (C) and the last three lanes are medulla (M).
were present in the cortex and medulla of the developing ovine kidney over the first three months of post natal life. NOS I protein levels were more than two-fold higher in the cortex as compared to the medulla at all age groups (Figure 3(a)). Cortical levels decreased from six to 12 weeks of age, whilst medullary levels remained low. NOS II protein levels were higher in the medulla than cortex during the first week post natally (Figure 3(b)). For the NOS III isoform, protein levels appeared predominant in the medulla as compared to the cortex at 24 h, and one and three weeks (Figure 3(c)). Immunoreactive levels of the three NOS isoforms, when corrected for the amount of protein loaded, showed similar results as when normalized for GAPDH.
3.3. Experimental Protocol III
All three NOS isoforms were localized within the ovine kidney post natally (see Figure 4 and Table 3). NOS I transcripts were detected in highest abundance within the cortex from one day to three weeks. At 24 h, NOS I was localized to glomeruli, arterioles, and arteries. At one week, transcripts were still localized to glomeruli, and although fainter, the signal could be detected in arterioles. This trend continued at three weeks, with signal also present in proximal convoluted tubule (Figure 4(G)). Cortical signal for NOS I was negligible at six to 12 weeks. NOS II showed the lowest abundance overall, with transcripts negligible after six weeks (Figure 4(K)). At day one, NOS II transcripts appeared to be present in glomerular arterioles and macula densa, and at one week, NOS II was predominantly localized to glomeruli, although some faint staining could be detected in tubular cells.
Staining was still positive in glomeruli at three weeks but not detectable at six and twelve weeks. NOS III
 (a)
(a)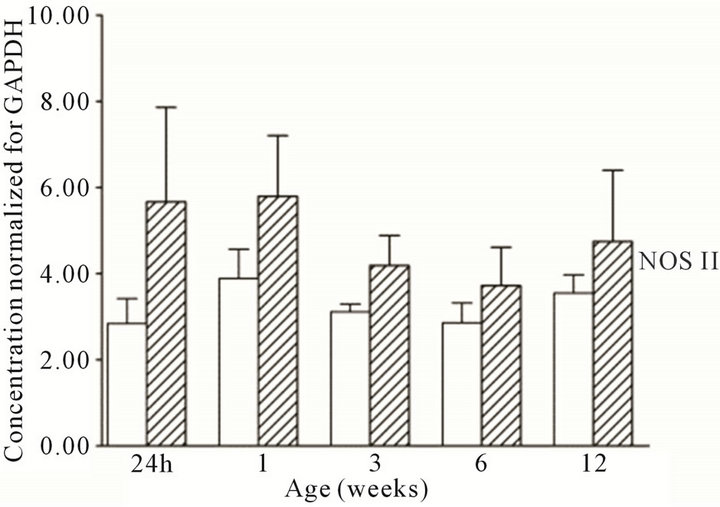 (b)
(b)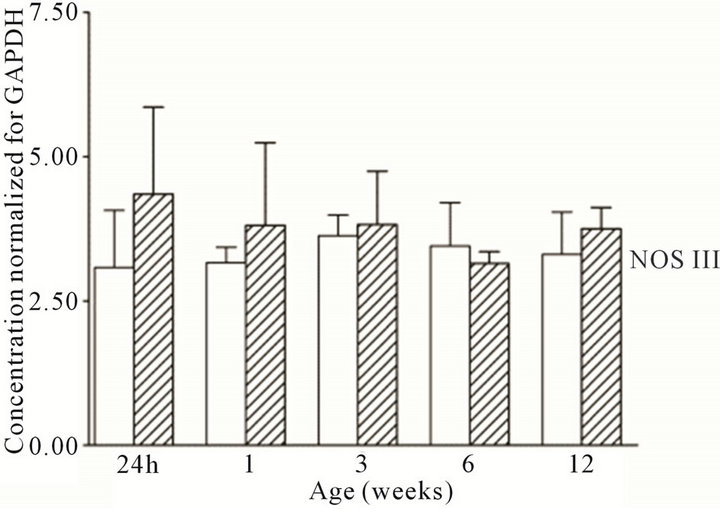 (c)
(c)
Figure 3. NOS protein expression cortex, open bars; medulla hatched bars. †p < 0.05 compared to cortex.
showed predominant transcription within the mesangium of the glomeruli and arterioles at 24 h, and increased within the medulla as compared to the cortex after three weeks; peritubular capillaries were devoid of signal (Figures 4(C) and (F)).
With respect to overall scores (Table 3), NOS I transcripts showed a down regulation in signal with post
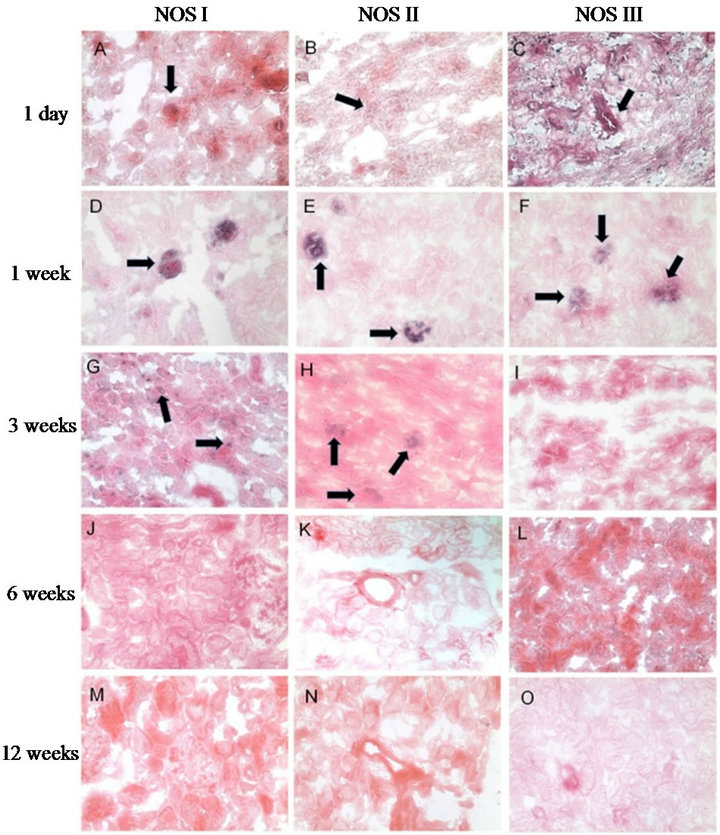
Figure 4. In situ hybridization of NOS isoforms. Upper panel to lower panel: 24 h, one week, three weeks, six weeks, twelve weeks. Left column to right column: NOS I - III. All pictures show ovine cortical renal tissue treated with anti-sense digoxigenin coupled riboprobes at 200× magnification. Localization to specific structures is shown by arrows.
natal age, with a substantial decrease after three weeks. The medullary score, which was highest within the one day age group, was less than that of the cortical score at all ages. The NOS II isoform had the lowest scores overall of all three isoforms. There was again, a substantial decrease of NOS II after three weeks. Within the first three age groups the cortical signal was substantially higher than that of the medulla. NOS III showed low to moderate signal at all age groups. There was a slight decrease in cortical signal at three, six, and twelve weeks.
4. DISCUSSION
In the present experiments, we measured mRNA and immunoreactive protein expression for NOS I, II and III from day one to 12 weeks of post natal life in the ovine kidney and localized transcripts intra-renally. Novel findings of our experiments are that all three NOS isoforms are present within the developing ovine kidney from the day of birth, with profiles of mRNA expression and localization being developmentally regulated. This study provides the first evaluation of all NOS isoforms concurrently within the developing ovine kidney and a detailed time-line of their distribution from the day of birth through to three months. These data may help to explain effects of NO in modulating renal hemodynamics and function early in life.
Kidney tissue was evaluated from day one, where nephrogenesis is complete near term in sheep, through to juvenile young adult sheep at pubescence (12 weeks). This profile provides a thorough range of ages from the time of birth through the transition of the newborn period (over the first three weeks) and to the young adult stage (at 12 weeks). All three NOS transcripts were localized to various extents within glomeruli at one week. Interestingly, all cortical NOS enzyme transcripts decreased by 12 weeks of post natal age, with changes occurring over the period three to six weeks. The increased abundance of all three NOS transcripts within the cortex in the immediate newborn period and the decreases detected postnatally provide evidence to support the premise that basal levels of NO may regulate glomerular function to a greater extent early in life (perhaps through all three isoforms), thus supporting our in vivo findings. This was especially evident for NOS I, in that mRNA as well as protein expression were considerably greater in cortex than medulla at all postnatal ages with cortical expression decreasing as postnatal maturation proceeded. In young adult (~3 months) and senescent Fisher rats (~24 months), NOS I and NOS III transcripts are opposite—that is, levels are greater in medulla as compared to cortex [18].
Localization of NOS II transcripts to the glomerulus at one week may also have implications for this enzyme in regulating GFR, a previously unidentified physiological role for the so-called inducible isoform. Physiological studies are, however, likely warranted before any definitive conclusions can be made regarding the function of the NOS II isoform in influencing kidney function in the immediate newborn period. Lack of statistical signifycance for the profile of changes in protein expression likely reflects the small N’s studied, and the robust tests applied. However, the trends for protein expression, in general, paralleled mRNA expression for all isoforms. The current data also illustrate a general decrease in all three NOS isoforms by ~six weeks of age, but no specific increase in NOS expression or localization in or around tubular structures which might be expected if there were alterations in tubular reabsorption of electrolytes by NO with age. Therefore, it is more likely that the tubular effects of L-NAME treatment observed in vivo at six weeks result from changes in other factors which directly modulate tubular function.
NOS isoforms are widely expressed in the kidney and changes in their phosphorylation state govern NO production. For example, there are known serine/ threonine phosphorylation sites on NOS I and NOS III. Dephosphorylation of these sites results in increased NOS activity and NO production. In the present study, all three isoforms (including NOS II) were present in the
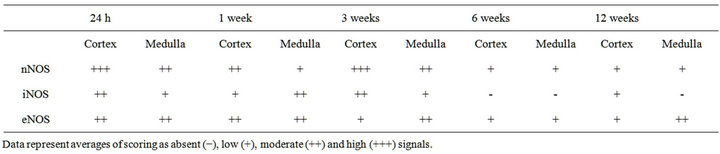
Table 3. In situ hybridization scoring.
immediate newborn period demonstrating the importance of the NO pathway in the adaptations of the kidney to post natal life.
Interestingly, the spatial distribution of the three NOS isoforms intrarenally overlapped in glomeruli and arterioles at some stages of post natal development perhaps providing evidence of redundancy of the system during the early newborn period. In the adult kidney, an interaction between the various NOS isoforms in influencing renal hemodynamics and function has been well characterized and at least the constitutive isoforms are known to exert specific functions under physiological conditions, exhibiting distinct localization and regulation [19-28]. For example, constitutive expression of NOS I mRNA is primarily in the macula densa and postganglionic nerve fibres [21,29-31] and implicated in the control of glomerular ultrafiltration and tubuloglomerular feedback [21]. NOS I has also been detected in medullary interstitial cells, and in principal cells of the collecting duct [32,33], although its role(s) in influencing water or electrolyte transport at these sites in vivo is not well understood. NOS III is predominantly expressed in vascular endothelial cells, hence its importance in regulating vascular resistance, tissue perfusion, oxygen consumption, as well as glomerular capillary pressure [20,26,34]. The constitutively expressed NOS III isoform is also reported to modulate tubulo-glomerular feedback, medullary blood flow, and NO-mediated inhibition of Cl− transport in the medullary thick ascending limb [35].
Consistent with our current findings, intra-renal distribution of all three NOS isoforms has been shown by Holmqvist et al. (2005) [36] in the mouse kidney, with NOS I localized predominantly to macula densa cells and NOS III restricted to vascular endothelial cells of glomerular capillaries, and small and large arteries. Their results also showed a down regulation of the constitutive isoforms (NOS I and III) and an up regulation of the inducible isoform (NOS II) after lipopolysaccaride treatment [36] Therefore, all intrarenal NOS isoforms may participate locally in different physiological processes both within the adult kidney and, in the newborn, developing kidney.
Generally considered an inducible isoform, NOS II is tonically expressed along the rat nephron including predominantly cells in the proximal straight tubule, thick ascending limb, distal convoluted tubule and inner medullary collecting duct suggesting its role in regulating tubular function [37,38]. NOS II can also be regulated via transcriptional and post-transcriptional mechanism by bacterial lipopolysaccharides, cytokines, and other inflammatory mediators; whether NOS II plays any significant regulatory roles under physiological conditions remains to be determined [19-20,39].
Changes in expression of NOS isoforms in the present study appeared to be most marked after three to six weeks, although there were slight discrepancies with regard to the timing of these changes between the methods employed to evaluate NOS mRNA expression– RT-PCR and in situ hybridization, which can be reconciled by their differences in signal detection. There was a general consistency between in situ and RT-PCR results where NOS I transcripts showed a down regulation in signal with post natal age, with a substantial decrease after three weeks. There was again a substantial decrease of NOS II after three weeks. The NOS III trends were consistent with RT-PCR findings although the cortical signal began to decrease earlier in the in situ hybridization studies as compared to RT-PCR results. Protein expression measurements similarly were not uniformly parallel with mRNA expression measurements, though again this is not surprising based on similar observations in ovine fetal lung tissue by Parker et al. (2000) [40], ovine fetal adrenal gland by Monau et al. (2009) [41], and rabbit placenta by Kahn et al. (2011) [42]. Whilst the underlying mechanisms of the changes occurring in NOS mRNA and protein expression at three to six weeks are not known at this time, it can be speculated that the marked changes in various aspects of kidney function across this time-spectrum such as the developmentally regulated decrease in RVR, and increase in GFR and FF, could be associated with alterations in NO production intrarenally, perhaps through age dependent alterations in phosphoregulatory processes. If so, then, NO production may be one of the major players in influencing kidney function early in life, as in the adult.
NOS I and III mRNA gene expression has been demonstrated in piglets and adult pigs [6,7] with a greater expression of NOS I in immature as compared to mature kidneys. In these studies, however, a detailed time-line demonstrating a developmental profile over which these changes occurred was not included. Fischer et al. [8] measured the expression and localization during post natal development of one NOS isoform (NOS I) and found that it follows a cortico-medullary pattern ranging from single cell expression in the immature nephron to its full presence in the macula densa of nephrons in the mature kidney; the strongest NOS I signals were seen in the distal tubule at day six, and in the afferent arteriole by day two of post natal life [8]. Also in the developing rat kidney, Hanm et al. [9] measured NOS III expression and intra-renal localization during fetal and early newborn life and showed a unique cortico-medullary pattern distinct from that observed in the adult with immunostaining greater in the developing cortex than medulla, and a strong expression of NOS III in the early stages of developing glomeruli and vasculature. To this literature, the current study provides measurements of cortical as well as medullary mRNA and protein expression and localizations of all three NOS transcripts intrarenally, over a three-month span, from the day of birth, throughout post natal development in the ovine kidney, and including the time periods over which physiological investtigations into the role(s) of endogenously produced NO have also been carried out [2,3,5,43,44].
5. CONCLUSION
The present study provides the first concurrent evaluation of all NOS isoforms within the developing kidney, and a detailed time-line of intra-renal distribution over the first three months of post natal life. The results help to elucidate our previous observations of age-dependent physiological responses to removing endogenous NO by showing that there is a localization of NOS isoforms near or around the glomerulus early in the post natal period, supporting an important role for NO in influencing ultra-filtration during this critical time period. NOS isoforms decrease within the kidney as post natal maturation proceeds, providing evidence that the NO system—one of the most important intra-renal systems—is down regulated over a relatively short time span after birth, thus supporting a vital role for NO in the adaptation of the kidney to life after birth.
6. ACKNOWLEDGEMENTS
This research was supported by the Canadian Institutes for Health Research and the University Research Grants Committee of the University of Calgary. Portions of this work were presented as posters to Experimental Biology 2006 and 2009, and published in the proceedings (Smith, F.G., Hart, D., Qi, W., Reno, C. Age-dependent intrarenal expression of nitric oxide (NO) synthase isoforms in sheep FASEB J. 20: A1216-A1217, 2006; Davis, D.W., Qi, W., Smith, F.G. Spatial and temporal distribution of nitric oxide synthase (NOS) isoforms in the developing ovine kidney. FASEB J. 23: D560, 2009). Mr. Devin Davis was supported by grants from the Undergraduate Student Research Program in Health and Wellness, Summer Program (2007) and Fall/ Winter Program (2007-2008). The authors gratefully acknowledge Dr. Hallgrimur Benediktsson for his time and expertise in providing consultation and advice on kidney microstructure for the in situ hybridization studies. We also acknowledge Carol Reno for her technical assistance in the RT-PCR studies. Lastly, we would like to express our gratitude to Dr. John Matyas and his laboratory for generous access to their equipment.
REFERENCES
- Kone, B.C., Kuncewicz, T., Zhang, W. and Yu, Z.Y. (2003) Protein interactions with nitric oxide synthases: Controlling the right time, the right place, and the right amount of nitric oxide. American Journal of Physiology. Renal Physiology, 285, F178-F190.
- Sener, A. and Smith, F.G. (2001) Nitric oxide modulates the arterial baroreflex control of heart rate in conscious lambs in an age-dependent manner. American Journal of Physiology. Heart and Circulatory Physiology, 280, 2255- 2263.
- Sener, A. and Smith, F.G. (2001) Renal hemodynamic effects of L-NAME during postnatal maturation in conscious lambs. Pediatric Nephrology, 16, 868-873. doi:10.1007/s004670100672
- Sener, A. and Smith, F.G. (1999) Dose dependent effects of nitric oxide synthase inhibition on systemic and renal haemodynamics in conscious lambs. Canadian Journal of Physiology and Pharmacology, 77, 1-7. doi:10.1139/y99-009
- Sener, A. and Smith, F.G. (2002) Glomerular and tubular responses to NG-nitro-L-arginine methyl ester are age dependent in conscious lambs. American Journal of Physiology. Regulatory, Integrative and Comparative Physiology, 282, R1512-R1520.
- Solhaug, M.J., Dong, X.Q., Adelman, R.D. and Dong, K.W. (2000) Ontogeny of neuronal nitric oxide synthase, NOS I, in the developing porcine kidney. American Journal of Physiology. Regulatory, Integrative and Comparative Physiology, 278, R1453-R1459.
- Solhaug, M.J., Kullaprawithaya, U., Dong, X.Q. and Dong, K.-W. (2001) Expression of endothelial nitric oxide synthase in the postnatal developing porcine kidney. American Journal of Physiology. Regulatory, Integrative and Comparative Physiology, 280, R1269-R1275.
- Fischer, E., Schnermann, J., Briggs, J.P., Kriz, W., Ronco, P.M. and Bachmann, S. (1995) Ontogeny of NO synthase and renin in juxtaglomerular apparatus of rat kidneys. American Journal of Physiology, 268, F1164-F1176.
- Han, K.-H., Lim, J.-M., Kim, W.-Y., Kim, H., Madsen, K.M. and Kim, J. (2005) Expression of endothelial nitric oxide synthase in developing rat kidney. American Journal of Physiology. Renal Physiology, 288, F694-F702. doi:10.1152/ajprenal.00085.2004
- Reno, C., Marchuk, L., Sciore, P., Frank, C.B. and Hart, D.A. (1997) Rapid isolation of total RNA from small samples of hypocellular, dense connective tissues. BioTechniques, 22, 1082-1086.
- Le Graverand, M.-P.H., Eggerer, J., Sciore, P., Reno, C., Vignon, E., Otterness, I. and Hart, D.A. (2000) Matrix metalloproteinase-13 expression in rabbit knee joint connective tissues: Influence of maturation and response to injury. Matrix Biology, 19, 431-441. doi:10.1016/S0945-053X(00)00093-7
- Sciore, P., Frank, C.B. and Hart, D.A. (1998) Identification of sex hormone receptors in human and rabbit ligaments of the knee by reverse transcription-polymerase chain reaction: Evidence that receptors are present in tissue from both male and female subjects. Journal of Orthopaedic Research, 16, 604-610. doi:10.1002/jor.1100160513
- Marchuk, L., Sciore, P., Reno, C., Frank, C.B. and Hart, D.A. (1998) Postmortem stability of total RNA isolated from rabbit ligament, tendon and cartilage. Biochimica et Biophysica Acta (BBA)—General Subjects, 1379, 171- 177. doi:10.1016/S0304-4165(97)00094-9
- Berglund, M., Wiig, M., Torstensson, M., Reno, C. and Hart, D.A. (2004) Assessment of mRNA levels for matrix molecules and TGF-beta1 in rabbit flexor and peroneus tendons reveals regional differences in steady-state expression. Journal of Hand Surgery, 29, 165-169. doi:10.1016/j.jhsb.2003.09.005
- Forstermann, U., Closs, E.I., Pollock, J.S., Nakane, M., Schwarz, P., Gath, I. and Kleinert, H. (1994) Nitric oxide synthase isozymes. Characterization, purification, molecular cloning, and functions. Hypertension, 23, 1121-1131. doi:10.1161/01.HYP.23.6.1121
- Forstermann, U., Pollock, J.S., Tracey, W.R. and Nakane, M. (1994) Isoforms of nitric-oxide synthase: Purification and regulation. Methods in Enzymology, 233, 258-264. doi:10.1016/S0076-6879(94)33029-8
- Trifonov, S., Houtani, T., Hamada, S., Kase, M., Maruyama, M. and Sugimoto, T. (2009) In situ hybridization study of the distribution of choline acetyltransferase mRNA and its splice variants in the mouse brain and spinal cord. Neuroscience, 159, 344-357. doi:10.1016/j.neuroscience.2008.12.054
- Moningka, N.C., Sindler, A.L., Muller-Delp, J.M. and Baylis, C. (2011) Twelve weeks of treadmill exercise does not alter age-dependent chronic kidney disease in the Fisher 344 male rat. The Journal of Physiology, 589, 6129- 6138.
- Schwartz, D., Mendonca, M., Schwartz, I., Xia, Y., Satriano, J., Wilson, C.B. and Blantz, R.C. (1997) Inhibition of constitutive nitric oxide synthase (NOS) by nitric oxide generated by inducible NOS after lipopolysaccharide administration provokes renal dysfunction in rats. The Journal of Clinical Investigation, 100, 439-448. doi:10.1172/JCI119551
- Cattell, V. (2002) Nitric oxide and glomerulonephritis. Kidney International, 61, 816-821. doi:10.1046/j.1523-1755.2002.00226.x
- Blantz, R.C., Deng, A., Lortie, M., Munger, K., Vallon, V., Gabbai, F.B. and Thomson, S.C. (2002) The complex role of nitric oxide in the regulation of glomerular ultrafiltration. Kidney International, 61, 782-785. doi:10.1046/j.1523-1755.2002.00220.x
- Mount, P.F. and Power, D.A. (2006) Nitric oxide in the kidney: Functions and regulation of synthesis. Acta Physiologica, 187, 433-446. doi:10.1111/j.1748-1716.2006.01582.x
- Kone, B.C. (2004) Nitric oxide synthesis in the kidney: Isoforms, biosynthesis, and functions in health. Seminars in Nephrology, 24, 299-315. doi:10.1016/j.semnephrol.2004.04.002
- Kone, B.C. (1999) Localization and regulation of nitric oxide synthase isoforms in the kidney. Seminars in Nephrology, 19, 230-241.
- Wu, F., Park, F., Cowley Jr., A.W. and Mattson, D.L. (1999) Quantification of nitric oxide synthase activity in microdissected segments of the rat kidney. American Journal of Physiology, 276, F874-F881.
- Mattson, D.L. and Wu, F. (2000) Nitric oxide synthase activity and isoforms in rat renal vasculature. Hypertension, 35, 337-341. doi:10.1161/01.HYP.35.1.337
- Sullivan, J.C., Pardieck, J.L., Hyndman, K.A. and Pollock, J.S. (2010) Renal NOS activity, expression, and localization in male and female spontaneously hypertensive rats. American Journal of Physiology. Regulatory, Integrative and Comparative Physiology, 298, R61-R69. doi:10.1152/ajpregu.00526.2009
- Bachmann, S., Bosse, H.M. and Mundel, P. (1995) Topography of nitric oxide synthesis by localizing constitutive NO synthases in mammalian kidney. American Journal of Physiology, 268, F885-F898.
- Mattson, D.L. and Bellehumeur, T.G. (1996) Neural nitric oxide synthase in the renal medulla and blood pressure regulation. Hypertension, 28, 297-303. doi:10.1161/01.HYP.28.2.297
- Liu, L., Liu, G.L. and Barajas, L. (1996) Distribution of nitric oxide synthase-containing ganglionic neuronal somata and postganglionic fibers in the rat kidney. Journal of Comparative Neurology, 369, 16-30. doi:10.1002/(SICI)1096-9861(19960520)369:1<16::AID-CNE2>3.0.CO;2-N
- Wilcox, C.S. (1998) Role of macula densa NOS in tubuloglomerular feedback. Current Opinion in Nephrology and Hypertension, 7, 443-449. doi:10.1097/00041552-199807000-00016
- Garvin, J.L. and Hong, N.J. (1999) Nitric oxide inhibits sodium-hydrogen exchange activity in the thick ascending limb. American Journal of Physiology, 277, F377- F382.
- Stoos, B.A., Garcia, N.H. and Garvin, J.L. (1995) Nitric oxide inhibits sodium reabsorption in the isolated perfused cortical collecting duct. Journal of the American Society of Nephrology, 6, 89-94.
- Adler, S., Huang, H., Loke, K.E., Xu, X., Tada, H., Laumas, A. and Hintze, T.H. (2001) Endothelial nitric oxide synthase plays an essential role in regulation of renal oxygen consumption by NO. American Journal of Physiology—Renal Physiology, 280, F838-F843.
- Plato, C.F., Stoos, B.A., Wang, D. and Garvin, J.L. (1999) Endogenous nitric oxide inhibits chloride transport in the thick ascending limb. American Journal of Physiology, 276, F159-F163.
- Holmqvist, B., Olsson, C.F., Svensson, M.L., Svanborg, C., Forsell, J. and Alm, P. (2005) Expression of nitric oxide synthase isoforms in the mouse kidney: Cellular localization and influence by lipopolysaccharide and tolllike receptor 4. Journal of Molecular Histology, 36, 499- 516. doi:10.1007/s10735-006-9028-7
- Ahn, K.Y., Mohaupt, M.G., Madsen, K.M. and Kone, B.C. (1994) In situ hybridization localization of mRNA encoding inducible nitric oxide synthase in rat kidney. American Journal of Physiology, 267, F748-F757.
- Morrissey, J.J., McCracken, R., Kaneto, H., Vehaskari, M., Montani, D. and Klahr, S. (1994) Location of an inducible nitric oxide synthase mRNA in the normal kidney. Kidney International, 45, 998-1005. doi:10.1038/ki.1994.135
- Munger, K.A., Blantz, R.C. and Lortie, M.J. (2006) Acute renal response to LPS: impaired arginine production and inducible nitric oxide synthase activity. American Journal of Physiology. Regulatory, Integrative and Comparative Physiology, 291, R684-R691. doi:10.1152/ajpregu.00873.2005
- Parker, T.A., Le Cras, T.D., Kinsella, J.P. and Abman, S.H. (2000) Developmental changes in endothelial nitric oxide synthase expression and activity in ovine fetal lung. American Journal of Physiology—Lung Cellular and Molecular Physiology, 278, L202-L208.
- Monau, T.R., Vargas, V.E., King, N., Yellon, S.M., Myers, D.A. and Ducsay, C.A. (2009) Long-term hypoxia increases endothelial nitric oxide synthase expression in the ovine fetal adrenal. Reproduction Science, 16, 865-874. doi:10.1177/1933719109336678
- Khan, H., Kusakabe, K.T., Wakitani, S., Hiyama, M., Takeshita, A. and Kiso, Y. (2011) Expression and localization of NO synthase isoenzymes (iNOS and eNOS) in development of the rabbit placenta. Journal of Reproduction and Development, 58, 231-236.
- Sener, A. and Smith, F.G. (1999) Acetylcholine chloride and renal haemodynamics during postnatal maturation in conscious lambs. Journal of Applied Physiology, 87, 1296- 1300.
- Smith, F.G., van der Velde, L. and Sener, A. (2005) Nitric oxide modulates renal vasoconstrictor effect of endothelin-1 in conscious lambs. Pediatric Nephrology, 20, 1545-1551. doi:10.1007/s00467-005-2015-5