Open Journal of Inorganic Chemistry
Vol.1 No.3(2011), Article ID:8155,7 pages DOI:10.4236/ojic.2011.13007
Crystal structure, thermal analysis and IR spectroscopic investigation of bis (N-methyl anilinium) sulfate
![]()
Laboratoire de Chimie du Solide, Faculté des Sciences de Monastir, Monastir, Tunisie.
Email: taha_guerfel@yahoo.fr
Received 10 August 2011; revised 20 September 2011; accepted 10 October 2011.
Keywords: Chemical Preparation; Crystal Structure; Thermal Behavior; Organic Sulfate; Infrared Spectroscopy
ABSTRACT
Chemical preparation, X-ray single crystal, thermal analysis and IR spectroscopic investigation of (C7H10 N)2·SO4 denoted NMAS are described. The NMAS crystallizes in the triclinic system with P-1 space group. Its unit cell dimensions are a = 9.6150(5) Å, b = 9.9744(3) Å, c = 10.2767(6) Å, α = 68.069(3), β = 62.929(2), γ = 67.285(3) with V = 785.72(7) Å3 and Z = 2. The structure has been solved using direct method and refined to a reliability R factor of 3.62%. The NMAS structure is built up from chains containing all the components of the structure and parallel to the b axis, linked via N—H…O hydrogen bonds. Stability between successive chains is performed by weak interactions originating from the organic cations.
1. INTRODUCTION
Studies of charged species (cations and anions) have become an active research area in organic chemistry and biology [1-3]. Their role as structural agents is important in molecular association processes and in mediating the tertiary structures of proteins and nucleic acids [4]. The family of compounds which combine the cohesion of sulfate anions with enhanced polarizability of organic molecules was clearly illustrated. The most striking result is the high number of hydrogen bonds to the sulfate, which results in the sulfate being surrounded by a cloud of hydrogen donors [5]. The title compound (NMAS) is an additional example for illustrating the templating effect of aromatic ammonium molecules on sulfate. Besides structural considerations resulting from crystallographic studies, some organic sulfates exhibit non-linear optical properties [6], or phase transitions [7,8]. The present work continues a series of investigations into the factors influencing the dimensions of sulfate anion–organic cation interaction. We report here the chemical preparation, crystallographic features, thermal behavior, and IR analysis of a new organic sulfate, (C7H10N)2·SO4.
2. EXPERIMENT
2.1. Chemical Preparation
Crystals of NMAS were prepared by slow evaporation at room temperature of 400 mL of an aqueous solution of H2SO4 (10–1 M), neutralized by 0.08 mol of N-methyl aniline (molar ratio 2/1). During this operation the solution was stirred vigorously. Schematically the reaction is:
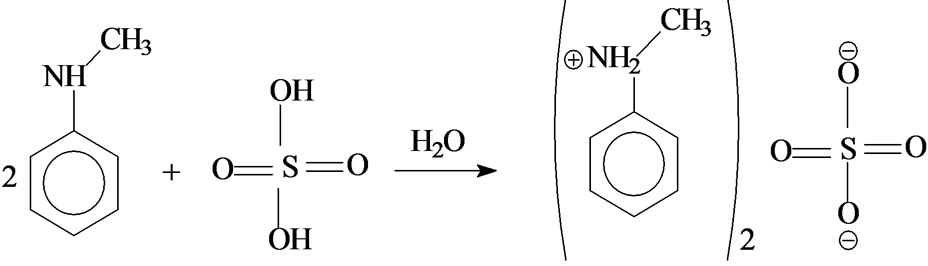
When the most of solution is evaporated, large colorless and prismatic crystals appear deep down the vessel.
2.2. Investigation
The title compound has been studied by various physicochemical methods: X-ray diffraction, Infrared spectroscopy and Thermal analysis.
2.2.1. SEM Elemental Analysis
The sample used in performing the Scanning Electron Microscope (SEM) analysis was cut up into a small piece of about 0.5 cm by 0.5 cm. It was then loaded unto a sample holder and loaded into the SEM.
2.2.2. Thermal Analysis
Setaram thermoanalyser, TG-DTA92, was used to perform thermal treatment on samples of the LTHS. TGDTA thermograms were obtained with 19.47 mg sample in an open platinium crucible, heated in air with 3˚C min–1 heating rate, from room temperature to 250˚C, an empty crucible was used as reference.
2.2.3. Infrared Spectroscopy
IR spectrum was recorded at room temperature with a Biored FTS 6000 FTIR spectrometer over the wavenumber 4000-400 cm–1 with a resolution of about 4 cm–1. Thin, trans-parent pellet was made by compacting an intimate mixture obtained by shaking 2 mg of the sample in 100 mg of KBr.
2.2.4. X-Ray Diffraction
X-ray intensity data were collected on a Nonius KappaCCD diffractometer using monochromated Ka (Mo) radiation with a specimen-to-image plate distance of 2.7 cm. For the crystal, 90 frames were recorded, each being of 2 in j and 120 s duration. The first ten frames were used for indexing reflections using the DENZO package and refined to obtain final cell parameters. A total of 2538 reflections had their intensities integrated and scaled, finally yielding 2421 independent reflection intensities
[9]. Preliminary photographs indicated triclinic symmetry. The crystal structure carried out with a direct method from the SHELXS-97 [10], permitted to locate the SO4 group and the other non-hydrogen atoms. The hydrogen atoms were rapidly located after subsequent cycles of refinement and difference Fourier synthesis using the program SHELXL-97 [10]. In the final leastsquares refinement of atomic parameters with isotropic thermal factors of the H atoms, R decreased to 3.62% (Rw = 9.08%). The average density, Dm = 1.308 g·cm–3, measured at room temperature using toluene as pycnometric liquid, is in agreement with the calculated Dc = 1.320 g·cm–3. The set of physical and crystallographic characteristics as well as the experimental conditions are listed in Table 1.

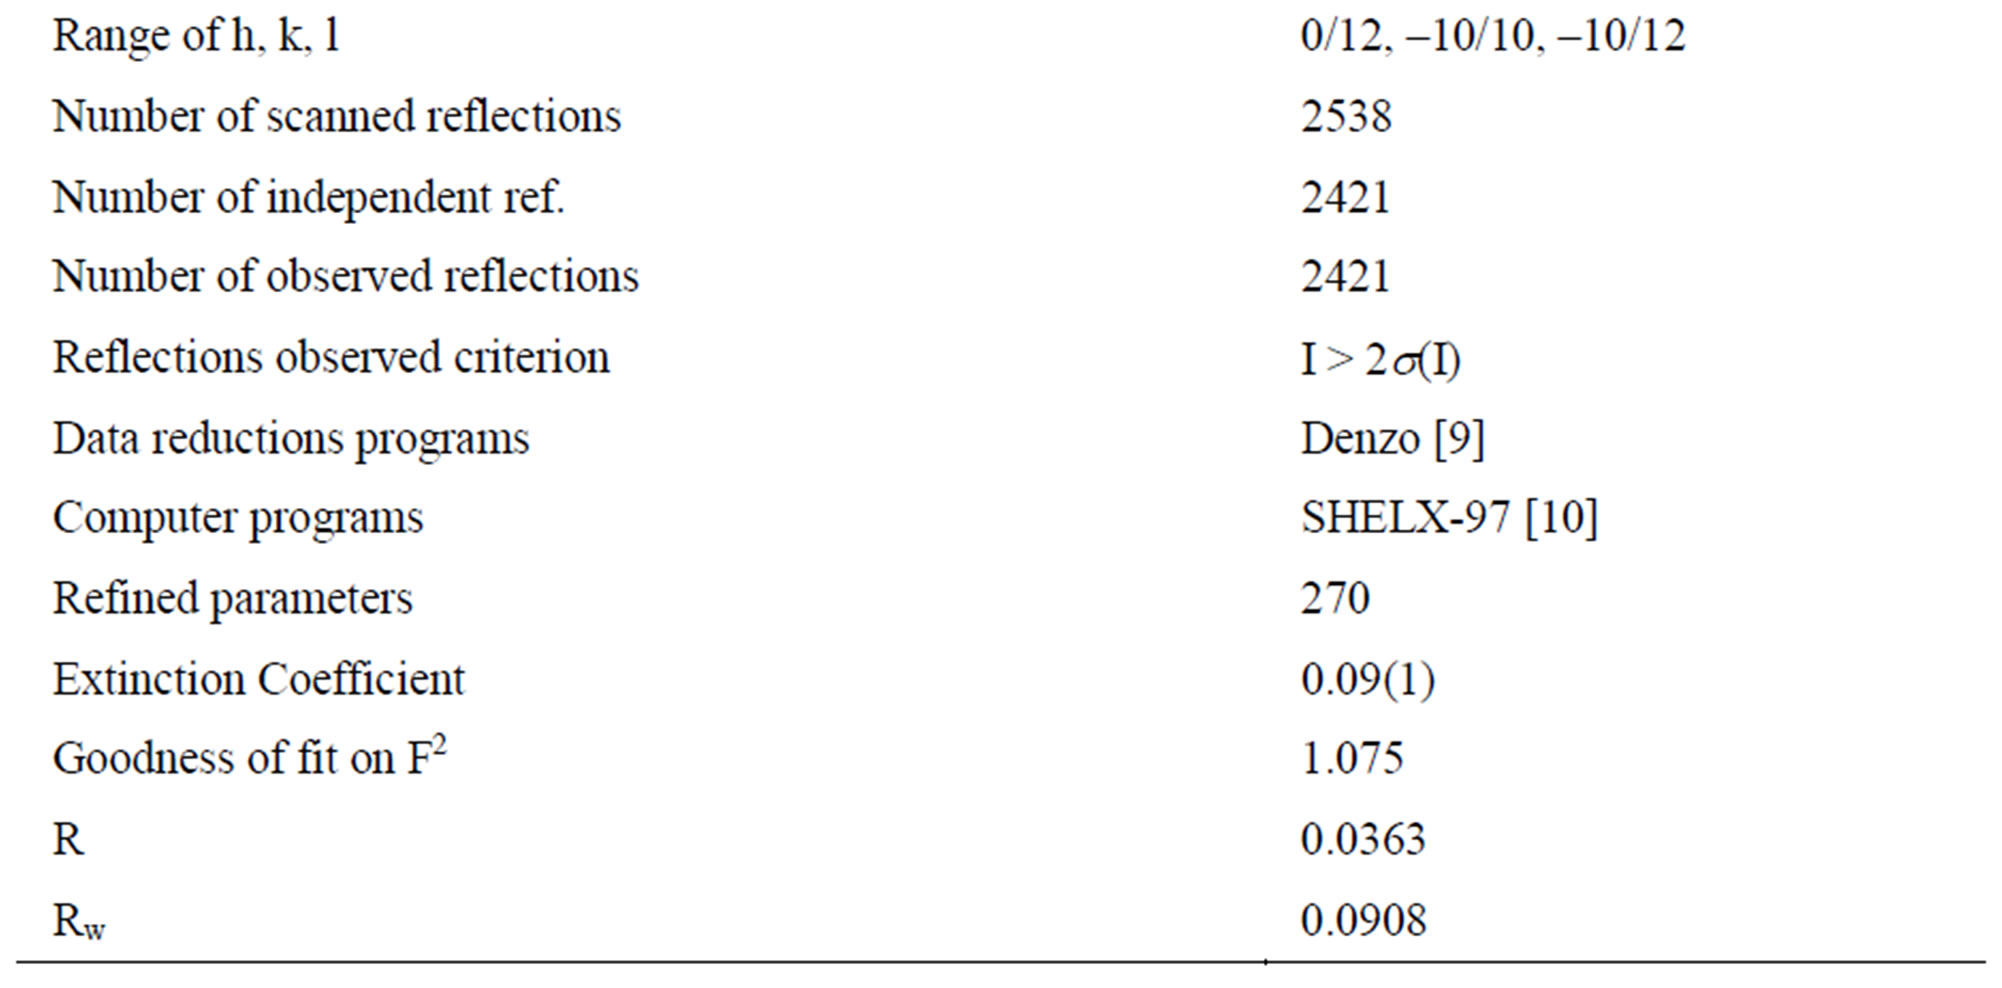
Table 1. Crystal data and structure refinement.
3. RESULTS AND DISCUSSION
3.1. SEM Elemental Analysis
This test was performed in order to quantify the elements that existed in our sample. By know this information; we would have a better idea of the elements contained in our new compound. Below is an image of the spectrum obtained from the SEM elemental analysis.

3.2. Thermal Behavior
From the TG-DTA thermograms (Figure 1), we deduce that the anhydrous compound decomposes in the range 120˚C - 250˚C, with evolution of ammonia [11]. Within this temperature range, a rather bad smell escapes from the resulting black compound. The DTA curve shows an two endothermic peaks at 148˚C and 153˚C. These peaks may be ascribed to the melting. The melting of the compound is confirmed by an additional thermal treatment in a separate carbolite furnace with run heating of 3˚C /min from room temperature to 150˚C, the resulting compound being a white liquid.
3.3. IR Absorption Spectroscopy
A free SO42– ion under Td symmetry has four fundamental vibrations, the nondegenerate symmetric stretching mode n1(A1), the doubly degenerate bending mode n2(E), the triply asymmetric stretching mode n3(F2), and the triply degenerate asymmetric bending mode n4(F2). All the modes are Raman active, whereas only n3 and n4 are active in the IR. The average frequencies [12], respecttively observed for these modes are: 981, 451, 1104 and 614 cm–1. In the crystal, the SO42– ion occupies a lower site symmetry C1, as a result the IR inactive n1 and n2 modes may become active and the degeneracies of n2, n3 and n4 modes may be removed. The degenerate n2 mode of the ion is found to be split into two components around 423 and 446 cm–1. Appearance of this IR inactive mode can be due to the symmetry lowering of the sulfate ion from Td to C1. The n3 mode appears as one very strong band at 1117 with two shoulders at 1005 and 1177 cm–1.

Figure 1. TG-DTA thermograms.
The n4 mode is observed as two bands at 584 and 620 cm–1 and one shoulder 693 cm–1.
The non-degenerate stretching mode n1 appears as one band at 988 cm–1. The higher frequency value obtained for the n1 mode than those in a free SO42– ion also confirms the distortion of SO4 tetrahedron as is evident from different S-O bond lengths determined by the X-ray diffraction study. Distortion of the SO42– ion and the fact that there are two molecular units in the Bravais cell leads to a splitting of the n1 mode and additional splitting, apart from the lifting of degeneracies of the n2, n3, and n4 modes. X-ray data show that H atoms of the NH2 groups generate hydrogen bonds with the oxygen atoms of the SO4 group. The presence of these hydrogen bonds may be the reason for the observed distortion in the SO4 tetrahedron in NMAS.
The remaining observed bands in the spectrum can be assigned to CH3, CH, NH2+, and skeletal symmetric and asymmetric stretching and deformation modes [13]. The domain of high frequencies in the spectrum is characterized by N(C)-H stretching, combination bands and harmonics, while the lower one corresponds to the bending and to the external modes. The IR spectrum of NMAS is depicted in Figure 2. A broad band extending from 3395 to 2609 cm–1 is observed in the IR spectrum. This broad band must be due to the symmetric and asymmetric stretching modes of NH2, CH3 and CH·NH2 bending, rocking and torsion may occur in the ranges 1659 - 1560, 952 - 725 and 554 - 520 cm–1. The shifting of the stretching and bending vibrations of the NH2 group from the free state value confirms the formation of hydrogen bonds of varying strengths in the crystal. Skeletal vibrations may occur in the ranges 1659 - 1560 and 952 - 725 cm–1. Frequencies in the range 1469 - 1305 cm–1 are attributed to ds(CH3), das(CH3), ds(CH) and das(CH).
3.4. Structure Description
The structure of this new phase shows that its framework
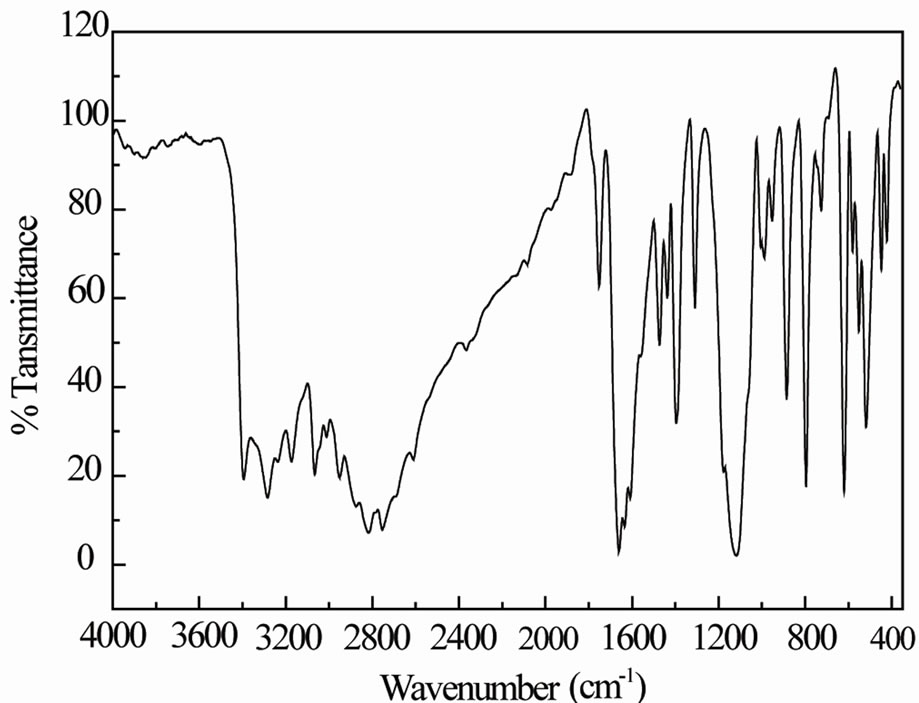
Figure 2. IR spectrum of polycrystalline NMAS.
consists of infinite chains parallel to the b and containing all the components of the atomic arrangement (Figure 3). The S-O distances range from 1.448(1) to 1.490(1) Å with an average of 1.471 Å.
Slight differences in the S-O bond lengths together with the slight deformation of the anions indicate a different manner of connection of the oxygen atoms in the hydrogen bond system in the NMAS crystal structure. The high sensitivity of the S-O bond distances to the strength and the number of the hydrogen bonds which may be formed, has been also noted in other crystal structures [14-16]. O(4), which do not participate in hydrogen bonds , has the shortest S-O distance of 1.448(1) Å. O(1) and O(2), with S-O bond distances of 1.472(1) and 1.473(2) Å, respectively, participates in one hydrogen bonds. Consequently, it is possible to use differences in bond lengths to identify which O in the N(O)-HLO bonds is more highly associated. The main geometric features of the sulfate anion and of the hydrogen bonds are assigned in Tables 2 and 3.
The SO42– groups exhibit a compact assembly of oxygen atoms in which the sulfur atom shows a slightly displacement from the center of gravity of the tetrahedron. The calculated average values of the distortion indices [17], corresponding to the different angles and distances in the SO4 tetrahedron [DI(OSO) = 0.001, DI(SO) = 0.008, DI(OO) = 0.0025] exhibit a pronounced distortion of the SO distances if compared to OSO angles and OO distances.
Figure 4 shows an ORTEP [18] stereoscopic projecttion of the crystal packing. The obtained thermal ellipsoids show the S atom to exhibit rather isotropic thermal displacement and the oxygen atoms to undergo the greatest thermal displacements in a direction perpendicular to the S-O bond, as would be expected in such a compound [19]. Each sulfate anion is surrounded by four hydrogen bonds: four from four NH2 groups (see Figure 4). Each anion is bridged to four cations with NLO distances ranging from 2.726(2) to 2.802(2) Å. The hydrogen bonds [N-HLO] range from 1.84(2) to 1.95(3) Å in length (HLO) with N-HLO angles from 168(2) to 173(2) (see Table 3). The structure contains four potential hydrogen-bond donors [four N atoms] and four potential hydrogen-bond acceptors [O atoms of the SO4 group].
In this atomic arrangement, the two crystallographic independent organic cations have no internal symmetry. The interatomic bond lengths and angles spread within the respective ranges: 1.366(4) - 1.484(3) Å and 113.31(15)˚ - 121.47(18). The mean length of the C-C bonds: 1.377 Å is lower than the one of C-N bonds:1.470 Å. The bond angles in the phenyl groups deviate significantly from the idealized value of 120˚. This is the effect of the substituent. Domenicano and Murray-Rust have [20], among others, shown that the angular deformations of phenyl groups can be described as a sum of the effects of the different substituents. The benzenes rings are planar with a maximum deviation of 0.008(2) for (C1C2C3C4C5C6)
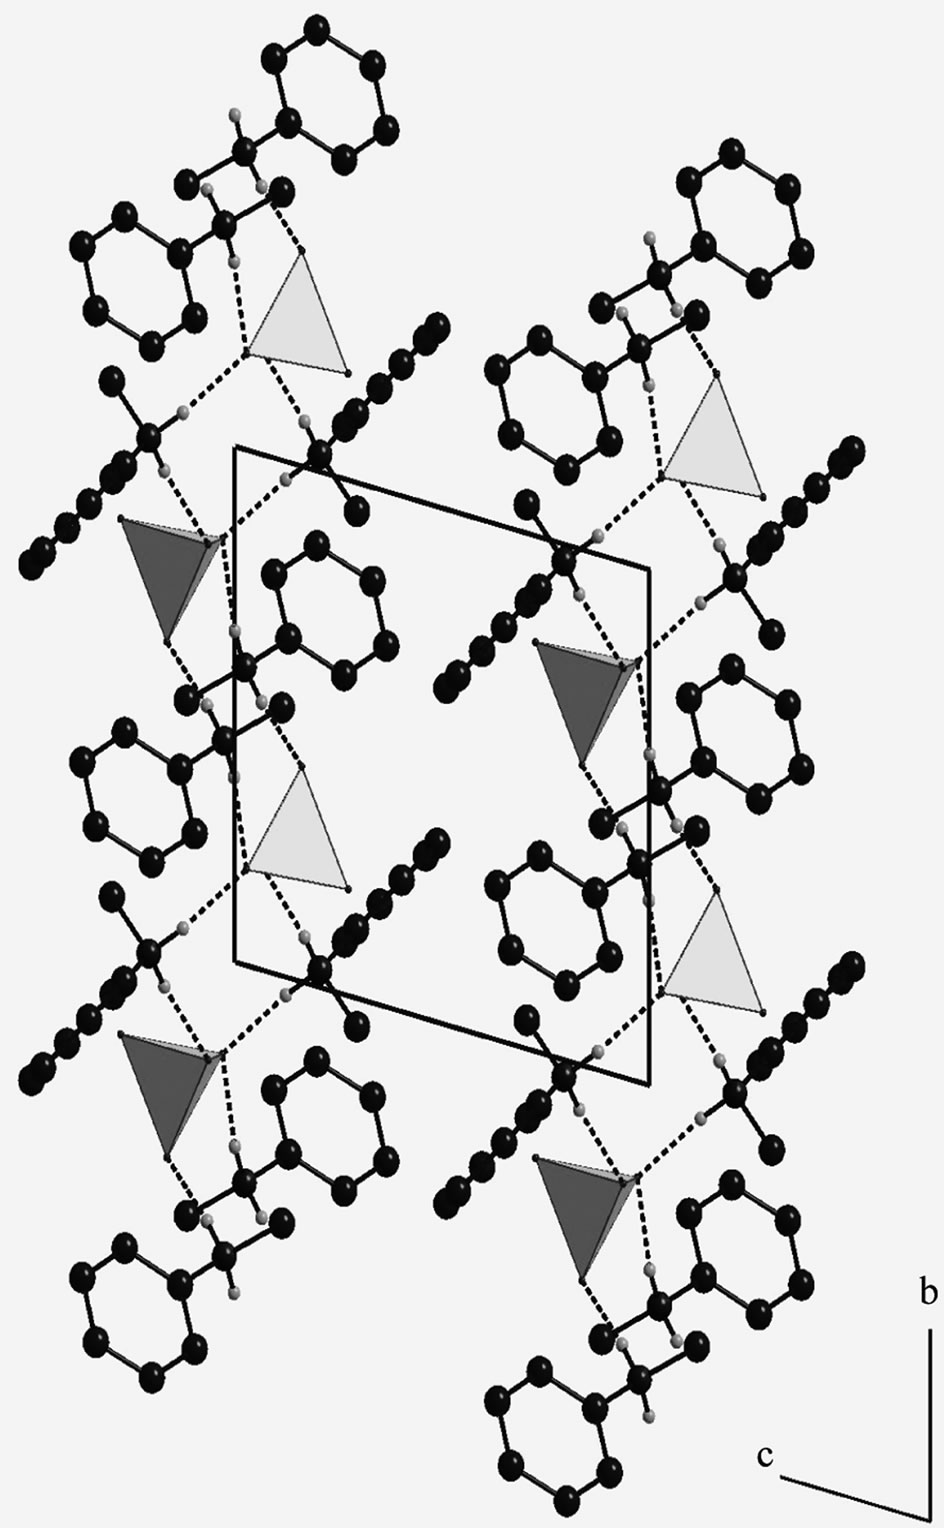
Figure 3. Projection along the a axis of the atomic arrangement of NMAS. (For clarity, the H atoms of Carbon are omitted; H-bonds are represented by dashed lines).
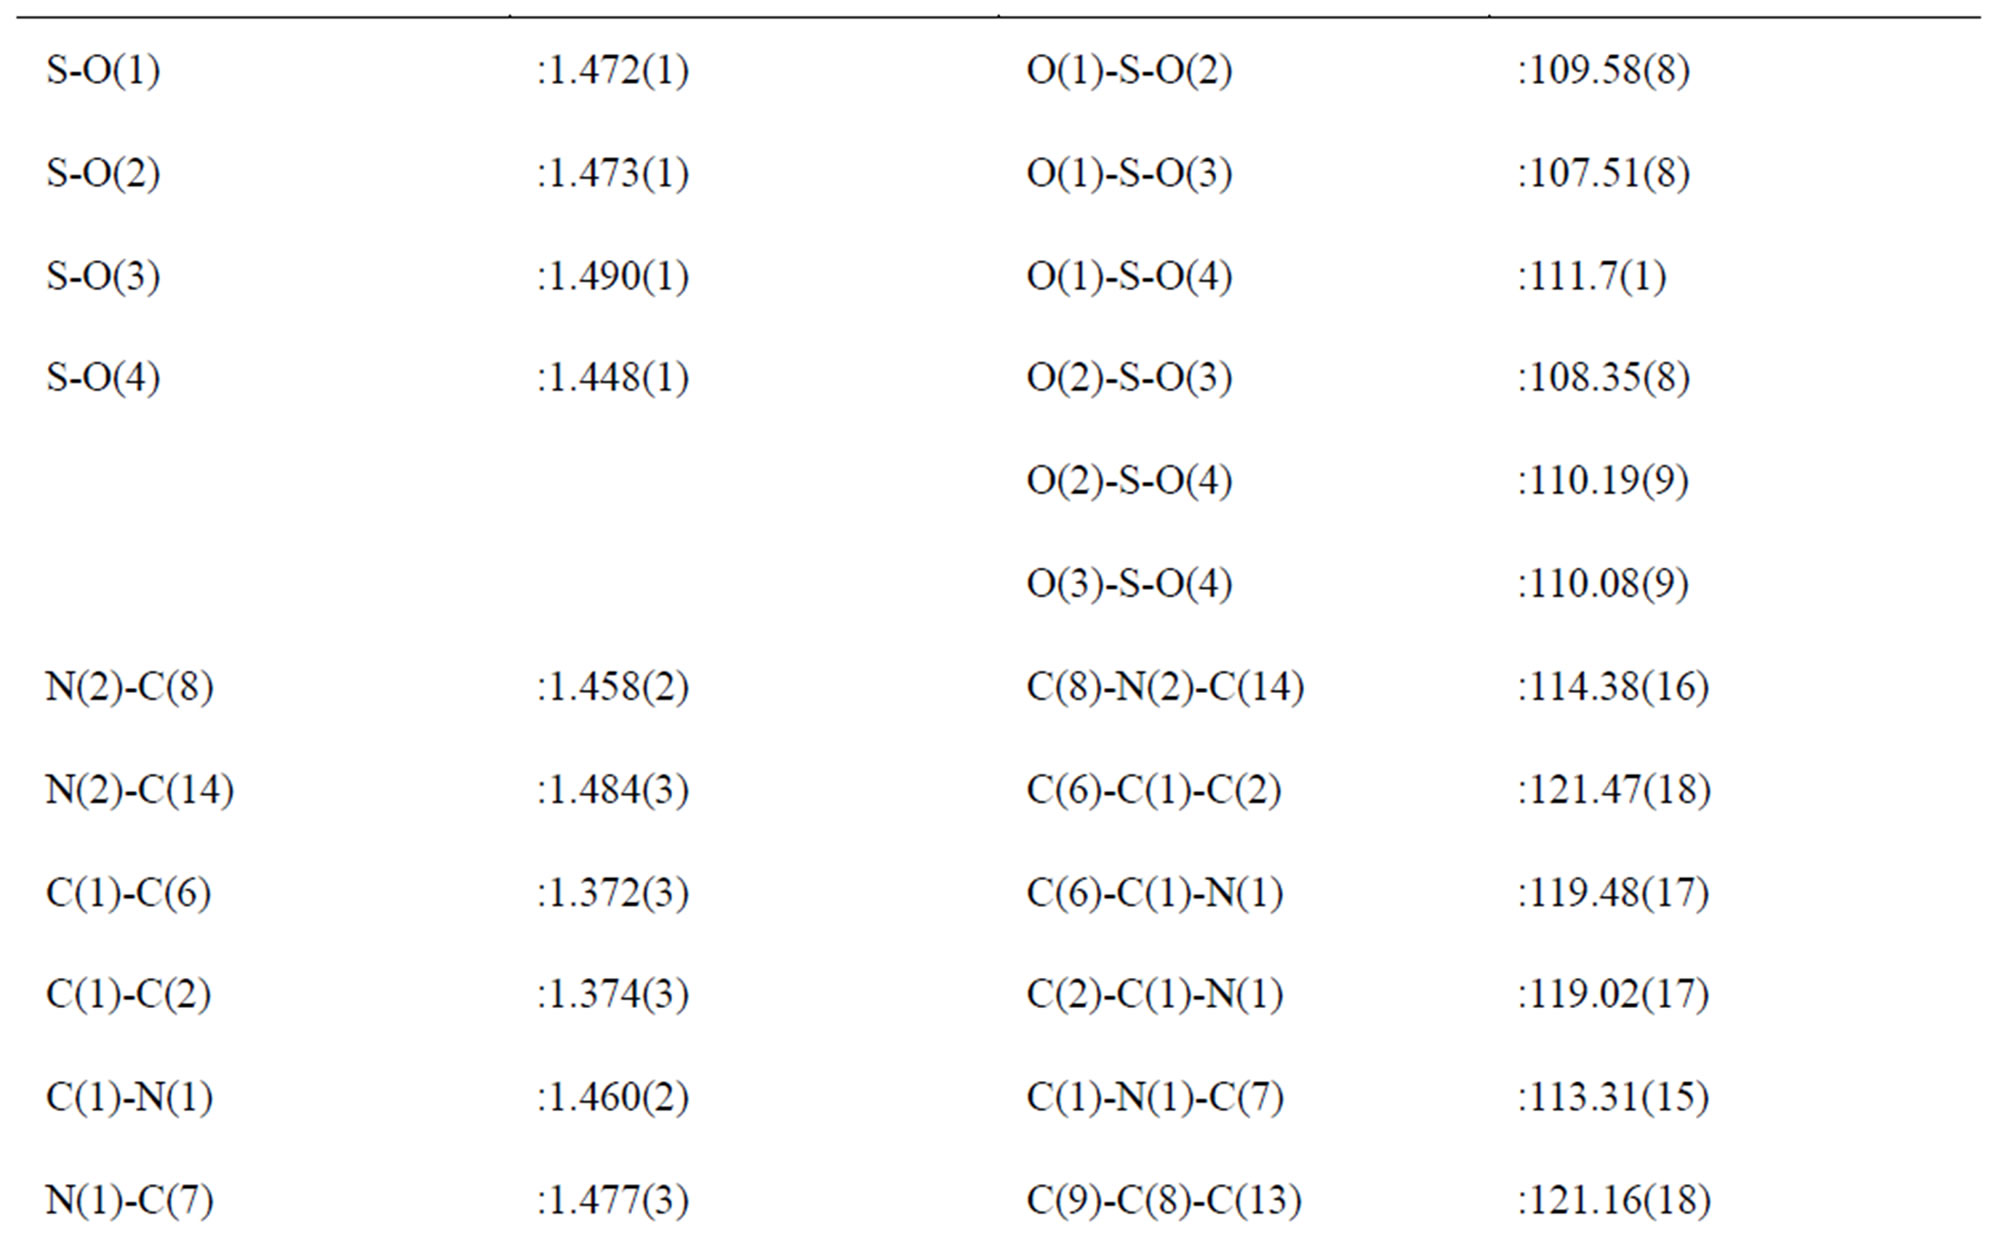

Table 2. Main interatomic distances (Å) and bond angles (˚) in the NMAS.

Table 3. Bond lengths (Å) and angles (˚) in the Hydrogen-bonding schemea.
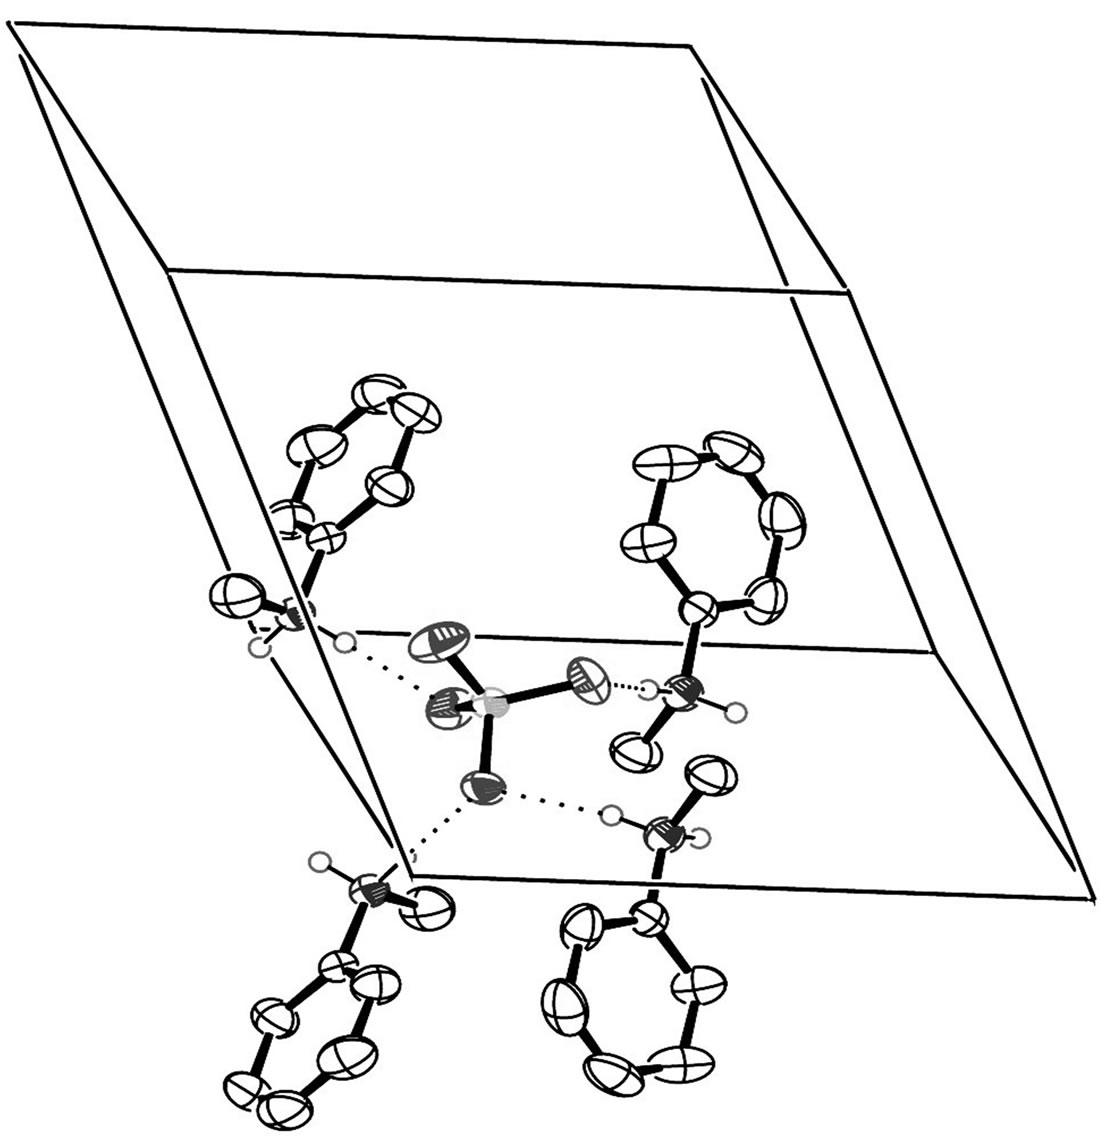
Figure 4. ORTEP stereoscopic projection of the atomic arrangement (For clarity, the H atoms of Carbon are omitted; H-bonds are represented by dashed lines). Thermal ellipsoids are given at 50% probability.
and 0.009(2) for (C8C9C10C11C12C13). The interplanar angle between the two benzene rings of the formula unit is 82.70(7). The torsion angles of: C7-N1-C1-C6 and C14-N2-C8-C13, are respectively: –68.9(3) and 71.2(3), indicating that the groups: N1-C7 and N2-C14, are not in the same planes of their benzene rings.
3.5. Supplementary Material
Crystallographic data (excluding structure factors) for the structure reported in this paper have been deposited with the Cambridge Crystallographic Data Centre as supplementary publication no. CCDC 838574. Copies of the data can be obtained, free of charge, on application to CCDC, 12 Union Road, Cambridge CB2 1EZ, UK, (fax: +441,223,336,033 or e-mail: deposit@ccdc.cam.ac.uk).
REFERENCES
- Bazinet, L., Pouliot, Y. and Castaigne, F. (2010) Relative contributions of charged species to conductivity changes in skim milk during electrochemical acidification. Journal of Membrane Science, 352, 32-40. doi:10.1016/j.memsci.2010.01.056
- Tang, B., Xu, T. and Yang, W. (2006) A novel positively charged asymmetry membranes from poly (2,6-dimethyl- 1,4-phenylene oxide) by benzyl bromination and in situ amination: Part II: Effect of charged group species on membrane performance and morphologies. Journal of Membrane Science, 268, 123-131. doi:10.1016/j.memsci.2005.05.029
- Kuhn, M.C.A., Lapis, A.A.M., Machado, G., Roisnel, T., Carpentier, J.-F., Neto, B.A.D. and Casagrande, O.L. (2011) Nickel-containing di-charged imidazolium ligand with high crystalline organization. Interception and characterization of a transient carbene/cation species. Inorganica Chimica Acta, 370, 505-512. doi:10.1016/j.ica.2011.02.060
- Liu, C. and Zhang, Y. (2011) Nucleic acid-mediated protein aggregation and assembly. Advances in Protein Chemistry and Structural Biology, 84, 1-40.
- Huang, X., Yang, Z., Yang, X.-J., Zhao, Q., Xia, Y. and Wu, B. (2010) Sulfate binding in zinc(II) complexes of a monopyridylurea ligand N-(1-naphthyl)-N’-(3-pyridyl)urea. Inorganic Chemistry Communications, 13, 1103-1107. doi:10.1016/j.inoche.2010.06.037
- Krishnakumar, V., Ramachandraraja, C. and Sundararajan, R.S. (2007) Crystal growth and vibrational spectroscopic studies of the semiorganic non-linear optical crystal—bisthiourea magnesium sulphate. Spectrochimica Acta Part A: Molecular and Biomolecular Spectroscopy, 68, 113- 116. doi:10.1016/j.saa.2006.09.045
- Czapla, Z., Komar, J., Marciniszyn, T. and Poprawski, R. (2011) Phase transition and anisotropic conductivity in guanidine zinc sulfate crystals. Solid State Ionics, 196, 25-29. doi:10.1016/j.ssi.2011.05.021
- Choudhury, R.R., Chitra, R. and Ramanadham, M. (2005) Effect of isotope substitution and pressure on the phase transition in triglycine sulphate. Physica B: Condensed Matter, 366, 116-121.
- Otwinowski, Z. and Minor, W. (1997) In methods in enzymology. Academic Press, New York.
- Sheldrick, G.M. (1997) SHELX-97, University of Göttingen, Germany.
- Baouab, L. and Jouini, A. (1998) Crystal structures and thermal behavior of two new organic monophosphates. Journal of Solid State Chemistry, 141, 343-351. doi:10.1006/jssc.1998.7933
- Hertzberg, G. (1966) Infrared and Raman spectra of polyatomic molecules. Van Nostrand, New York.
- Nakamoto, K. (1986) IR and Ra spectra of Inorg. and Coord. Comp. Wiley-Interscience, New York.
- Guerfel, T. and Jouini, A. (2000) Crystal structure and thermal analysis of 1,5-diammonium-2-methyl pentane sulfate monohydrate. Journal of Chemical Crystallography, 30, 95-98. doi:10.1023/A:1009561411167
- Capasso, S., Mattia, C.A., Mazzarella, L. and Zagari, A. (1983) L-Lysine sulphate, C6H16N2O22+·SO42–: A novel conformation of the L-lysine side chain. Acta Crystallographica, C39, 281-283. doi:10.1107/S0108270183004400
- Haile, S.M., Calkins, P.M. and Boysen, D. (1998) Structure and vibrational spectrum of β-Cs3(HSO4)2[H2−x(P1−x, Sx)O4] (x∼0.5), a new superprotonic conductor, and a comparison with α-Cs3(HSO4)2(H2PO4). Journal of Solid State Chemistry, 139, 373-387. doi:10.1006/jssc.1998.7861
- Baur, W.H. (1974) The geometry of polyhedral distortions. Predictive relationships for the phosphate group. Acta Crystallographica, B30, 1195-1215. doi:10.1107/S0567740874004560
- Farrugia, L.J. (1997) ORTEP-3 for Windows—A version of ORTEP-III with a graphical user interface (GUI). Journal of Applied Crystallography, 30, 565-568. doi:10.1107/S0021889897003117
- Haile, S.M., Kreuer, K.-D and Maier, J. (1995) Structure of Cs3(HSO4)2(H2PO4)—A new compound with a superprotonic phase transition. Acta Crystallographica, B51, 680-687. doi:10.1107/S0108768195005684
- Domenicano, A. and Murray-Rust, P. (1979) Geometrical substituent parameters for benzene derivatives: Inductive and resonance effects. Tetrahedron Letters, 24, 2283-2286. doi:10.1016/S0040-4039(01)93699-8