Optics and Photonics Journal
Vol.4 No.1(2014), Article ID:42232,7 pages DOI:10.4236/opj.2014.41003
Small-Force Measurement by Photo-Elastic Transducer
Laboratoire Commun de Métrologie, Paris, France
Email: naceur.khelifa@cnam.fr
Received September 24, 2013; revised October 23, 2013; accepted November 21, 2013
ABSTRACT
The use of stress-induced changes in a crystal of a monolithic solid-state laser by external force as a way for micro-force detection and measurement is described. In fact, the application of an unknown force on the resonator-amplifier crystal of a solid-state laser leads to a measurable change in the frequency of the beat note associated with the orthogonal polarisation components of the oscillating laser mode. Here we report our first measurements of the sensitivity of a photo-elastic force sensor, realised with a monolithic (4 × 4) mm plano-convex cylindrical crystal, and compare them with the results obtained by other authors for different configurations and dimensions of the laser sensor. The reported results are in a good mutual agreement but show notable discrepancies with theoretical predictions, especially for high sensitivities obtained when the dimensions of the laser sensor are small.
Keywords:Induced Birefringence; Photo-Elastic Effect; Solid-State Laser; Small Force Sensor; Sensor Sensitivity
1. Introduction
The smallest mass standard commonly used in mass metrology is 1 mg (approximately equivalent to a gravitational force of 10 µN). Recent advances in nanotechnology have created new opportunities for masses smaller than this. Recently, the French laboratory LNE/Cnam has produced a new series of mass standards and extended the possibility for mass calibration ranging from 100 µg to 900 µg [1]. In practice, low-force measurements based on deadweights can be extended to about 5 µN (approximately 0.5 mg). This limit is due to the small size of the mass standards and their geometrical forms that make them difficult to handle and stack. Generally, the environmental conditions and the difficulties in handling and positioning a micro-masse can lead to significant fluctuations in observed values and large uncertainties on the results of measurement. It would be interesting to have a force balance, having linear response, which can be traceable to mass standard, even in a small interval. In mass metrology, the most sensitive transducers have a limited range of linearity and can only be used to measure small differences among artifacts of nearly equal mass. Thus, the design of a transfer apparatus which can be used to link measurements obtained with different instruments would be welcome. The current situation requires that multiple devices should be developed and addressed to achieve quantitative and reliable measurement results. Now, the measurement of forces is an indirect process because it is carried out in two steps. This means that it requires first, the detection and evaluation of the induced effect in the sensitive element by the applied force, and second, the determination of the intensity of the force. The NIST’s electrostatic force, operated in a vacuum, was the major example of a traceable low force balance in the range of 1 mN to 10 nN [2]. Today, the consensus among many groups is to develop standards (apparatus, procedures, reference materials, ···) for force and displacement with the aim of achieving reliable and quantitative measurement results in the range of 1 N - 100 µN. In this perspective, we are working on the characterization and validation of a force transducer which converts force into frequency by photoelastic effect in a solid-state laser.
2. Background
A photo-elastic force sensor is a solid-state laser in which the effect of the force is an induced birefringence. This kind of sensor was introduced first by Holzapfel et al. [3,4]. In fact, a birefringent crystal is an optical support which has the property to resolve the field associated with a light wave into two orthogonal components, relative to direction of propagation, and to transmit them with different speeds. A transparent and optically isotropic material under normal conditions, such as a crystal, can become birefringent when subjected to a constraint. The phenomenon, known as the photo-elastic effect, appears and disappears almost instantaneously with the application of the force onto the crystal.
In the case of a cylindrical crystal, in a compression with respect to a diametrical plane, there are two principal constraints associated with the two directions of principal stress. In the last century, Maxwell determined the relations between the principal indexes of refraction (birefringence) and the principal constraints [5,6]. In a plane state of stresses, the principal directions of the ellipsoid of index coincide with the principal stress directions, these relations reduce to:
 (1)
(1)
Where ![]() and
and ![]() are respectively the ordinary and extraordinary refractive index of the laser crystal associated to its principal axis x and y as indicated in Figure 1.
are respectively the ordinary and extraordinary refractive index of the laser crystal associated to its principal axis x and y as indicated in Figure 1.
![]() represents the index of refraction of the unconstrained crystal at
represents the index of refraction of the unconstrained crystal at![]() ,
,  and
and ![]() are the principal constraint
are the principal constraint ![]() and
and ![]() are the coefficients of optical elasticity of the crystal. For Nd:YAG at
are the coefficients of optical elasticity of the crystal. For Nd:YAG at ,
, 
In the presence of constraint , the induced birefringence is given by the stress-optical law derived from relation (1):
 (2)
(2)
In the relation (2), the factor  is the
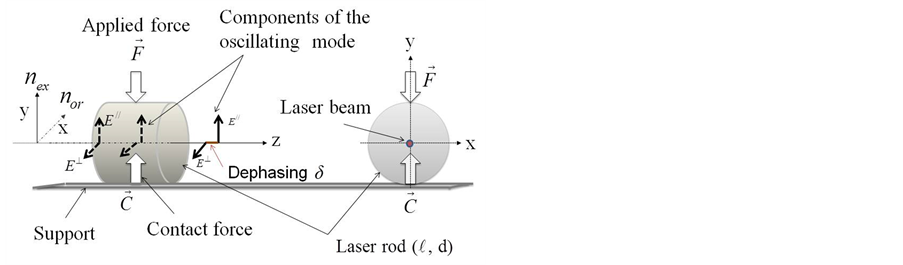
Figure 1. Effect of induced birefringence in a photo-elastic crystal laser with respect to its principal axes. E// and E^ are the parallel and orthogonal components of the oscillating laser mode relative to the direction of the force.
relative optical-stress coefficient (inverse of constraint or pressure) of the photo-elastic element and the quantity in the brackets is the difference between the two principal stresses in the plane normal to the direction of light propagation. The optical-stress coefficient depends slightly on the frequency ![]() of the light and so is constant for the case of monochromatic radiation of a monomode laser.
of the light and so is constant for the case of monochromatic radiation of a monomode laser.
The theory of elasticity applied to the case of a cylindrical rod of length  and diameter d in a compression, according to one of his diameter as indicated in Figure 1, give the relative optical stress coefficient in the center of the Nd:YAG crystal. The approximated expression of this coefficient is given by [7]:
 (3)
(3)
Hence, with the appearance of a birefringence in the laser medium when a force F is exerted on the crystal, the components ![]() and
and ![]() of the electric field associated to the light wave, after crossing the laser crystal, are no longer in phase. Thus, the two orthogonal polarization of the same oscillating mode undergo a phase shift given by:
of the electric field associated to the light wave, after crossing the laser crystal, are no longer in phase. Thus, the two orthogonal polarization of the same oscillating mode undergo a phase shift given by:
 (4)
(4)
3. Laser Sensor Configuration
A prospective study was conducted using a monolithic Nd:YAG laser from a cylindrical crystal with flat end faces (length l = diameter d = 4 mm). The choice of a packaged laser, having a monolithic configuration where the resonant cavity is formed by the faces of the rod, was preferred because of its good mechanical stability. For this, one end face was machined and polished in order to be convex  and the second one was made plane
 . A suitable optical coating on both sides was realized in order to obtain a low threshold for the laser emission in the case of the stable resonator used as a monolithic solid-state laser. The differences in frequency between consecutive axial mode and between an axial mode with a transverse one of the same order q are respectively:
 (5)
(5)
4. Expression for the Beat Frequency
When the laser crystal is not under load, the observed beat frequency signal contains many peaks. In particular, the peak close in frequency to  which corresponds to the beat between the frequencies
  and
and . When a static force is applied to the laser rod, each laser mode associated with frequencies
  and
and  is split respectively, into two orthogonally polarized modes as a result of the individual offset phase birefringence in the laser crystal, to
  for the laser mode
  and to
  for
for . As the bandwidth of the gain characteristic of the Nd:YAG laser amplifier is of about 150 GHz, approximately 7 longitudinal modes oscillate in the case of the laser cavity used for the actual sensor. Thus, the observed beat note signal is very complex and particular attention is needed when one measures the frequency associated with a peak whose frequency is variable with the applied force F. This situation means that the treatment of the beat signal requires manual input of the signal of interest. The frequencies of the two linearly polarized modes, associated with the oscillating laser, are deduced from the boundary conditions for the electric field in the laser cavity.
 (6)
(6)
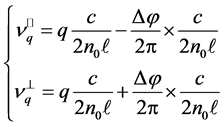
The theoretical expression for the induced difference in frequency between the orthogonal polarizations of light associated to the axial mode laser of order q is then:
 (7)
(7)
Finally, by using relations (4) and (6), one can write the expression of the instantaneous frequency deviation between the two components of the laser mode of order q in the form:
 (8)
(8)
Consequently, measurement of ![]() allows one to determine the external force from relation (8). In practice, by using a suitable polarizer, one can rotate the two orthogonal components to make them interfere, resulting in a measurable beat signal at the frequency
allows one to determine the external force from relation (8). In practice, by using a suitable polarizer, one can rotate the two orthogonal components to make them interfere, resulting in a measurable beat signal at the frequency![]() , given by the relation (8).
, given by the relation (8).
At lower stress levels, the elasticity of the crystal is respected and the frequency difference between the two orthogonal modes components can be varied continuously and linearly by several megahertz as a function of the action of the applied force (depending on its characteristics as conditions of its application, intensity and direction). As shown by relation (8), the range of the force which can be measured depends on the nature of the crystal used as a solid-state laser (coefficient of photo-elasticity  and refractive index
![]() ) but essentially on its dimensions (
) but essentially on its dimensions ( and
and ). Thus, to detect small forces, high sensitivity is needed. For this objective, it is necessary to use a monolithic configuration for the solid-state laser with a small crystal.
5. Experimental Measurement Set-Up
Ideally, a small force transfer apparatus would have a well defined loading point, a high force sensitivity but very low sensitivity to off-axis loading and a repeatable output. In the rough static contact between the laser rod and his support, the interface is the most deformable and his behavior determines the mechanical constraints established in the two solids [8]. To have a reliable and dynamic contact, the best configuration for the force sensor is a cylindrical photo-elastic crystal linked to a plane support. This geometrical shape allows one to achieve a good reproducibility of the points of contact not only between the crystal and its support but also the manner in which the force is applied on the crystal (better reproducibility of distribution of the stress in the photo-elastic crystal). In this configuration, by simple rotation of the crystal around it axis of revolution, alignment of the axes of anisotropy along those of the main constraints can be reached. This adjustment allows one to avoid non-linearity generated by the direction of application of the constraint relative to the main axes of the photo-elastic element.
Figures 2 and 3 show the general layout of the experiment and some indications of the configuration of the photo-elastic sensor of force. The Nd:YAG crystal is fixed to a plane iron block by using a thin film of transparent varnish. The temperature of the support is stabilized around 17.00˚C with an uncertainty of ±0.02˚C. The end faces of the Nd:YAG rod play the role of the mirrors of the laser resonator (configuration of a monolithic solid-state laser). Experience shows that a temperature-controlled and mechanically rigid mount of the laser crystal are critical on the stability of the laser emis-
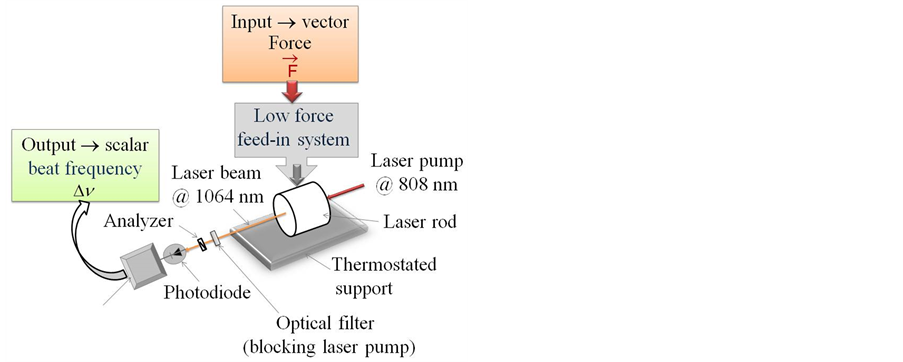
Figure 2. Schematic diagram of a photo-elastic force sensor.
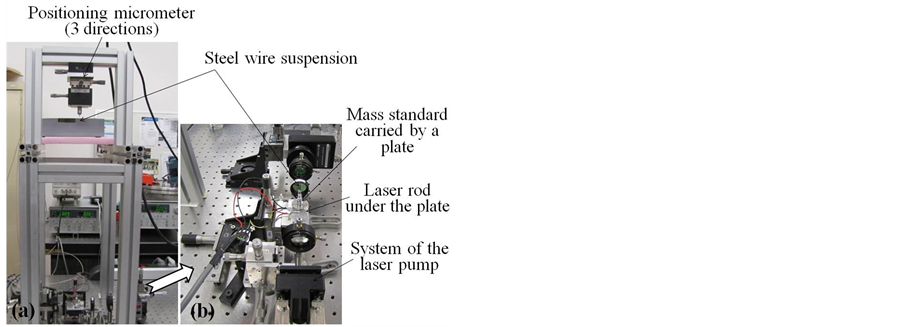
Figure 3. Experimental set-up: (a) General view; (b) Optical part of the photo-elastic laser sensor.
sion. Also, some adjustments are made to reduce the effects due to air volume displacements near the laser. The external force can be applied on the top of the crystal, by putting mass standard (to generate gravitational force) on the laser rod or by a nanometric piezoelectric transducer, which presses the crystal down against the bottom radius of the holder. The upper part of the crystal, where the contact with the deadweight or the flexible part of the piezoelectric transducer is done, was ground to produce a flat region of about (0.5 ´ 4) mm. This configuration corresponds to a significant gradient in the birefringence near the contact points and the stress field is quite uniform near the center of the crystal where the lasing occurs.
The beat frequency signal is observed and the shift of a reference peak between unloading and loading conditions was measured. No effect of hysteresis was observed during several repeated processes of installations and removal of the mass on the laser crystal.
In this work, the force was applied by using deadweight loads induced by calibrated mass artifacts whose value lies between 0.1 mg and 100 g. These mass standards are necessary in the comparative studies of results observed with various devices of small mass and force measurement. For the experiment, a steel plate is suspended by a wire having a diameter of 0.05 mm and 0.75 m in length, on which one deposits calibrated masses.
By using a system of displacement-rotation, the plate which supports the mass standard is deposited on the laser rod so that it is in a static equilibrium when the wire is entirely slackened. Figure 4 shows an illustration of the loading system. A He-Ne laser is used for preliminary alignment of the suspended plate relative to the local vertical direction to the top of the Nd:YAG rod. Because of the low dimensions of the plate, we were not able to use the same procedure for all masses employed. Then, the calibrated mass artifacts are either posed directly on the laser medium or carried by the suspended plate. It should be noted that this situation does not correspond to a limitation of the present sensor.
The mass of the system formed by the plate and his wire of suspension was measured with a commercial mass comparator to mp = (8000, 000 ± 0.005) mg.
6. Experimental Measurement Set-Up
6.1. Calibration with Micro-Masses
A commercial mass comparator was used after some improvements to reduce the influence of the fluctuations of environmental parameters on the weighing. This instrument was studied using a series of masses ranging from of 0.1 mg to 500 mg. It should be noted that these masses correspond to the standards which the LNE manufactured out recently and calibrated to about 0.1 μg. The results obtained for weighing between 0.1 mg (≈ 1 µN) and 500 mg (5 mN) are indicated on the Figure 5. Some characteristics of the mass comparator are summarized in the Table1 Also, via several sets of weights, the indications of this device were linked to the values of the calibrated mass standards. These results reported in Figure 5, show the good linearity of the apparatus in the range of
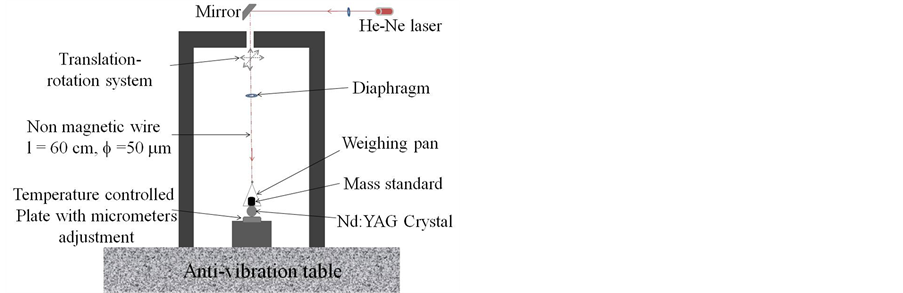
Figure 4. Schematic representation of the loading system incorporating a mass standard.
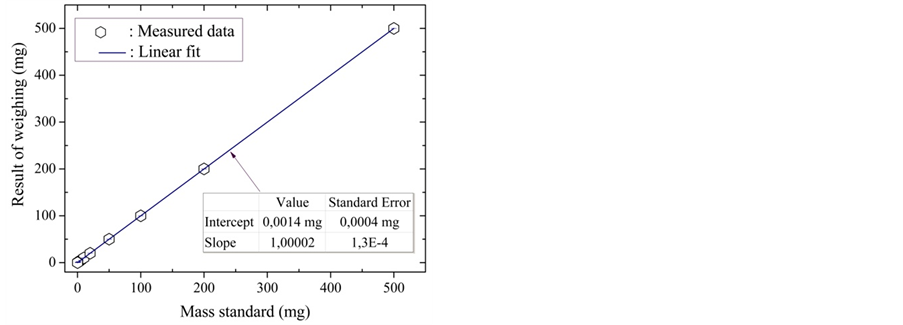
Figure 5. Indications of the balance according to the mass standard posed on its pan in the range of 0.1 to 500 mg.
masses from 0.1 mg to 500 mg.
Depending on the range of weighing, the relative deviation of the balance indications compared to the linear response (value given by mass standard) lies between 10−4 (range from 0.1 to 500 mg) and 6 × 10⁻⁵ (range from 0.1 to 100 mg).
The values related to the y-axis, referred to as “indications of the balance” in Figures 5 and 6, all result from the average of about twenty measurements obtained under quasi-identical conditions.
6.2. Sensitivity of the Photo-Elastic Force Sensor
The force produced by a deadweight load on a body is given by:
 (9)
(9)
where ![]() is the mass of the deadweight,
is the mass of the deadweight, ![]() the local acceleration of the gravity,
the local acceleration of the gravity,  the density of air and
  the density of mass standard used as deadweight.
The value of  was determined by using the CIPM formulae [9] and the measured values of atmospheric pressure, temperature and humidity near the experiment. The values used are: ρa = 11,949 kg·m‒3 and ρe = 7850 kg·m‒3 and gl = 980,938,101 (25) 10‒8 m s‒2 for the local

Table 1 . Balance characteristics with some environmental conditions of work.
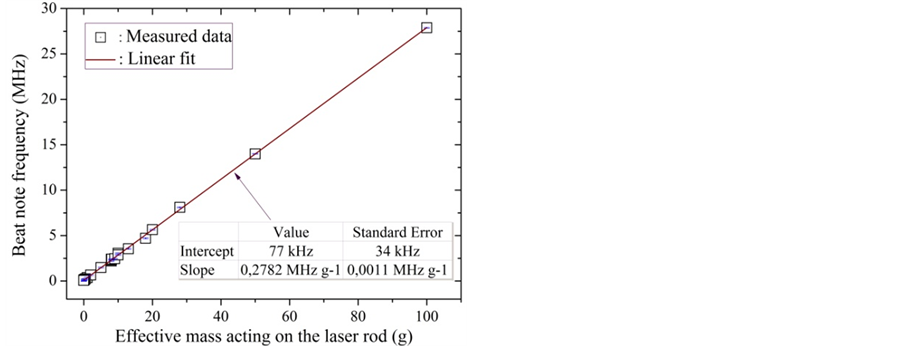
Figure 6. Sensitivity of the photo-elastic sensor (4 × 4) mm of force under the action of dead weights associated with masses standards in the field of gravity.
acceleration of gravity, measured in the vicinity of the experiment in January 2012 by colleague from SYRTE (Observatoire de Paris) with an optical gravimeter.
A simple calculation shows that uncertainty in Fdw is given by the uncertainty in the mass standard.
By using the uncertainties of  and
and , associated respectively with
  and
and  and
and ; then:
 (10)
(10)
The curve of Figure 6 represents the response of the photo-elastic sensor, in terms of instantaneous frequency deviation between the two orthogonal polarizations of the laser mode, when the crystal is loaded with a given mass. The observed results show that the behavior of the photo-elastic sensor is quasi-linear in the range studied, with an offset of about 70 kHz. This last parameter was minimized by the rotation of the laser rod around its axis of revolution. The persistent offset of about 70 kHz might be induced by residual stress in the laser medium.
The average value of the sensitivity, derived from a linear adjustment of the results reported in Figure 6, was evaluated to be about S = 0.2782 (0.0011) MHz·g−1 or in terms of deadweight force to S = 28.36 (0.11) MHz·N−1.
Table 2 presents a summary of the results of measurement obtained by other laboratories that used photoelastic force sensors for different configuration photoelastic force sensors for different configuration of solidstate Nd:YAG laser. In this table, we also give the value of the sensitivity and the associated uncertainty (expressed by a standard deviation) derived from data reported in Figure 6. The results obtained with other types of laser, as a photo-elastic crystal inside an He-Ne laser resonator, were not considered because they could not be compared with this study.
These experimental values clearly show that the sensitivity of this kind of sensor depends strongly on the dimensions of the laser medium, which in addition is confirmed by the model developed, but also on the geometrical configuration of the laser sensor. The solid line of Figure 6 represents the sensitivity derived from relation (8) when theoretical value of  is considered for photo-elastic constant of Nd:YAG crystal. Thus, the formula related to the solid line is given, according to crystal dimensions
  and d, by the relation:
 (11)
(11)
One might argue that the sensitivity increases with decreasing the dimensions of the laser medium for a given configuration of the laser sensors. This can be explained by the theory of elasticity because the principal ortho
Table 2. Measured sensitivities S of Nd:YAG photo-elastic force sensors for different configurations ( and d are the dimensions of the Nd-YAG crystal).
gonal stresses at the center of the laser rod are inversely proportional to its dimensions.
With the loading system used, symmetrical distribution of the load via the mini-plate in dynamic equilibrium on the top edge of the laser rod, we obtain a quasi-linear characteristic over the range of masses examined. Nevertheless, the deduced sensitivity starting from the linear adjustment from measurements, equal to 28.36 MHz·N‒1, remains slightly smaller than the theoretical value, calculated by considering the theoretical value of the constant, to about 30.80 MHz·N‒1. The application of the force on the laser rod, in contact on its plane support, should not generate components of horizontal forces or even very weak torques. This condition constitutes the principal weakness of the device we have developed, whose answer depends on the system used to apply force.
To analyze the reproducibility of the beat frequency signal, a mass standard of 2 g carried by the plate of mass 8 g was used and a series of several successive cycles of load-withdrawal with this effective mass were taken. The frequency of the beat signal goes from 60 kHz (laser medium unloaded) to 2.60 MHz (effective mass of 10,000 g is placed on the laser rod). The reproducibility of these frequencies is about 0.1 MHz.
In the context of the sensor, developed here, this corresponds to the measurement of a force of Fdw = 981.09 mN (Fdw is the gravitational force associated to m = 100 g) with a reproducibility of about 1.7 mN. In the short term, it constitutes the principal limitation in term of uncertainty during a series of measurements. The main source of uncertainty is associated with the stability of the signal of beat of frequencies imposed primarily by the mechanical vibrations which the laser rod and its support undergo. However, from the practical point of view, the reproducibility of the process of application of the force (series of poses and withdrawals of standard weights) and the nature of its contact with the laser crystal, limit the performance of the device. The response of the sensor can be described by a linear characteristic with an average relative deviation of about 0.3%. Figure 7 represents the experimental results reported by different
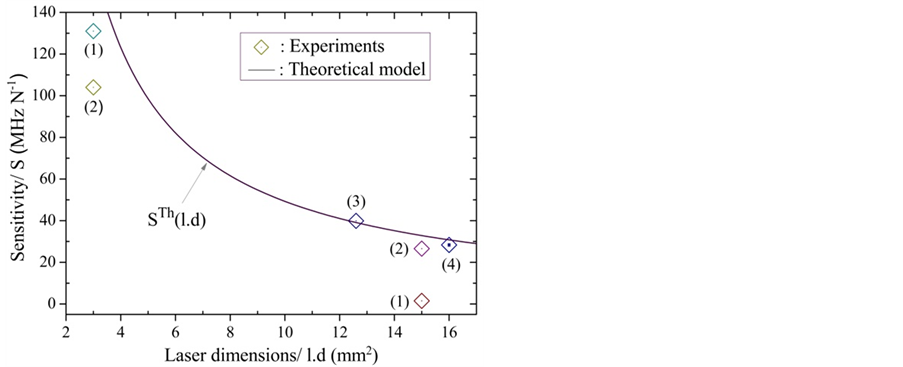
Figure 7. Experimental and theoretical sensitivities of various photo-elastic sensors versus dimensions of the monolithic laser. Experiments: (1) Holzapfel et al. (1993); (2) Holzapfel et al. (2000); (3) Ding et al. (2010); (4) This work. Full line: theoretical model.
groups (points with number) and the theoretical values derived from the model developed in & 4 (full line). The means values of sensitivity derived from theory lie very close to that measured in our case and especially for the result reported by Ding et al. [10].
The variations observed between theory and measurements are partly due to the uncertainty in the value of the photo-elastic constant. Chénais et al. [11] point out several inaccuracies reported about the values of the photoelastic constants of YAG crystal, resulting from an incorrect use of the Hooke law. In fact, the photo-elastic and the polarizability effects are so intermingled that one cannot separate clearly the effect of one from the other.
The deviations one observes in the case of laser sensor of small dimensions are larger because the approximation made for the value of the geometrical factor, i.e. term  in relation (3), is no longer justified.
7. Conclusion
In this work, a force sensor based on the photo-elastic effect in a monolithic Nd:YAG laser was demonstrated and used to compare the measured sensitivity of our force sensor with other measurements available. The result of this investigation indicates that the sensitivity of this kind of force sensor can reach high values by reducing the dimensions of the monolithic laser. However, notable discrepancies with the theory are observed when the dimensions of the laser sensor are small and need to be clarified by other measurements. The experimental results compared to theory show that sensitivity of about 110 MHz·N‒1, in the case of a (2 × 2) mm laser rod sensor, can be obtained. Also, the response of the photoelastic force sensor was quasi-linear in the measurement range. The hysteresis, observed on the frequency measurement when the process of load and discharge is repeated for about ten times, is less than 0.4%. Work is being undertaken to characterize the long-term stability of the laser rod by looking the repeatability of the beat frequency signal. Also, as the system possesses a wide range of measurement, it will be useful to consider comparisons in the overlap region with other devices founded on different physical principles, in the objective of traceable small force measurements to the International System of Units (SI).
Acknowledgements
“The optical sensor of small forces and micro-mass measurement” is a project which is supported by the “Joint Laboratory of Metrology” of LNE-Cnam and the “Direction de la Recherche Scientifique et Technologique” of LNE.
REFERENCES
- T. Madec, G. Mann, P.-A. Meury and N. E. Khélifa, “Extension de la Dissémination de L’unité de Masse entre 1 mg et 100 µg,” Revue Française de Métrologie, Vol. 3, 2011, pp. 27-29.
- D. B. Newell, J. A. Kramar, J. R. Pratt, D. T. Smith and E. R. Williams, “The NIST Microforce Realization and Measurement Project” IEEE Transactions on Instrumentation and Measurement, Vol. 52, No. 2, 2003, pp. 508- 511.
- W. Holzapfel and W. Settgast, “Force to Frequency Conversion by Intracavity Photoelastic Modulation,” Applied Optics, Vol. 28, No. 21, 1989, pp. 4585-4594. http://dx.doi.org/10.1364/AO.28.004585
- W. Holzapfel and M. Finnemann, “High-Resolution Force Sensing by a Diode-Pumped Nd:YAG Laser,” Optics Letters, Vol. 18, No. 23, 1993, pp. 2062-2064. http://dx.doi.org/10.1364/OL.18.002062
- J. C. Maxwell “On Physical Lines of Force,” In: W. D. Niven, Ed., The Scientific Papers of James Clerk Maxwell, Vol. 1, Dover Publications, New York, 1890.
- M. M. Frocht, “Photoelasticity, Vol. 1,” Wiley, New York, 1948, pp. 144-149.
- J. Scheibert, G. Debrégeas and A. Prevost, “Mécanique du Contact Rugueux et Perception Tactile,” Reflets de la Physique, Vol. 16, 2009, pp. 17-19. http://dx.doi.org/10.1051/refdp/2009018
- A. Picard, R. S. Davis, M. Gläser and K. Fujii, “Revised Formula for the Density of Moist Air (CIPM-1987),” Metrologia, Vol. 45, No. 2, 2008, pp. 149-155. http://dx.doi.org/10.1088/0026-1394/45/2/004
- W. Holzapfel, S. Neuschaefer-Rube and M. Kobusch, “High-Resolution, Very Broadband Force Measurement by Solid-State Laser Transducers,” Measurement, Vol. 28, No. 4, 2000, pp. 277-291. http://dx.doi.org/10.1016/S0263-2241(00)00042-7
- J. Ding, L. Zhang, Z. Zhang and S. Zhang, “Frequency Splitting Phenomenon of Dual Transverse Modes in Nd: YAG Laser,” Optics & Laser Technology, Vol. 42, No. 2, 2010, pp. 341-346. http://dx.doi.org/10.1016/j.optlastec.2009.08.002
- S. Chénais, F. Druon, S. Forget, F. Balembois and P. Georges, “On Thermal Effects in Solid-State Lasers: The Case of Ytterbium-Doped Materials,” Progress in Quantum Electronics, Vol. 30, No. 4, 2006, pp. 89-153. http://dx.doi.org/10.1016/j.pquantelec.2006.12.001