Journal of Surface Engineered Materials and Advanced Technology
Vol.4 No.4(2014), Article ID:47051,14 pages
DOI:10.4236/jsemat.2014.44023
Microwave Plasma Enhanced Chemical Vapor Deposition of Carbon Nanotubes
Ivaylo Hinkov1, Samir Farhat2*, Cristian P. Lungu3, Alix Gicquel2, François Silva2, Amine Mesbahi2, Ovidiu Brinza2, Cornel Porosnicu3, Alexandru Anghel3
1University of Chemical Technology and Metallurgy, Sofia, Bulgaria
2Laboratoire des Sciences des Procédés et des Matériaux, CNRS, LSPM-UPR 3407, Université Paris 13, Villetaneuse, France
3National Institute for Laser, Plasma and Radiation Physics, Bucharest, Romania
Email: *farhat@lspm.cnrs.fr
Copyright © 2014 by authors and Scientific Research Publishing Inc.
This work is licensed under the Creative Commons Attribution International License (CC BY).
http://creativecommons.org/licenses/by/4.0/


Received 15 April 2014; revised 14 May 2014; accepted 13 June 2014
ABSTRACT
Multi-walled carbon nanotubes (MWCNTs) were grown by plasma-enhanced chemical vapor deposition (PECVD) in a bell jar reactor. A mixture of methane and hydrogen (CH4/H2) was decomposed over Ni catalyst previously deposited on Si-wafer by thermionic vacuum arc (TVA) technology. The growth parameters were optimized to obtain dense arrays of nanotubes and were found to be: hydrogen flow rate of 90 sccm; methane flow rate of 10 sccm; oxygen flow rate of 1 sccm; substrate temperature of 1123 K; total pressure of 10 mbar and microwave power of 342 Watt. Results are summarized and significant main factors and their interactions were identified. In addition a computational study of nanotubes growth rate was conducted using a gas phase reaction mechanism and surface nanotube formation model. Simulations were performed to determine the gas phase fields for temperature and species concentration as well as the surface-species coverage and carbon nanotubes growth rate. A kinetic mechanism which consists of 13 gas species, 43 gas reactions and 17 surface reactions has been used in the commercial computational fluid dynamics (CFD) software ANSYS Fluent. A comparison of simulated and experimental growth rate is presented in this paper. Simulation results agreed favorably with experimental data.
Keywords:Nanotubes, Growth, CVD, Modeling, Kinetics

1. Introduction
Since their discovery by Iijima in 1991 [1] , carbon nanotubes have generated much interest due to their quasi one-dimensional structure and their unique combinations of electronic, field emission, mechanical and chemical properties coupled with the new ability to grow them aligned on a substrate. This opened unlimited possibilities of applications such as field emitters, sensors, high-density energy storage devices, photonic crystals, active media for lasers, non-linear optical media etc... To grow vertically-aligned nanotubes, chemical vapor deposition (CVD) has emerged as a key technique. Indeed, contrarily to the arc, laser and HiPCO processes where the nanotubes are produced separately, purified and then manipulated for producing devices [2] , CVD allows spatially controlled and highly functional components in (2D) and (3D) architecture opening the way to produce selfassembly devices with higher packing density and performances [3] . In addition, CVD offers low-temperature and large-scale production possibilities. In CVD systems, a thin catalyst layer is first deposited on silicon wafer by a separate physical vapor deposition PVD technique. When heated, the continuous catalyst layer disaggregates and forms small particles, with size controlled by the layer thickness in the range of 1 to 10 nm [4] . Then, the growth of nanotubes occurs through catalytic decomposition of a carbon gas source over the catalyst. The nanotube characteristics such as diameter, density, Single-walled SWNT versus Multi-walled MWNT depend on the size of these particles but also on the gas feedstock activation technique. Two distinct activation routes emerged, 1) thermally via an oven or hot-filament heating and 2) plasma enhanced chemical vapor deposition (PECVD) via DC, RF or microwave discharges. Plasma activation has the advantage to prevent thermal damage to the substrate allowing lower operating temperatures and better nanotubes vertical positioning due to the presence of an electric field normal to the substrate [5] .
In the present work, we used thermionic vacuum arc (TVA) technology to produce uniform nickel layers of ~1 nm thickness. Then, a mixture of methane, hydrogen and oxygen (CH4/H2/O2) was used to produce carbon nanotubes. Indeed, the addition of a controlled amount of a weak oxidizer as oxygen or water into the growth ambient of CVD was reported to significantly enhance the activity and lifetime of the catalyst resulting in efficient nanotubes growth [6] [7] .
2. Experimental
Nickel films deposited on silicon substrates were prepared using thermionic vacuum arc (TVA) technology developed at NILPRP Bucharest [8] -[11] . The coating device consists of a tungsten filament surrounded by an electron focusing Wehnelt cylinder heated by an external high current source as cathode and an anode made of nickel. For ignition and maintaining the TVA arc two circuits are necessary: 1) for the heating of the cathode filament, where a relatively low voltage source (0 - 24 V) provides a 10 - 150 A current and 2) for the running up of the arc discharge, being used for this an adjustable source of high voltage (0 - 4 kV) and a current up to 3 A. The electrons coming from the cathode heats up and evaporates the anode and pure Ni plasma is ignited by applying a high dc voltage on the anode as illustrated in Figure 1(a). The deposition chamber of Figure 1(b) has been under a residual pressure of 3 × 10⁻⁶ torr before the beginning of the coatings. For plasma ignition, the TVA gun filament has been heated with a 60 A current and at an alternative voltage of 20 V. The continuous voltage has been applied on the anode with an increasing rate of approximately 1000 V/min, being followed by the focusing process of the electron beam by the Wehnelt cylinder on the anode crucible. When the powder in the crucible has melt, the applied voltage was adjusted in order to ensure the ignition of the discharge in the Ni
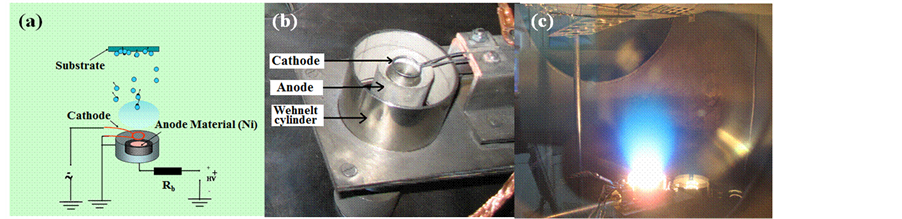
Figure 1. Thermionic vacuum arc TVA set-up for catalyst deposition. (a) Principle, (b) deposition chamber and (c) plasma running in Ni vapors.
vapors. A stable discharge shown in Figure 1(c), is obtained and the film thickness measured during all the duration of the deposition process with a quartz balance equipment. The deposition has been interrupted when the thickness of 1 nm is reached. At this step, the anode voltage and the applied current to the TVA gun filament have been reduced to zero and the sample kept in the deposition chamber, under high vacuum for about 120 minutes to slowly cool down. Finally, Ni/Si substrates with ~1 nm nickel thickness were obtained in 18 - 20 s, due to a fine control of the deposition rate of ~0.05 nm/s.
For nanotube growth, we used a 10 cm diameter silica bell jar low pressure reactor activated by a microwave electric field (Figure 2) and developed originally to CVD diamond growth [12] [13] . The input gases (CH4/H2/O2) with mass flow rates controlled electronically were injected in the reactor and exit via the reactor pumping system. The Ni/Si substrate is held in a resistance boat made in molybdenum and electrically heated to a temperature ranging from 973 to 1123 K. During all the experiment, substrate temperature was monitored by an optical pyrometer. The reactor utilizes 1.2 kW SAIREM microwave generator operating at 2.45 Ghz. The electromagnetic waves are generated, guided in a rectangular wave guide and applied inside the cavity delimited by Faraday cage (Figure 2(a)). The short-circuit piston at the end of the wave guide helped to create stationary waves and to situate the maximum of the electric field near the substrate. Input power was varied with the pressure simultaneously in order to hold plasma volume constant (Figure 2(b)). Efficient operation is assumed with good microwave coupling, and minimal radial diffusion to the quartz enclosure thereby leading to greater discharge stability and better plasma uniformity. As shown in Figure 2(b), a quasi hemispherical active plasma zone of radius of 2.5 cm is created near the substrate. The function of this zone is to produce the charged and radical species that diffuse to the catalyst particle and contribute to nanotube growth. For microwave PECVD nanotube synthesis we developed an experimental protocol composed by three steps: 1) thermal annealing of Ni/Si substrates, 2) hydrogenation of Ni catalyst, 3) nanotube growth.
For this protocol, the essential parameters were optimized using Taguchi design method of Table 1, with 3 factors and 2 levels. These parameters are namely, substrate temperature, hydrogen flow rate, and total pressure. This last parameter was coupled with the total input microwave power to hold the plasma volume constant. For all the 8 experiments, the silicon substrate covered by 1 nm thick nickel was first annealed in vacuum at specified temperature, then nickel catalyst particles was reduced using hydrogen plasma for 10 minutes. Finally, 10 sccm of methane were introduced to grow nanotubes during 20 minutes.
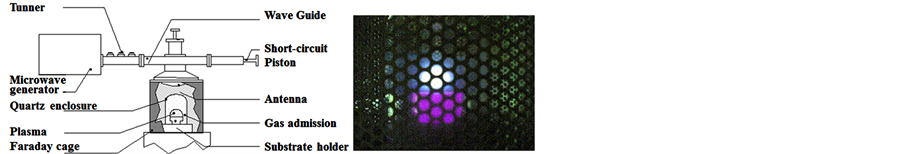
Figure 2. PECVD Bell jar reactor. (a) Scheme and (b) plasma picture through the Faraday cage during nanotubes growth.

Table 1. Factors and levels for the PECVD synthesis of nanotubes. Pressure and microwave power are coupled.
After removing samples from the reactor, they were analyzed by scanning electron microscopy SEM LEO 440. In addition, surface morphology of the substrates, before and after thermal annealing was examined by atomic force microscopy AFM D3100, Nanoscope NS3.
3. Modeling Approach
A two-dimensional simulation of the PECVD process was performed in order to compare the theoretical prediction and the experimental measurements. Computational fluid dynamics (CFD) modeling evaluations were made for the temperature and species concentrations profiles as well as for the carbon nanotube growth rate in the reactor. Simulations were performed by using the commercial software ANSYS Fluent version 12.
3.1. Geometry and Assumptions
The 2D computational domain shown in Figure 3 includes the PECVD reactor quartz enclosure, containing the substrate holder and the plasma zone. From experimental observations, plasmas are most intense along with the top edge of the substrate holder. The microwave plasma volume used in the present simulations was estimated from visual observations under experimental growth conditions in the reactor. The geometry was created using ANSYS Design Modeler and the mesh is generated using ANSYS Meshing application. The chosen dimensions of the reactor refer to the experimental setup. The grid is composed of an unstructured triangular mesh. Because of the strong temperature and concentrations gradients near the substrate where the CNT are grown, a condensed quadrilateral mesh refinement was applied on this region. After numerous checks for grid sensitivity and mesh constraints, the total number of elements is 4583, the final grid has 2487 nodes with a grid skewness maximum of 0.78. To understand the effect of the macroscopic process parameters on carbon nanotubes growth rate, a 2D model has been developed based on the following assumptions:
Ÿ The plasma is in Local Thermodynamic Equilibrium (LTE). This assumption allows us to define a unique temperature of all plasma species in localized areas in the plasma;
Ÿ Laminar flow: it is characterized by relatively low values of the Reynolds number caused by small inlet flow rate;
Ÿ The plasma is modeled using a steady state time formulation;
Ÿ Axisymmetric physical domain;
Ÿ The radiative losses are neglected;
Ÿ Only neutral species are involved in the gas-phase and surface chemistry.
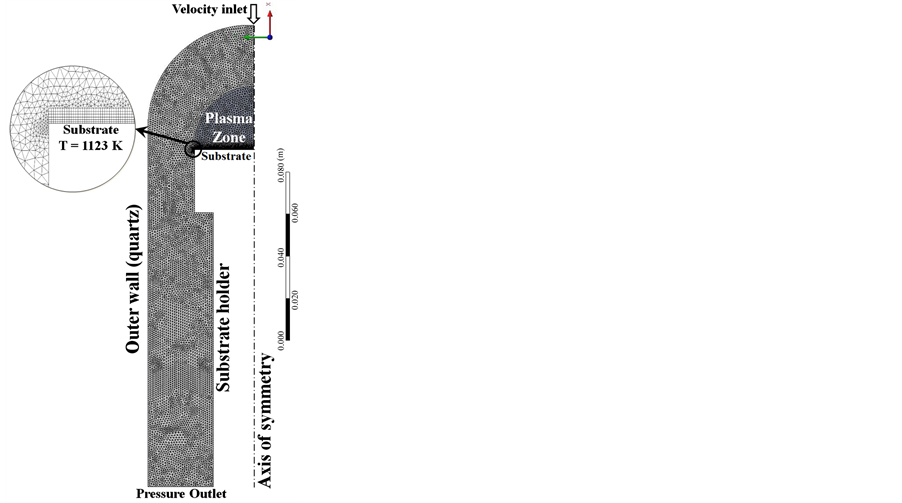
Figure 3. Two-dimensional computational domain.
These assumptions lead to the following limitations: The existence of only neutral species affects the accuracy of the calculated concentrations of considered species. We expect the influence of the charged species on carbon nanotubes growth rate to be minor because their molar fraction is not great. The major species formed in the plasma are H, H2, CH4, CH3, C2H2, and C2H4 and the gas phase chemistry in the plasma is dominated by the neutral species [14] . Furthermore, assuming LTE reduces the complexity of the mixture considerably.
3.2. Gas-Phase Chemistry
In the methane/hydrogen plasma, different species are created due to chemical reactions. The considered gasphase chemistry involves 13 neutral species and consists of 43 reactions leading to the conversion of CH4. This reaction set is given in Table 2. The gas phase chemistry model describes homogeneous reactions that influence the species concentration distribution near the deposition surface through the production/destruction of chemical species in the gas phase. Each reaction is assumed to be reversible. The temperature dependence of the forward rate constants is usually described through a modified Arrhenius type of expression.
3.3. Surface Chemistry
The surface chemistry model used in the present study describes the reactions and other processes that take place at the substrate surface, involving both gaseous species impinging on the surface, adsorbed molecules, atoms and free sites. These surface processes lead to the growth of solid carbon nanotubes. Actually, surface reactions in the PECVD process are not fully understood. The proposed surface reaction mechanism consists of 18 heterogeneous reactions involving vacant surface sites SNi on a nickel catalyst particle, 7 surface species (CH4(s), CH3(s), C1H2(s), CH(s), C(s), H(s), CNT) and 5 gaseous species (C2H2, CH4, CH3, H2, H). These reactions include surface site adsorption/desorption, hydrogen abstraction/addition, and carbon diffusion toward a carbon nanotube growth edge (Table 3).
The rate of deposition is governed by both chemical kinetics and the diffusion rate from gas to the surface. The reactions create sources of chemical species in the bulk phase and determine the rate of deposition of surface species.
Following the above considerations, the growth of MWNT on the substrate is expected to occur as follows. The plasma generates vapors and provides carbon contamination to the nickel particles. These particles having suitable temperature and size will be the sites of CNT growth.
The surface structure is associated with a surface site density Γ (given in mol∙cm−2) required to evaluate the surface growth rate of MWNT. Since experimental determination of site density is difficult, we used the value for the reconstructed diamond (100) surface Γ = 2.61 × 10⁻⁹ as an upper limit. In the specific case of nanotube growth in PECVD reactor, the surface site density is certainly much lower than this value. It could be estimated from the substrate density of catalytic nickel particles and the concentration of the surface sites occupied by C atoms on each nanoparticle.
3.4. Initial and Boundary Conditions
The temperature at the outer boundary walls and the substrate holder except for the substrate surface was fixed to 400 K. The temperature of the substrate surface was much higher, at 1123 K.
The inlet conditions of the simulations were derived from the experimental conditions i.e., volume %: 10% CH4 and 90% H2. The gas mixture was initialized to a uniform temperature of 298 K. The gas velocity was specified as a uniform inflow condition with vertical upward velocity of 0.1326 m/s at a temperature of 298 K. The initial inlet mole fractions for all species were calculated using a thermochemical model based on Chemkin software in 0D [31] . The gas outlet was specified as a pressure outlet. The initial pressure inside the reactor was fixed at 10 mbar.
3.5. Computational Procedure
2D reactor simulation including coupled momentum, heat and species transfer was performed by using the CFD code ANSYS Fluent. It utilizes the finite volume method to solve the governing equations, i.e., conservation of total mass, momentum, and energy, and the individual species conservation equations. The reactive flow is modeled using the 2D axisymmetric laminar finite-rate model, including the above-mentioned volumetric and
Table 2. Gas-phase reactions.
*Units for A depend on the reaction order but are defined in terms of mol, cm3 and s.
Table 3. Surface reactions.
*Units for A depend on the reaction order but are defined in terms of mol, cm3 and s. **Sticking coefficient.
surface reactions. The Simple method for pressure-velocity coupling and the second order upwind scheme to interpolate the variables on the surface of the control volume were selected.
The model requires knowledge of the thermo-chemical and transport properties of the gases in the reactor chamber. Thermo-chemical properties of the gas species as a function of temperature have been taken from CHEMKIN thermodynamic database [32] -[33] . Temperature and species dependence was imposed in calculations of thermodynamic and transport properties. The required Lennard-Jones parameters for many CVD gases can be found in e.g. Ref. [34] . Viscosity of the individual species was calculated by using kinetic theory.
The mixture viscosity was calculated using ideal gas mixing law. Thermal conductivity for individual species was calculated using kinetic theory. Specific heat capacity of individual species was calculated using piecewise-polynomial approximation.
To account for the plasma heating from the microwave power, a constant volumetric heat source, applied in the plasma zone, was included in the governing energy equation. It was calculated from the input plasma power and the estimated plasma volume. For input plasma power of 342.8 W, the calculated power density was 0.634 × 10⁷ W/m3. The heat source using CH4 and H2 as a medium creates plasma field with a temperature over 2000 K.
The solution was initialized from the inlet. It was monitored approximately up to 20,000 iterations with residual convergence fixed between 1 × 10⁻³ and 1 × 10⁻⁵.
The calculated rate of production sCR expressed in moles/cm2/s is converted to linear nanotube growth rate G in m/s by using nanotube bulk mass density ρCNT = 2.20 g/cm3 and molecular weight MCNT = 12.01 g/mol using the equation:
 (1)
(1)
4. Results and Discussion
4.1. Experimental Results
Atomic force microscopy (AFM) of the as produced by TVA Ni/Si substrates and annealed at 850˚C during 20 minutes then hydrogenated with pure hydrogen plasma during 10 minutes was carried out to determine the surface morphology. Figure 4 shows AFM images of the substrate before (a and b) and after (c and d) annealing.
The change in the root mean square roughness RMS was from 1.864 nm before annealing to 3.485 nm after annealing. This higher rough surface clearly indicates an agglomeration of individual nickel clusters. After thermal annealing of Ni/Si substrates at the consigned temperature during 20 minutes, we followed the same experimental protocol for all the 8 experiments of Table 1.
First, substrates are treated with pure hydrogen plasma during 10 minutes then 10 sccm of methane was added into the mixture for 20 minutes. Scanning Electron Microscope indicates that no or few nanotubes were found
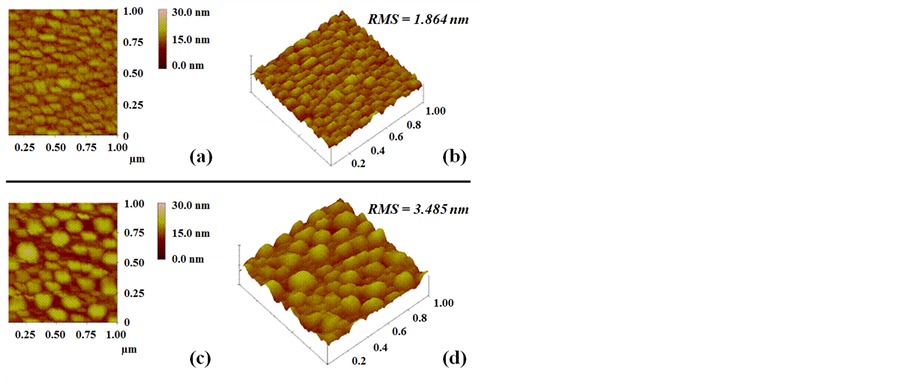
Figure 4. AFM images of the substrate before ((a) and (b)) and after ((c) and (d)) annealing.
for samples at 700˚C E1, E3, E5 and E5 suggesting that 700˚C is the lower growth temperature. Long spiral or helical nanotubes were observed for sample E2 and shorter nanotubes at different densities were found in samples E4, E6 and E8. Since carbon diffusion in bulk Ni is characterized by a large energy, namely, activation energy of 1.4 eV (33 kcal/mole) [35] , we can estimate the diffusion coefficient of carbon in nickel using the following equation at lower and upper temperatures.
 (2)
(2)
At 700˚C, DC−Ni ~3.9 × 10⁻⁹ m2∙s−1 and at 850˚C, DC−Ni ~3.8 × 10⁻⁸ m2∙s−1, hence carbon diffusion in the catalyst is increased by one order of magnitude.
To explain the role of the combined parameter on growth, we calculated the plasma kinetics using a thermochemical model based on Chemkin software in 0D [36] . This model actually includes 119 species in C/H system with atoms and molecules including Polycyclic aromatic hydrocarbons (PAHs), ions and electrons and 336 chemical reactions [13] [37] . Figure 5, shows the calculated hydrogen atom mole fraction in the plasma for the different conditions of Table 1. It clearly indicates that hydrogen atoms excess is not suitable for nanotube growth in microwave plasma systems.
In extreme case E3, SEM pictures revealed a strong etching of the substrate. Based on these observations, the best combination of parameters are those of experiment E2 which will be retained to explore the effect of oxygen. It was reported by several workers that addition of a controlled amount of oxygen or water ranging from 500 ppm to 2%, significantly enhances nanotubes growth.
Since the lower limit of our oxygen mass flow rate is 1 sccm, we increased the H2 flow rate of experiment E2 from 10 to 90 sccm in order to avoid the limit of explosion of the hydrogen/oxygen mixture. The conditions of this experiment called OPTI are summarized in Table 4.
In Figure 6 are showed the Scanning Electron Microscope images of sample OPTI. All the silicon surface is regularly covered by multiwalled carbon nanotubes of about 40 nm outer diameter and 1 µm long. Each nanotube is terminated by a catalyst particle on its top suggesting a top-growth mechanism.
In Figure 7, we can see the limit between the nickel covered and intentionally non covered witness area during the PVD step. Results demonstrate that the combination of TVA and PECVD is a powerful tool to uniform cover a large surface area with nanotubes.
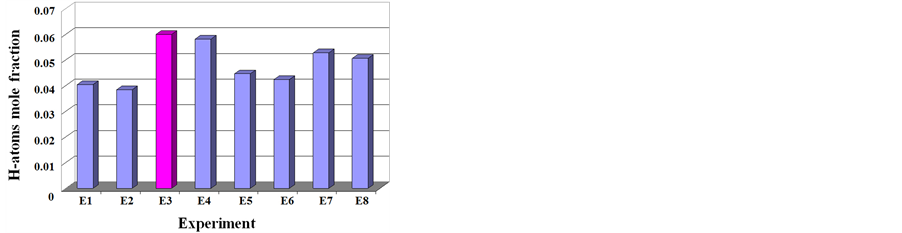

Figure 6. Scanning Electron Microscope images of samples OPTI showing a regular coverage of the substrate by nanotubes at two magnifications levels. Tool bars are100 µm for left image and 2 µm for right image.
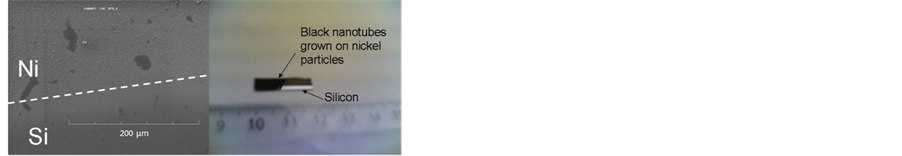
Figure 7. Left: Scanning Electron Microscope images of samples OPTI showing the border (dashed line) between nickel covered and non-covered silicon. Right: macroscopic image of the substrate, the black part is covered by nanotube and the shiny part is silicon.
Table 4. Optimal conditions, experiment OPTI.
4.2. Modeling Results
A two dimensional steady-state reactor simulations performed by CFD code ANSYS Fluent 12 provided information about the temperature and species distribution in the reactor otherwise difficult to characterize. The simulations conditions are summarized in Table 5.
As first results we present the simulated temperature contours inside the reactor (Figure 8(a)). The maximal temperature in the center of the plasma at a distance of ~17 mm to the substrate is 2163 K. Such temperatures are expected to yield a complete dissociation of the carbon precursor and the availability of atomic carbon. Thermal balance of plasma heating and substrate cooling determines the substrate temperature. Hence, there is a steep temperature gradient between the substrate and the region where temperature is highest as shown in the 1D profile along the centerline of the reactor (Figure 8(b)). Also, temperature near the substrate is within the range for the appropriate MWCNT-synthesis temperature condition (950 - 1150 K). Thus, the experimentally observed, stably CNT-synthesizing conditions correspond to the appropriate conditions to produce MWCNTs, in terms of both supplied carbon concentrations and temperature.
The gas temperature decreases when the gas reaches around the quartz walls and the gas goes down.
The inlet gas is introduced in the reactor from the top side of the quartz enclosure. It splits into two components: one flows to the outlet and other flows to the substrate. Figure 9 shows the gas flow around the substrate. The flow and trajectories of gas species are visualized by using path lines. The length of arrows corresponds to the gas flow velocity. On the top surface of the substrate, gas flows from the center to the substrate edges. The gas stagnates and the magnitude of flow is relatively smaller than other regions. The presence of vortices in the region above the substrate is suspected to increase the mass flux of carbon species from the plasma zone to the cold substrate region, and to enhance the nanotube growth.
The simulated species profiles presented in Figure 10 show that C2H2, CH3 and CH4 are important species that may significantly contribute to carbon nanotubes growth. There is a region of uniform C2H2, CH3 and CH4 distribution where CNTs were synthesized for the experiments, showing a relatively broader region close to the substrate surface. Other species such as atomic carbon and hydrogen have also a rather important contribution. Finally, simulation shows that large amounts of H2 are produced in the gas phase, but H2 production arises also from the surface desorption (Figure 11).
First simulation results were obtained by adjusting the surface site density in order to reproduce the experimental deposition rate values. For Γ = 5.0 × 10⁻¹⁰ the calculated nanotube growth rate was 8.3 μm/h. We checked the influence of the substrate temperature by varying it from 873 K to 1273 K and confirmed that increasing the temperature leads to increasing of the nanotubes growth rate from 0.5 to 45 μm/h. To calculate the activation energy of the surface reactions, we plotted the logarithm of the calculated nanotubes growth rates against 10,000/Tsub where Tsub is the temperature of the substrate (Figure 12). The plotted points follow an Arrhenius type law that allows us to calculate activation energy of 1.2 kJ/mol.
 (a)
(a)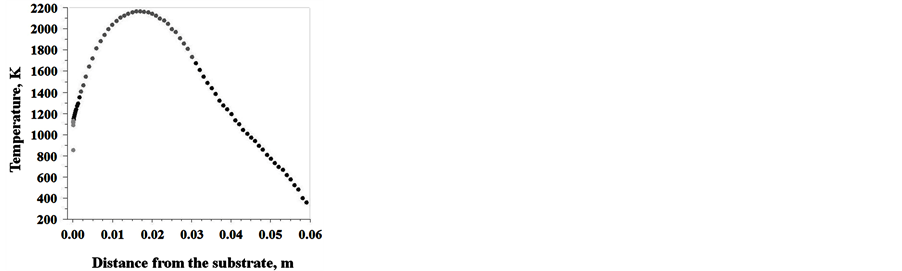 (b)
(b)
Figure 8. (a) Simulated temperature profile inside the reactor; (b) 1D temperature profile along the centerline of the reactor.
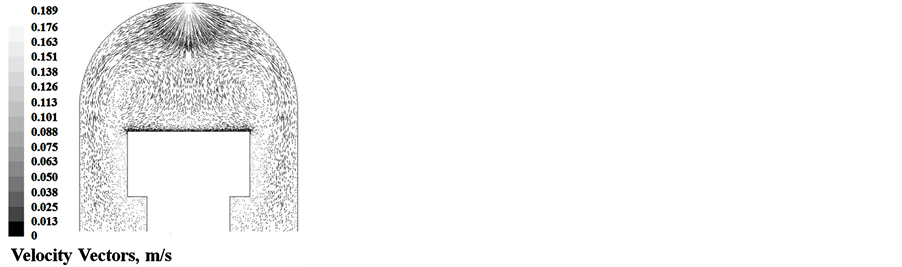
Figure 9. Velocity vectors around the substrate.
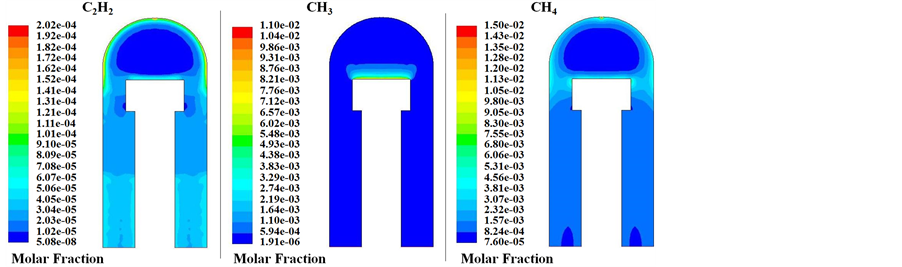
Figure 10. Simulated molar fractions of C2H2, CH3 and CH4.
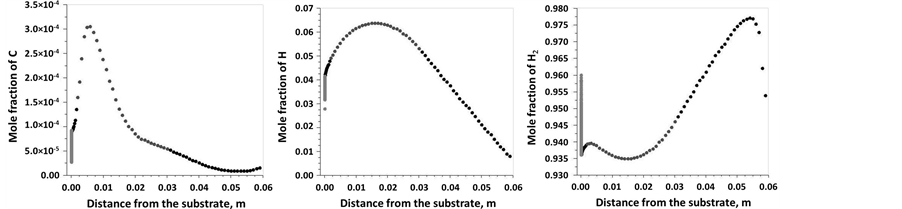
Figure 11. 1D temperature profile of the C, H and H2 mole fractions along the centerline of the reactor.
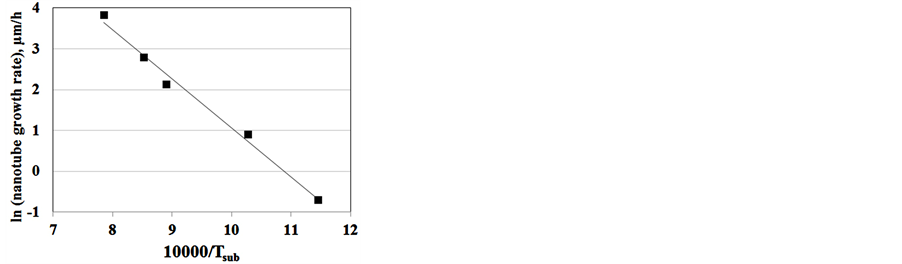
Figure 12. Logarithm of the calculated nanotubes growth rates against 10,000/Tsub.
Table 5. Simulations conditions.
5. Conclusions
In this work, we have successfully grown multi-walled carbon nanotubes on Ni/Si substrates using a combination of two methods: 1) thermionic vacuum arc (TVA) to catalyst 1 nm ultra-thin films deposition and 2) microwave plasma PECVD with a mixture of methane and hydrogen to CNT’s growth. By using an experimental factor plan, substrate temperature and plasma power density were observed to significantly influence nanotube growth. Substrate temperature affects carbon diffusion into the catalyst particle while plasma power controls the atomic hydrogen in the plasma. Based on SEM observations, higher substrate temperature and lower hydrogen atom concentration are favorable to nanotube growth. In addition, a limited fraction of oxygen added to the plasma enhances the catalytic activity improving nanotube growth. Further work is underway in order to explore the number of walls and alignment of the CNTs by controlling the catalyst size.
Plasma reactor simulation results confirmed these experimental trends. Hydrocarbon species such as C2H2, CH3 and C are likely to be key deposition species influencing CNT growth rate. The reaction mechanism used in these simulations will be improved to further confirm these preliminary results.
References
- Iijima, S. (1991) Helical Microtubules of Graphitic Carbon. Nature, 354, 56-58. http://dx.doi.org/10.1038/354056a0
- Farhat, S. and Scott, C. (2006) Review of the Arc Process Modeling for Fullerene and Nanotube Production. Journal of Nanoscience and Nanotechnology, 6, 1189-1210. http://dx.doi.org/10.1166/jnn.2006.331
- Yu, B. and Meyyappan, M. (2006) Nanotechnology: Role in Emerging Nanoelectronics. Solid State Electronics, 50, 536-544. http://dx.doi.org/10.1016/j.sse.2006.03.028
- Schäffel, F., Schünemann, C., Rümmeli, M.H., Täschner, C., Pohl, D., Kramberger, C., Gemming, T., Leonhardt, A., Pichler, T., Rellinghaus, B., Büchner, B. and Schultz, L. (2008) Comparative Study on Thermal and Plasma Enhanced CVD Grown Carbon Nanotubes from Gas Phase Prepared Elemental and Binary Catalyst Particles. Physica Status Solidi (b), 245, 1919-1922. http://dx.doi.org/10.1002/pssb.200879605
- Delzeit, L., Nguyen, C.V., Stevens, R.M., Han, J. and Meyyappan, M. (2002) Growth of Carbon Nanotubes by Thermal and Plasma Chemical Vapour Deposition Processes and Applications in Microscopy. Nanotechnology, 13, 280-284. http://dx.doi.org/10.1088/0957-4484/13/3/308
- Hata, K., Futaba, D.N., Mizuno, K., Namai, T., Yumura M. and Ijima, S. (2004) Water-Assisted Highly Efficient Synthesis of Impurity-Free Single-Walled Carbon Nanotubes. Science, 306, 1362-1364. http://dx.doi.org/10.1126/science.1104962
- Zhang, G., Mann, D., Zhang, L., Javey, A., Li, Y., Yenilmez, E., Wang, Q., McVittie, J.P., Nishi, Y., Gibbons, J. and Dai, H. (2005) Ultra-High-Yield Growth of Vertical Single-Walled Carbon Nanotubes: Hidden Roles of Hydrogen and Oxygen. PNAS, 102, 16141-16145. http://dx.doi.org/10.1073/pnas.0507064102
- Lungu, C.P., Mustata, I., Zaroschi, V., Lungu, A.M., Anghel, A., Chiru, P., Rubel, M., Coad, P. and Matthews, G.F. (2007) Beryllium Coatings on Metals for Marker Tiles at JET: Development of Process and Characterization of Layers. Physyca Scripta, T128, 157-161. http://dx.doi.org/10.1088/0031-8949/2007/T128/030
- Lungu, C.P., Mustata, I., Musa, G., Lungu, A.M., Zaroschi, V., Iwasaki, K., Tanaka, R., Matsumura, Y., Iwanaga, I., Tanaka, H., Oi, T. and Fujita, K. (2005) Formation of Nanostructured Re–Cr–Ni Diffusion Barrier Coatings on Nb Superalloys by TVA Method. Surface and Coating Technology, 200, 399-402. http://dx.doi.org/10.1016/j.surfcoat.2005.02.172
- Lungu, C.P. (2005) Nanostructure Influence on DLC-Ag Tribological Coatings. Surface and Coating Technology, 200, 198-202. http://dx.doi.org/10.1016/j.surfcoat.2005.02.103
- Lungu, C.P., Mustata, I., Zaroschi, V., Lungu, A.M., Chiru, P., Anghel, A., Burcea, G., Bailescu, V., Dinuta, G. and Din, F. (2007) Spectroscopic Study of Beryllium Plasma Produced by Thermionic Vacuum Arc. Journal of Optoelectronics and Advanced Materials, 9, 884-886.
- Silva, F., Gicquel, A., Chiron, A. and Achard, J. (2000) Low Roughness Diamond Films Produced at Temperatures Less than 600°C. Diamond and Related Materials, 9, 1965-1970. http://dx.doi.org/10.1016/S0925-9635(00)00347-2
- Scott, C.D., Farhat, S., Gicquel, A., Hassouni, K. and Lefebvre, M. (1996) Determining Electron Temperature and Density in a Hydrogen Microwave Plasma. Journal of Thermophysics and Heat Transfer, 10, 426-435. http://dx.doi.org/10.2514/3.807
- Garg, R.K., Kim, S.S., Hash, D.B., Gore, J.P. and Fisher, T. (2008) Effects of Feed Gas Composition and Catalyst Thickness on Carbon Nanotube and Nanofiber Synthesis by Plasma Enhanced Chemical Vapor Deposition. Journal of Nanoscience and Nanotechnology, 8, 3068-3076. http://dx.doi.org/10.1166/jnn.2008.082
- Marinov, N.M. and Malte, P.C. (1995) Ethylene Oxidation in a Well-Stirred Reactor. International Journal of Chemical Kinetics, 27, 957-986. http://dx.doi.org/10.1002/kin.550271003
- Walter, D., Grotheer, H.H., Davies, J.W., Pilling, M.J. and Wagner, A.F. (1990) Experimental and Theoretical Study of the Recombination Reaction CH3 + CH3 – C2H6. Symposium (International) on Combustion, 23, 107-114. http://dx.doi.org/10.1016/S0082-0784(06)80248-1
- Tsang, W. and Hampson, R.F. (1986) Chemical Kinetic Data Base for Combustion Chemistry. Part 1. Methane and Related Compounds. Journal of Physical and Chemical Reference Data, 15, 1087-1279. http://dx.doi.org/10.1063/1.555759
- Miller, J.A. and Melius, C.F. (1992) Kinetics and Thermodynamic Issues in the Formation of Aromatic Compounds in Flames of Aliphatic Fuels. Combustion and Flame, 91, 21-39. http://dx.doi.org/10.1016/0010-2180(92)90124-8
- Markus, M.W., Woiki, D. and Roth, P. (1992) Two-Channel Thermal Decomposition of CH3. Symposium (International) on Combustion, 24, 581-588. http://dx.doi.org/10.1016/S0082-0784(06)80071-8
- Warnatz, J. (1984) Rate Coefficients in the C/H/O System. In: Gardiner Jr., W.C., Ed., Combustion Chemistry, Book Chapter, Springer-Verlag, New York.
- Dagaut, P., Cathonnet, M., Aboussi, B. and Boettner, J.-C. (1990) Allene Oxidation: A Kinetic Modeling Study. Journal de Chimie Physique et de Physico-Chimie Biologique, 87, 1159-1172.
- Feng, Y., Niiranen, J.T., Bencsura, A., Knyazev, V.D., Gutman, D. and Tsang, W. (1993) Weak Collision Effects in the Reaction C2H5=C2H4+H. Journal of Physical Chemistry, 97, 871-880. http://dx.doi.org/10.1021/j100106a012
- Towell, G.D. and Martin, J.J. (1961) Kinetic Data from Nonisothermal Experiments: Thermal Decomposition of Ethane, Ethylene, and Acetylene. AIChE Journal, 7, 693-698. http://dx.doi.org/10.1002/aic.690070432
- Kiefer, J.H., Kapsalis, S.A., MAlami, M.Z. and Budach, K.A. (1983) The Very High Temperature Pyrolysis of Ethylene and the Subsequent Reactions of Product Acetylene. Combustion and Flame, 51, 79-93. http://dx.doi.org/10.1016/0010-2180(83)90085-8
- Dean, A.M. (1985) Predictions of Pressure and Temperature Effects upon Radical Addition and Recombination Reactions. Journal of Physical Chemistry, 89, 4600-4608. http://dx.doi.org/10.1021/j100267a038
- Fahr, A., Laufer, A., Klein, R. and Braun, W. (1991) Reaction Rate Determinations of Vinyl Radical Reactions with Vinyl, Methyl, and Hydrogen Atoms. Journal of Physical Chemistry, 95, 3218-3224. http://dx.doi.org/10.1021/j100161a047
- Knyazev, V.D., Bencsura, A., Stoliarov, S.I. and Slagle, I.R. (1996) Kinetics of the C2H3+H2=H+C2H4 and CH3+ H2=H+CH4 Reactions. Journal of Physical Chemistry, 100, 11346-11354. http://dx.doi.org/10.1021/jp9606568
- Janardhanan, V.M. and Deutschmann, O. (2006) CFD Analysis of a Solid Oxide Fuel Cell with Internal Reforming: Coupled Interactions of Transport, Heterogeneous Catalysis and Electrochemical Processes. Journal of Power Sources, 162, 1192-1202. http://dx.doi.org/10.1016/j.jpowsour.2006.08.017
- Lysaght, A.C. and Chiu, W.K.S. (2008) Modeling of the Carbon Nanotube Chemical Vapor Deposition Process Using Methane and Acetylene Precursor Gases. Nanotechnology 19, 165607. http://dx.doi.org/10.1088/0957-4484/19/16/165607
- Lacroix, R., Fournet, R., Ziegler-Devin, I. and Marquaire, P.-M. (2010) Kinetic Modeling of Surface Reactions Involved in CVI of Pyrocarbon Obtained by Propane Pyrolysis. Carbon, 48, 132–144. http://dx.doi.org/10.1016/j.carbon.2009.08.041
- Farhat, S., Panham, S., Gicquel, A., Silva, F., Brinza, O. and Lungu, C.P. (2010) Synthèse de Nanotubes Orientés par PECVD. Matériaux 2010, 18-22 October 2010, Nantes.
- Kee, R.J., Rupley, F.M., Miller, J.A., Coltrin, M.E., et al. (2001) CHEMKIN Collection, Release 3.6, Reaction Design, Inc., San Diego.
- JANAF (1965) “Thermochemical tables, National Standards Reference Data Series” Report NSRDS-NBS: Dow Chemikal Company, distributed by Clearinghouse for federal Scientific and Technical Information, PB168370.
- Kee, R.J., Dixon-Lewis, G., Warnatz, J. and Miller, J.A. (1986) A FORTRAN Computer Code Package for Evaluation of Gas-Phase, Multicomponent Transport Properties. Technical Report SAND86-8426, Sandia National Laboratories, Albuquerque.
- Sickafus, E.N. (1970) Sulfur and Carbon on the (110) Surface of Nickel. Surface Science, 19, 181-197. http://dx.doi.org/10.1016/0039-6028(70)90117-2
- Kee, R.J., Miller, J.A. and Jefferson, T.H. (1980) CHEMKIN: A General-Purpose, Problem-Independent, Transportable, Fortran Chemical Kinetics Code Package. Technical Report SAND80-8003, Sandia National Laboratories, Albuquerque.
- Farhat, S., Findeling, C., Silva, F., Hassouni, K. and Gicquel, A. (1997) Third Edition of the International Workshop Microwave Discharges: Fundamentals and Applications. Abbaye de Fontevraud, Fontevraud-l’Abbaye.
NOTES

*Corresponding author.